Back to Journals » Clinical Interventions in Aging » Volume 16
Development and Psychometric Validation of a New Scale for Assessment and Screening of Frailty Among Older Indians
Authors De K, Banerjee J ![]() , Rajan SP, Chatterjee P
, Rajan SP, Chatterjee P ![]() , Chakrawarty A, Khan MA, Singh V, Dey AB
, Chakrawarty A, Khan MA, Singh V, Dey AB ![]()
Received 3 December 2020
Accepted for publication 16 February 2021
Published 25 March 2021 Volume 2021:16 Pages 537—547
DOI https://doi.org/10.2147/CIA.S292969
Checked for plagiarism Yes
Review by Single anonymous peer review
Peer reviewer comments 2
Editor who approved publication: Prof. Dr. Nandu Goswami
Karishma De,1 Joyita Banerjee,1 Sreerag P Rajan,1 Prasun Chatterjee,1 Avinash Chakrawarty,1 Maroof A Khan,2 Vishwajeet Singh,1 Aparajit B Dey1
1Department of Geriatric Medicine, All India Institute of Medical Sciences, New Delhi, India; 2Department of Biostatistics, All India Institute of Medical Sciences, New Delhi, India
Correspondence: Aparajit B Dey
Department of Geriatric Medicine, All India Institute of Medical Sciences, Ansari Nagar, New Delhi, 110029, India
Tel +91 11 2659 3639
Fax +91 11 2658 8663
Email [email protected]
Background: Frailty is a major challenge for healthcare systems in ageing societies. This dynamic state of health is a reflection of reduced reserve in various organ systems and enhanced vulnerability to stressors. Research in this area of geriatrics and gerontology is limited in low- and middle-income countries (LMICs) like India. This study is directed at development of a culturally appropriate and validated assessment scale for frailty among older Indians.
Methods: After extensive review of the literature on existing scales, a preliminary draft scale was formed. This draft was pre- and pilot-tested to check feasibility and modified accordingly. The final scale was validated on 107 older adults by confirmatory factor analysis and was named the Frailty Assessment and Screening Tool (FAST). The Fried’s frailty phenotype was also administered on the same 107 older adults and scores of both were co-related. Suitable cut-off scores were found for frail and pre-frail older adults.
Results: The final version of the FAST consisted of 14 questions pertaining to 10 domains. It has good reliability. Cronbach’s alpha co-efficient was 0.99; test–retest reliability was 0.97 and validity by confirmatory factor analysis was adequate. The Kaiser–CMeyer–Olkin (KMO) of sampling adequacy was 0.699, and Bartlett’s test of sphericity was significant (χ2 = 353.471, p < 0.001). FAST scores had a cut-off of ≥ 7/14 for frail and ≥ 5/14 for pre-frail elderly.
Conclusion: The FAST is a validated tool with good psychometric properties. It is expected that it will be helpful in screening pre-frail and frail older adults in India and other LMICs and guide in clinical decision making for intervention.
Keywords: frailty, pre-frail, robust, screening tool, psychometry
Introduction
The unprecedented rise in human life expectancy and the resultant population ageing pose several challenges for health systems all over the world. Deteriorating health and functionality, declining sensory capacity and waning cognitive status frequently accompany the ageing process. Frailty is a recent addition to the lexicon of age-associated health issues. Frailty of ageing has not yet been included in the International Classification of Diseases (ICD). Still, the entity has attracted the attention of gerontologists and geriatricians, as a state of health with reduced reserve in various organ systems and increased vulnerability to minimal internal and external stressors.1 It is a conceptual framework of a clinically identifiable state which is associated with increased risk of institutionalization, hospitalization, and adverse outcomes.2 There is considerable ambiguity in the diagnostic criteria of “frailty in old age” as no gold standard exists. Debate on its conceptual and operational definition and translation into action for promotion of health in older adults continues.3
The Clinical Consortium on Healthy Ageing (CCHA) of the World Health Organization (WHO) in 2016 defined frailty as
a clinically recognizable state in which the ability of older people to cope with everyday or acute stressors is compromised by an increased vulnerability brought by age-associated declines in physiological reserve and function across multiple organ systems.4
The intermediate state between frail and robust (not frail) has been termed “pre-frail” and is also associated with adverse effects on health. Thus, the states of health, ie robust, pre-frail and frail, are in a state of dynamic continuum.5 Consequently, there is much potential for reversal of the pre-frail and frail states to the robust state with early identification and management.6,7
Rapidly ageing low- and middle-income countries (LMICs), such as India, are also facing the challenge of managing states of extreme ageing such as frailty and related issues, without having access to culturally compatible standardized instruments for measurement of the different constructs and domains.8,9 In a systematic review of frailty assessment instruments in 2016, 67 such instruments were identified.10 Out of these, the physical frailty phenotype model proposed by Fried et al and the deficit accumulation model or frailty index proposed by Rockwood et al are the most frequently used instruments in the literature.11,12
Literature on frailty from developing countries is extremely scant. A review published in 2015 identified only 14 studies – nine community based and five health care setting based – from Brazil, China, Mexico, Russia, India, and Peru.13 All but one of the studies in this review used the physical frailty phenotype model proposed by Fried et al,11 which indicates that, while high-income countries (HICs) have a choice of assessment instruments/tools, the choice for LMICs is limited. A recent study done on the Costa Rican population focuses on the deficit accumulation model and the flexibility to use it in different medical situations. This study also emphasizes that the frailty index and the phenotype models can complement each other to make a robust frailty measurement tool.14
LMICs' marked socio-economic and cultural differences from the HICs and lack of basic information, social hindrance and illiteracy affect adoption of common tools for frailty assessment.13 In order to improve the health care of the older population in LMICs, policies generated from evidence need to be put in place. For identifying frail patients in community and health care settings, the assessment of older patients as a part of comprehensive geriatric assessment (CGA) must include a culturally relevant, short and easy to administer instrument.13,15 Thus, development and validation of such a tool for LMICs like India is the need of the hour, when there is rapid expansion of postgraduate training in geriatrics and initiation of old age care services at all levels of the health system. This study aimed at developing and validating a culturally compatible, comprehensive screening scale for the older Indian population.
Methodology
Study Design and Settings
This study was implemented by the Department of Geriatric Medicine in the All India Institute of Medical Sciences (AIIMS), New Delhi. Approval was granted by the Institute Ethics Committee of AIIMS (IECPG-634/31.01.2018). Signed, informed consent was received from the participants prior to starting the study.
Study Population
Subjects of the study were patients over the age of 60 years, recruited from the clinical services under the Department of Geriatric Medicine of AIIMS. AIIMS is a tertiary care hospital and medical university under Ministry of Health and Family Welfare, Government of India, based in New Delhi. hospital medical research university New Delhi Ministry of Health and Family Welfare It caters to more than 4 million patients in the out patient departments (OPD) every year and has 3000 beds in all specialties. No medical insurance or referral is needed to access care in AIIMS. Very sick patients, ie bed-bound or moribund patients, patients with severe dementia and those who would not be able to undergo a detailed evaluation as required by the questionnaire, were excluded from the study.
Assessment and Recruitment
In view of the novelty of the study a convenience sampling strategy was adopted. Consecutive patients who fulfilled the inclusion criteria were approached to take part in the study. After receiving informed consent from subjects, socio-demographic details were collected and the frailty assessment questionnaire developed by the authors was administered. At the end of the session feedback regarding comprehensiveness and relevance of the questions asked was taken from the participants and documented. The time taken to finish the questionnaire was also recorded.
Sample Size
Pre- and pilot-studies were conducted with 20 and 30 participants, respectively; 107 participants were freshly recruited for validating the tool. The inclusion/exclusion criteria were the same for the pre-, pilot- and validation-studies.
Stages of Scale Development
Face Validation and Title of the Questionnaire
Face validity is a validation check done by experts to see the extent to which a test measures the underlying concept.16 Face validation was done by seven subject matter experts (SMEs) comprising of three geriatricians, one clinical psychologist, one psychiatrist, one clinical nutritionist and one physiatrist; each of them assessed the items, their construction and the sequencing of the questions for appropriateness. The instrument would be used to assess frailty in older persons, thus the title for the instrument was “Frailty assessment and screening tool or FAST”.
Formation of the Item Pool and Content Validation of the Scale
Based on a detailed literature review and focused group discussions, items for development of the questionnaire were selected. Some of the widely used frailty assessment scales were studied in depth, namely: the Edmonton Frail Scale,17 Tilburg Frailty assessment scale,18 Kihon Checklist,19 Fried’s physical frailty phenotype,11 and Rockwood’s frailty index of accumulated deficits.12 Informal interviews with open-ended, relevant questions were carried out before finalizing the content of the scale. Questions were meant to identify health and functionality issues of older adults and included symptoms, age-related deficits, and issues which impact their health and wellbeing. A draft questionnaire was formed and circulated among the SMEs to review and finalize the content. We started with around 60 questions, some with subparts, open-ended and not listed under specific domains. During this step questions on social support, nutrition, mood, affect and mobility domains were asked and objective tests of functionality like the short physical performance test (SPPT) battery were also included. The questions were discussed in focused group discussions with the SMEs and many items which were thought to be not important or redundant were removed.
The first draft of the scale comprised 21 items, pooled together but not organized in specific domains. The next step was computation of the content validity ratio (CVR).20 A panel of SMEs examined the items of the scale and, keeping the objectives of the study and the domains to be measured in mind, indicated whether the individual items were: (i) essential, (ii) useful but not essential, or (iii) not essential for the theoretical construct of the scale. The CVR was calculated according to the formula: CVR = (Ne-N/2)/(N/2) on the basis of the feedback received from experts, where Ne = number of experts who rated an item as essential and N = total number of experts on the panel.21
The content validity ratio can measure between −1.0 and 1.0. The content or question is considered to be more essential, the closer it is to CVR = 1.0. Conversely, the closer the CVR is to −1.0, the more non-essential it is. Conventionally, a CVR of 0.8–1 is considered good. The CVR for each item in the draft questionnaire was calculated. Items with CVRs ranging between 0.8 and 1 were retained and those with CVRs less than 0.5 were removed from the draft questionnaire. Items with CVRs between 0.5 and 0.8 were discussed again and those found to be relevant clinically were retained. Approval was granted by the SMEs regarding the final items to be included in the scale.
Pre-Study
The practical feasibility of the theoretically constructed tool was checked in the pre-study. The preliminary drafted questionnaire was administered to 20 older adults. It was found that many questions were difficult to carry out practically. The questions which were repetitive were either taken out or clubbed together to avoid redundancy. For example, initially there were two separate questions on continence, one on urinary and the other on fecal incontinence, which were later converted to a single question. Formation and wordings of sentences were changed wherever it was found difficult for the less literate participants to comprehend. With emphasis on language, non-technical terms which could be easily understood by participants were included. Seven questions, one from nutrition, two from memory, three from mobility and one from the physical performance domain were deleted and one question from the mood/affect domain was modified, thus making the item count 14. The items were then organized into 10 domains, namely: nutrition, mobility, memory, mood, physical performance, general health status, functional status, medication use, continence and pain.
Pilot-Study
The updated and modified tool, with 14 items, was administered on a second group comprising 30 subjects. Further changes were made in the questionnaire. Items were re-arranged in groups to fit a particular domain and questions. The final tool had 14 questions grouped in 10 domains. Test–retest reliability was checked after two weeks.
Validation of the Tool
Construct validity is the measure of how well the items in a questionnaire represent the underlying conceptual structure. Confirmatory factor analysis is one such method. The updated tool was applied on 107 freshly recruited participants. Confirmatory factor analysis was done to test if the questions with maximum factor loading adhered to the same domain. Comparing the total scores with the gold standard that is the Fried’s frailty criteria, by far the most frequently used index in frailty screening, was done for forming relevant cut-offs (using sensitivity analysis). Fried et al proposed a phenotype of frailty and pre-frailty depending on the presence of five criteria in an individual: (i) unintentional weight loss, (ii) self-reported reduced energy level, (iii) reduced grip strength, (iv) slowed gait speed, and (v) low level of physical activity. The presence of 3 or more of the above stated criteria denoted frailty and 1–2 criteria denoted a pre-frail condition.11 Many relevant changes were made in the new scale during the different stages of development. Modifications were made at every stage and finally a total of 14 items pertaining to 10 domains were retained (Table 1). Time required for completion of this scale by the clinician was limited to less than 15 minutes.
 |
Table 1 Socio-Demographic and Other Age-Related Characteristics of the Study Participants (n = 107) |
Interpretation of Scale Scoring
The total score of the tool summed to 14. The 10 domains had scores as follows: 2, 1, 2, 2, 1, 1, 1, 2, 1, 1, respectively. A higher score denotes a more frail condition. Table 2 summarizes the tool's characteristics. The tool was translated to Hindi, which is the common language spoken in the northern part of India where the study was carried out. A rigorous process of forward and backward translation was followed as per laid down norms.22
 |
Table 2 Phases of Development of FAST |
Statistical Analysis
STATA 12.1 software was used for statistical analysis. Descriptive analysis was carried out for socio-demographic data. The internal consistency of data in the overall sample was examined using the Cronbach’s alpha statistics. The intra-class correlation coefficient (ICC) was used to analyse test–retest reliability. As per the literature, values of more than 0.7 were considered acceptable for both Cronbach’s alpha and the ICC.23
Construct validity was tested by confirmatory factor analysis (CFA).24 Scores on the new frailty questionnaire were compared with Fried’s frailty phenotype. Fried’s score has been categorized into robust (0 out of a total of 5), pre-frail (a score of 1–2 out of a total of 5), and frail (more than equal to 3 out of a total of 5). Using these cut-offs as the gold standard, the cut-offs for FAST were taken out. A sensitivity analysis was done to identify the appropriate cut-offs to discriminate between robust, pre-frail, and frail. The cut-offs were chosen using the optimal cut-off method (cut-off corresponding to higher sensitivity and specificity covering the maximum population correctly classified).
Receiver operator characteristic (ROC) curves were drawn to determine the area under the curve using a random selection method in view of the small sample size. Kappa statistics were carried out to establish the level of agreement between Fried’s and the FAST scale score cut-offs.
Results
One hundred and seven subjects were recruited for the study. The mean (± SD) age of the study population was 69 (±6.9) years and 61% were males. The baseline characteristics of study subjects is shown in Table 1. Figure 1 shows the different stages in development of the scale. Table 2 depicts the different activities in the development of the scale at different stages. A higher score in any domain indicated worse and a lower score indicated better overall health status.
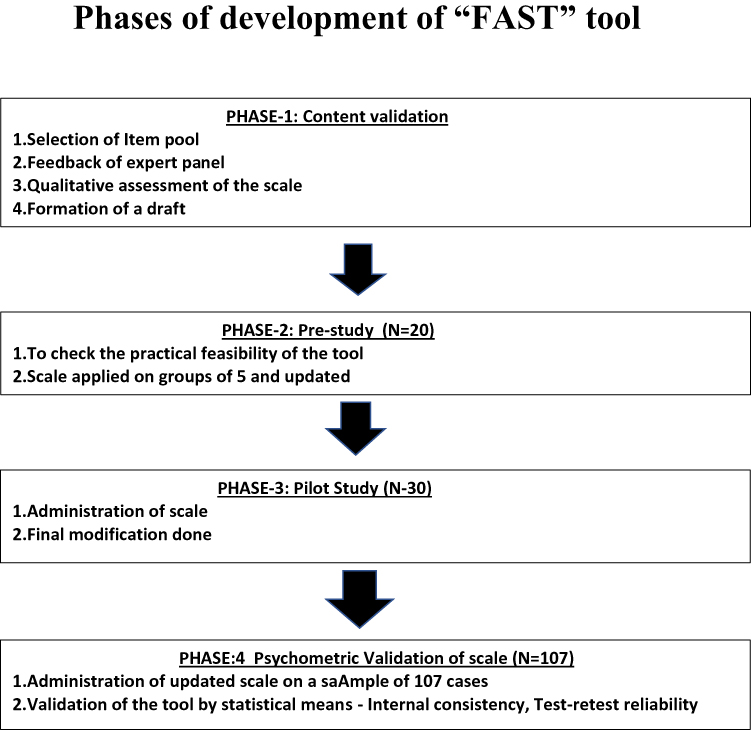 |
Figure 1 The different stages in the scale development; content validation, pre-study, pilot study and psychometric validation. |
Psychometric Attributes of the Scale
The reliability of the new tool was found to be outstanding, with a Cronbach’s alpha of 0.96. Regarding test–retest reliability, the ICC was also found to be 0.97. Internal consistency was re-calculated after removing some of the highly correlated items, but no significant change was observed in Cronbach’s alpha score (0.96 versus 0.97). Time taken to complete the questionnaire was 15± 5 minutes; 95% of patients were satisfied with the questions being asked and did not have misgivings about answering them. Positive feedback was received from the participants. Only 5% were less co-operative, which could be attributed to various reasons including pain, discomfort, or anxiety related to their health conditions. A wide range of scores, from 1 to 11, ruled out any floor or ceiling effects of the tool.
Confirmatory factor analysis of the FAST with factor loading of the items is described in Table 2. The Kaiser–Meyer–Olkin (KMO) test measures sampling adequacy of each domain and the whole questionnaire in total. KMO was checked and a score of 0.699 indicated moderate to good adequacy. The inter-correlation between factors to check redundancy was done using the Bartlett’s test of sphericity. This test was found to be statistically significant (χ2 = 353.471 <0.001).24,25 Even though the factor loading of the second question of two domains (nutrition and mobility) was < 0.4, these questions were retained in the same domain as they were clinically relevant (Table 3). Sensitivity analysis of the FAST was compared with Fried’s criteria and suitable cut-off scores decided for frail and pre-frail subjects. Thus, pre-frail was defined as having scores of 4–5 out of 14, with a sensitivity of 81.8% and a specificity of 71.93%. An ROC was drawn and the area under the curve was found to be 0.84. To differentiate frail from pre-frail, a score of ≥ 7 out of 14 was chosen as the optimum cut-off, with a sensitivity of 88.46% and a specificity of 63.63%; the area under the curve (AOC) was found to be 0.83. Further, the cut-off point for robust versus pre-frail or frail remains ≥ 5 out of 15, with a sensitivity of 89.5% and a specificity of 71.9%; the area under the curve was found to be 0.90. The cut-off points for robust or pre-frail versus frail remains ≥ 7, with a sensitivity of 88.4% and a specificity of 84.8%; the AOC for this was 0.92 (Figures 2A–D). The value of kappa statistics was 0.532, showing moderate agreement between the score cut-offs in the Fried's and the FAST scales.
 |
Table 3 Domains, Questions, Factor Loading Items and Confirmatory Factor Analysis of FAST |
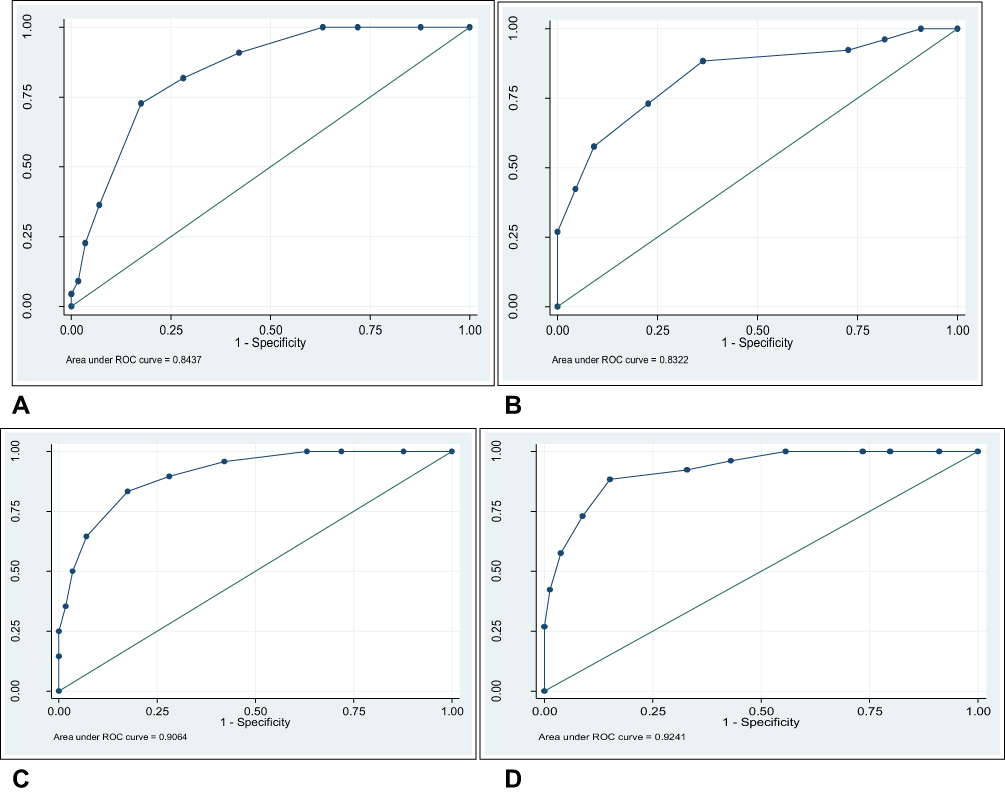 |
Figure 2 (A–D) depicts the receiver operator characteristic curve (ROC) and area under curve to predict cut-off scores of pre-frail from robust (A), frail from pre-frail (B), robust from pre-frail or frail (C), and frail from pre-frail and robust (D) older participants. |
Discussion
Frailty has emerged as a major health challenge for ageing populations, requiring early detection and intervention. There is substantial literature about the concept, its adverse outcomes and assessment measures; however, it mostly focuses on the HICs and there is limited data from LMICs such as India.8,13,26 While the HICs have managed communicable diseases successfully, LMICs like India are facing a double burden of both communicable and non-communicable diseases. In such a situation, old age care has received less attention until now but, with the ageing population, it is becoming increasingly relevant.
The origin of the concept of frailty as an entity in clinical practice can be traced to two popular diagnostic paradigms. Frailty as a phenotype emerged from analysis of the Cardiovascular Health Study in the USA11 while frailty as an accumulation of multiple deficits originated from the Canadian Study of Health and Ageing.12 While the frailty index is a measure of the genesis, the frailty phenotype is the outcome. In the following years, several assessment tools were developed in many HICs using a variety of concepts and have been integrated into health services for older persons.3,17–19,27
These instruments have laid substantial emphasis on the physical problems of old age while conceptualizing a definition of frailty; however, frailty often goes beyond medical issues.27 Many easy to use scales have been developed subsequently, the FRAIL scale being one of them with questions related to fatigue, resistance, ambulation, illnesses, and loss of weight with strong statistical evidence.27 In this decade there have been concerted efforts to create consensus in conceptualizing and defining frailty in old age.2 International and national professional societies from HICs reached a consensus that physical frailty is a medical syndrome of advancing years, which can be prevented with appropriate interventions by detecting all persons over 70 years of age using simple and rapid screening tests.2 It was recognized that frailty is a state of “multi-system dys-regulation” with a biological basis, which is a part of the continuum of the ageing process where one moves on from independent robustness to a frail and dependent state.4 The CCHA also recommends proactively identifying people in the pre-frail stage using a person-centred, individualized intervention by a re-oriented health system.4 The 2019 International Conference on Frailty and Sarcopenia Research (ICFSR) recommended clinical practice guidelines for the identification and management of frailty in older adults.28 The task force recommended use of validated frailty assessment tools and subsequent detailed clinical assessment in patients identified in screening to detect the signs and underlying pathological process.29
Frailty research in India is limited to a few publications. In two hospital-based studies from two different geographical locations, frailty was identified in 33%8 and 21%30 of hospitalized older patients by using a frailty phenotype assessment.11 In a community-based study, 38.8% of older adults were detected as frail using the Tilburg Frailty assessment scale.31 Health system reorientation for care of the older population has gained momentum in India in the last te years with the launching of a national program by the government which has resulted in expansion of services, training in geriatric medicine, and research in health and wellbeing in old age. Development of an assessment tool for detection of frailty among older patients by health professionals is a part of steps to strengthening research and service provision in late life.
A large majority of old and new screening tools available does not comprehensively assess all domains related to the genesis of frailty. Most of the commonly used frailty assessment tools such as the Edmonton Frail Scale,17 Tilburg Frailty assessment scale,18 Kihon Checklist,19 FRAIL scale.27 Groningen Frailty Indicator,32 and so on have considered different aspects of geriatric assessment during development. FAST has been developed keeping in mind the cultural and social background of the older Indian population and the translated Hindi version is easy to comprehend. The interview format can be easily administered by trained health care workers keeping in mind the skewed doctor–patient ratio in developing countries. With 14 questions, including one physical activity, the assessment can be completed in about 15± 5 minutes. In addition to the integral conceptual domains, FAST has a few novelties in its domain composition such as pain, timed up and go (TUG) test and multi-morbidity (Supplementary Material). The association of pain and frailty is a relatively new concept being explored by different researchers lately. Most of the older frailty assessment scales do not include the component of pain. Persistent pain was found to be a risk factor for development of frailty in a systemic review and meta-analysis.33 The predictive power of Fried’s frailty phenotype scale was shown to improve with regard to adverse outcomes in an older population when pain assessment was added to it.34 The TUG test has been included in this scale for assessment of physical performance and mobility. TUG, alone, has proven to be a very strong predictor of frailty in previous studies.35 Multi-morbidity is a summarization of the cumulative deficit scale of Rockwood, converted to a dichotomous variable that is the presence or absence of two or more illnesses. Complementing the multi-morbidity question is the poly-pharmacy question, ascertaining whether the patient is consuming five drugs and more or less. Questions on social support, which are present in some existing scales, were removed during the initial steps of item selection after focused group discussion with the SMEs, in order to keep the scale short and crisp. In India and a few other Southeast Asian countries, a joint family system and the culture of offspring taking care of older parents is still prevalent. In our study, too, the majority of the subjects were residing with their spouse and children (84%). Although the joint family system is now weakening, with children migrating from rural homes to cities and abroad in search of employment thus leading to more nuclear families, the culture of supporting older parents is still prevalent. In all, the scale provides a comprehensive overview of health and illness status which can be used in the health system, from primary care to specialized tertiary care, to detect pre-frail and frail patients so that personalized care can be designed for them. The good sensitivity of the tool helps in efficiently spotting the frailty state.
Limitations
This study was done in a single center, which can be a potential limitation to its findings being generalized. As both the scales were administered by the same person, there might be a possibility of interviewer bias. The scale needs to be validated in multiple health care and community settings involving a large number of subjects from diverse socio-economic backgrounds. Validating a multidimensional scale like FAST using a scale with a predominantly physical domain (Fried’s) may not be the best method of validation; however, considering the fact that there is no widely accepted frailty assessment tool globally and Fried’s frailty criteria still remains a widely used measure for frailty assessment, Fried’s criteria was taken as the reference point for validation in this study.
Conclusion
The FAST is a validated, easy to use, short screening tool with strong psychometric properties. It can be used to detect frail and pre-frail subjects from a population of older adults in India and it may be worth investigating its role in the assessment of frailty in other LMICs.
Abbreviations
LMIC, Low- and middle-income country; HIC, Hig- income country; ICFSR, International Conference on Frailty and Sarcopenia Research; CCHA, Clinical Consortium on Healthy Ageing; ICD, International Classification of Diseases; MNA, Mini Nutritional Assessment; CFA, Confirmatory factor analysis; CVR, Content validity ratio; SME, Subject matter expert; ROC, Receiver operator characteristic; ICC, Intra class co-efficient; AUC, Area under curve; SD, Standard deviation; CGA, Comprehensive Geriatric Assessment; BMI, Body mass index; TUG, Timed up and go test; FAST, Frailty Assessment and Screening Tool; AIIMS, All India Institute of Medical Sciences.
Data Sharing Statement
The datasets generated and/or analyzed during the current study are not publicly available as they are still being used for analyses but are available from the corresponding author on reasonable request.
Ethics Approval and Consent to Participate
The present study was approved by the Institutional Ethics Committee of the All India Institute of Medical Sciences, New Delhi, India. All participants gave informed, written consent. This study was conducted in accordance with the Declaration of Helsinki.
Acknowledgments
The authors would like to thank all study participants. They also acknowledge the help and support provided by all faculty and staff in the Department of Geriatric Medicine, All India Institute of Medical Sciences, New Delhi, India.
Author Contributions
All authors made substantial contributions to the conception and design, acquisition of data, or analysis and interpretation of data; took part in drafting the article or revising it critically for important intellectual content; agreed to submit to the current journal; gave final approval of the version to be published; and agree to be accountable for all aspects of the work.
Funding
No funding has been received for this work.
Disclosure
The authors disclosed no conflicts of interest or competing interests for this work.
References
1. Rodríguez-Mañas L, Féart C, Mann G, et al. Searching for an operational definition of frailty: a Delphi method based consensus statement: the frailty operative definition-consensus conference project. J Gerontol a Biol Sci Med Sci. 2013;68(1):62–67. doi:10.1093/gerona/gls119
2. Morley JE, Vellas B, Van Kan GA, et al. Frailty consensus: a call to action. J Am Med Dir Assoc. 2013;14(6):392–397. doi:10.1016/j.jamda.2013.03.022
3. Ambagtsheer R, Visvanathan R, Cesari M, et al. Feasibility, acceptability and diagnostic test accuracy of frailty screening instruments in community-dwelling older people within the Australian general practice setting: a study protocol for a cross-sectional study. BMJ Open. 2017;7(8):e016663. doi:10.1136/bmjopen-2017-016663
4. World Health Organisation. WHO Clinical Consortium on Healthy Ageing. Report of Consortium Meeting 1–2 December 2016 in Geneva, Switzerland. Licence: CC BY-NC-SA 3.0 IGO. Geneva: World Health Organization; 2018.
5. Lang PO, Michel JP, Zekry D. Frailty syndrome: a transitional state in a dynamic process. Gerontology. 2009;55(5):539–549. doi:10.1159/000211949
6. Woo J. Designing fit for purpose health and social services for ageing populations. Int J Environ Res Public Health. 2017;14(5):457. doi:10.3390/ijerph14050457
7. Dent E, Lien C, Lim WS, et al. The Asia-Pacific clinical practice guidelines for the management of frailty. J Am Med Dir Assoc. 2017;18(7):564–575.
8. Khandelwal D, Goel A, Kumar U, Gulati V, Narang R, Dey AB. Frailty is associated with longer hospital stay and increased mortality in hospitalized older patients. J Nutr Health Aging. 2012;16(8):732–735. doi:10.1007/s12603-012-0369-5
9. Siriwardhana DD, Hardoon S, Rait G, Weerasinghe MC, Walters KR. Prevalence of frailty and prefrailty among community-dwelling older adults in low-income and middle-income countries: a systematic review and meta-analysis. BMJ Open. 2018;8(3):e018195. doi:10.1136/bmjopen-2017-018195
10. Buta BJ, Walston JD, Godino JG, et al. Frailty assessment instruments: systematic characterization of the uses and contexts of highly-cited instruments. Ageing Res Rev. 2016;26:53–61. doi:10.1016/j.arr.2015.12.003
11. Fried LP, Tangen CM, Walston J, et al. Frailty in older adults: evidence for a phenotype. J Gerontol a Biol Sci Med Sci. 2001;56(3):M146–M157. doi:10.1093/gerona/56.3.M146
12. Rockwood K, Howlett SE, MacKnight C, et al. Prevalence, attributes, and outcomes of fitness and frailty in community-dwelling older adults: report from the Canadian study of health and aging. J Gerontol a Biol Sci Med Sci. 2004;59(12):1310–1317. doi:10.1093/gerona/59.12.1310
13. Nguyen T, Cumming RG, Hilmer SN. A review of frailty in developing countries. J Nutr Health Aging. 2015;19(9):941–946. doi:10.1007/s12603-015-0503-2
14. Pérez-Zepeda MU, Cesari M, García-Peña C. Predictive value of frailty indices for adverse outcomes in older adults. Revista De Investigación Clínica. 2016;68(2):92–98.
15. Clegg A, Young J, Iliffe S, Rikkert MO, Rockwood K. Frailty in elderly people. Lancet. 2013;381(9868):752–762. doi:10.1016/S0140-6736(12)62167-9
16. Moores KL, Jones GL, Radley SC. Development of an instrument to measure face validity, feasibility and utility of patient questionnaire use during health care: the QQ-10. Int J Qual Health Care. 2012;24(5):517–524. doi:10.1093/intqhc/mzs051
17. Rolfson DB, Majumdar SR, Tsuyuki RT, Tahir A, Rockwood K. Validity and reliability of the Edmonton Frail Scale. Age Ageing. 2006;35(5):526–529. doi:10.1093/ageing/afl041
18. Gobbens RJ, van Assen MA, Luijkx KG, Wijnen-Sponselee MT, Schols JM. The Tilburg frailty indicator: psychometric properties. J Am Med Dir Assoc. 2010;11(5):344–355. doi:10.1016/j.jamda.2009.11.003
19. Nemoto M, Yabushita N, Kim MJ, Matsuo T, Seino S, Tanaka K. Assessment of vulnerable older adults’ physical function according to the Japanese Long-Term Care Insurance (LTCI) system and Fried’s criteria for frailty syndrome. Arch Gerontol Geriatr. 2012;55(2):385–391. doi:10.1016/j.archger.2011.10.004
20. Wilson FR, Pan W, Schumsky DA. Recalculation of the critical values for Lawshe’s content validity ratio. Measure Eval Counsel Dev. 2012;45(3):197–210. doi:10.1177/0748175612440286
21. Ayre C, Scally AJ. Critical values for Lawshe’s content validity ratio: revisiting the original methods of calculation. Measure Eval Counsel Dev. 2014;47(1):79–86. doi:10.1177/0748175613513808
22. World Health Organization (WHO). Process of translation and adaptation of instruments; 2016. Available from: http://www.who.int/substance_abuse/research_tools/translation/en/.
23. Tavakol M, Dennick R. Making sense of Cronbach’s alpha. Int J Med Educ. 2011;2:53–55. doi:10.5116/ijme.4dfb.8dfd
24. Mueller RO, Hancock GR. Factor analysis and latent structure, confirmatory. Smelser NJ, Baltes PB, editors. International Encyclopedia of the Social & Behavioral Sciences. 2001. Available from: https://www.sciencedirect.com/referencework/9780080430768/international-encyclopedia-of-the-social-and-behavioral-sciences.
25. Kaiser HF. An index of factorial simplicity. Psychometrika. 1974;39(1):31–36. doi:10.1007/BF02291575
26. Gray WK, Richardson J, McGuire J, et al. Frailty screening in low‐and middle‐income countries: a systematic review. J Am Geriatr Soc. 2016;64(4):806–823. doi:10.1111/jgs.14069
27. Morley JE, Malmstrom TK, Miller DK. A simple frailty questionnaire (FRAIL) predicts outcomes in middle aged African Americans. J Nutr Health Aging. 2012;16(7):601–608. doi:10.1007/s12603-012-0084-2
28. Gobbens RJ, Luijkx KG, Wijnen-Sponselee MT, Schols JM. Towards an integral conceptual model of frailty. J Nutr Health Aging. 2010;14(3):175–181. doi:10.1007/s12603-010-0045-6
29. Dent E, Morley JE, Cruz-Jentoft AJ, et al. Physical frailty: ICFSR international clinical practice guidelines for identification and management. J Nutr Health Aging. 2019;23(9):771–787. doi:10.1007/s12603-019-1273-z
30. Chatterjee P, Kandel R, Desai G, Chellaiyan VG, Biswas A, Dey AB. Development of simple diagnostic criteria for frailty syndrome in Indian elderly population. Int J Med Pharm Sci. 2014;4(5):21–30.
31. Dasgupta A, Bandyopadhyay S, Bandyopadhyay L, Roy S, Paul B, Mandal S. How frail are our elderly? An assessment with Tilburg frailty indicator (TFI) in a rural elderly population of West Bengal. J Fam Med Prim Care. 2019;8(7):2242–2248. doi:10.4103/jfmpc.jfmpc_445_19
32. Steverink N. Measuring frailty: developing and testing the GFI (Groningen Frailty Indicator). Gerontologist. 2001;41:236.
33. Saraiva MD, Suzuki GS, Lin SM, de Andrade DC, Jacob-Filho W, Suemoto CK. Persistent pain is a risk factor for frailty: a systematic review and meta-analysis from prospective longitudinal studies. Age Ageing. 2018;47(6):785–793. doi:10.1093/ageing/afy104
34. Lohman MC, Whiteman KL, Greenberg RL, Bruce ML. Incorporating persistent pain in phenotypic frailty measurement and prediction of adverse health outcomes. J Gerontol A Biol Sci Med Sci. 2017;72(2):216–222. doi:10.1093/gerona/glw212
35. Savva GM, Donoghue OA, Horgan F, O’Regan C, Cronin H, Kenny RA. Using timed up-d-go to identify frail members of the older population. J Gerontol A Biol Sci Med Sci. 2013;68(4):441–446. doi:10.1093/gerona/gls190
 © 2021 The Author(s). This work is published and licensed by Dove Medical Press Limited. The
full terms of this license are available at https://www.dovepress.com/terms
and incorporate the Creative Commons Attribution
- Non Commercial (unported, 3.0) License.
By accessing the work you hereby accept the Terms. Non-commercial uses of the work are permitted
without any further permission from Dove Medical Press Limited, provided the work is properly
attributed. For permission for commercial use of this work, please see paragraphs 4.2 and 5 of our Terms.
© 2021 The Author(s). This work is published and licensed by Dove Medical Press Limited. The
full terms of this license are available at https://www.dovepress.com/terms
and incorporate the Creative Commons Attribution
- Non Commercial (unported, 3.0) License.
By accessing the work you hereby accept the Terms. Non-commercial uses of the work are permitted
without any further permission from Dove Medical Press Limited, provided the work is properly
attributed. For permission for commercial use of this work, please see paragraphs 4.2 and 5 of our Terms.