Back to Journals » Clinical and Experimental Gastroenterology » Volume 12
Development and psychometric evaluation of the Diabetic Gastroparesis Symptom Severity Diary
Authors Fehnel S ![]() , Fiedorek FT
, Fiedorek FT ![]() , Nelson L, DiBenedetti D
, Nelson L, DiBenedetti D ![]() , Spence S
, Spence S ![]() , Carson RT
, Carson RT
Received 15 August 2018
Accepted for publication 12 December 2018
Published 22 February 2019 Volume 2019:12 Pages 93—103
DOI https://doi.org/10.2147/CEG.S184016
Checked for plagiarism Yes
Review by Single anonymous peer review
Peer reviewer comments 3
Editor who approved publication: Professor Anastasios Koulaouzidis
Video abstract presented by Robyn T Carson.
Views: 2811
Sheri Fehnel,1 Fred T Fiedorek,2 Lauren Nelson,1 Dana DiBenedetti,1 Sharon Spence,2 Robyn T Carson3
1Patient-Centered Outcomes Assessment, RTI Health Solutions, Research Triangle Park, NC, USA; 2Motus Therapeutics, Inc., Boston, MA, USA; 3Patient-Centered Outcomes Research, Global Evidence and Value Development, Allergan plc, Madison, NJ, USA
Background: Diabetic gastroparesis (DG) is defined as delayed gastric emptying with associated gastrointestinal symptoms, without mechanical obstruction. Patient-reported symptoms are critical for diagnosis and evaluation of treatment benefit in DG. The Diabetic Gastroparesis Symptom Severity Diary (DGSSD), a new patient-reported outcome measure, was developed for use in clinical trials to support product approval and labeling claims for DG treatments.
Materials and methods: Initial DGSSD development was based on a review of the existing instruments and qualitative research (focus groups and cognitive debriefing interviews) in 41 patients with DG. Psychometric evaluations (individual items and composite scores) were conducted using data from Phase IIa and IIb relamorelin clinical trials.
Results: Qualitative research in patients with DG resulted in a six-item DGSSD, included in the Phase IIa trial, addressing symptom severity for nausea, vomiting, abdominal pain, early satiety, and bloating, as well as vomiting frequency. An item addressing severity of postprandial fullness (PPF) was subsequently added based on regulatory advice and included in the Phase IIb trial. Measurement properties were generally strong for weekly averages of daily item and composite scores. Item-level intraclass correlation coefficients ranged from 0.79 to 0.97 and correlations with other measures matched hypothesized patterns; the discriminating ability and responsiveness of the DGSSD were also supported. Multiple methods supported the computation of a composite score based on items addressing nausea, abdominal pain, bloating, and PPF severity.
Conclusion: Qualitative and quantitative evidence support use of the DGSSD as a reliable and valid measure from which to derive endpoints to evaluate treatment benefit in future DG interventional trials.
Keywords: diabetes, relamorelin, patient-reported outcome, instrument
Introduction
Gastroparesis is defined as delayed gastric emptying in the absence of mechanical obstruction. Symptoms of gastroparesis include nausea, vomiting, abdominal pain, early satiety, bloating, and postprandial fullness (PPF); these symptoms affect 20%–40% of diabetic patients, with or without delayed gastric emptying, and can often be frequent and debilitating.1,2 Diabetic gastroparesis (DG) is associated with decreased quality of life among patients and an increased burden on society.3,4 Currently, there is a lack of safe and effective long-term treatment options.5,6
Relamorelin, a pentapeptide ghrelin receptor agonist with potent prokinetic effects, was shown to accelerate gastric emptying in Phase IIa and IIb trials (NCT01571297 and NCT02357420, respectively),7,8 and is in Phase III clinical development for improvement of DG symptoms.
Patient-reported outcome (PRO) measures are critical to the evaluation of symptom improvement in DG, given that the patient symptom experience is complex and often highly subjective. Currently, there are a few gastrointestinal PRO measures available that address the symptoms of gastroparesis, notably the Gastroparesis Cardinal Symptom Index-Daily Diary (GCSI-DD) and the Patient Assessment of Upper Gastrointestinal-Symptom Severity Index (PAGI-SYM), from which the GCSI-DD was initially developed.9,10 However, there are currently no PRO measures to support product approvals and labeling claims for gastroparesis that meet US Food and Drug Administration (FDA) criteria.11,12
Therefore, the objective of this study was to develop and evaluate the psychometric performance of a DG symptom diary, in accordance with the FDA PRO guidance, to support key endpoints for relamorelin clinical trials and assess the efficacy of future treatments for DG.
Materials and methods
Development of the Diabetic Gastroparesis Symptom Severity Diary (DGSSD)
Following a targeted literature and instrument review, qualitative research was conducted with 41 participants with DG through focus groups and cognitive debriefing interviews. The research was carried out in accordance with the Declaration of Helsinki. In addition, all study-related materials were reviewed and approved by RTI International’s institutional review board prior to recruitment, and all participants provided written, informed consent before participation.
Focus groups
Five focus groups were conducted to identify concepts and inform the development of the new patient-reported diary measuring DG symptom severity. Participants were identified and recruited from gastroenterology clinics in three locations in the USA. In order to qualify for inclusion, participants had to be aged 18–70 years, diagnosed with diabetes, and they must have experienced gastroparesis symptoms for at least 3 months, with delayed gastric emptying confirmed by scintigraphy. The focus group target population was aligned with the expected study population for clinical trials evaluating DG.
The focus groups were conducted by two experienced moderators, according to a semi-structured discussion guide. Participants were asked general open-ended questions regarding their experience with DG, symptoms experienced, and the impact of gastroparesis and related treatments on their daily activities and lives in general. All focus group discussions were recorded, transcribed, and verified. Thematic analysis of the focus group data was conducted using both the transcripts and field notes.
Item development
Findings from the focus groups were used to select the concepts for measurement in the DGSSD, based on the frequency of mention and the extent to which symptoms were described as distinct and bothersome. Multiple items were drafted for each of the selected concepts in order to test different question wordings and response scales in cognitive debriefing interviews.
Cognitive debriefing and item refinement
Cognitive debriefing interviews with patients with DG who did not participate in the focus groups were conducted in three iterative sets, in three locations within the USA. Screening criteria and recruitment methods were identical to those of the focus groups, and the interviews were conducted by the same two moderators. Where possible, participants from diverse racial/ethnic and educational backgrounds were selected.
Each interview began with a brief concept-elicitation phase in order to support the concepts of measurement. Specifically, participants were asked to describe their DG symptoms and experiences with any previous treatments. During cognitive debriefing, participants were asked to respond to the draft items while describing their thought processes orally. Directed “probes” were also used to collect information about the way in which the items were interpreted by the participants and their thoughts about the available response options.
Findings from the iterative sets of interviews were used to refine the draft item pool, resulting in the six-item DGSSD addressing symptom severity for nausea, vomiting, abdominal pain, early satiety, and bloating, as well as vomiting frequency.
Psychometric evaluation of the DGSSD
Clinical study designs
The Phase IIa and IIb relamorelin clinical trials have been described previously.7,8 In brief, these were randomized, double-blind, placebo-controlled, multiple-dose studies that evaluated the safety and efficacy of relamorelin for symptoms and gastric emptying in patients with moderate-to-severe DG. In the Phase IIa trial, treatment was administered over a 4-week period, with a 1-week single-blind placebo run-in; the Phase IIb trial consisted of 12 weeks of treatment, with a 2-week single-blind placebo run-in.
Phase IIa data collection
Data from the Phase IIa clinical trial of relamorelin were used to conduct a preliminary psychometric evaluation of the six-item DGSSD, which was administered to patients using an electronic diary. Severity of nausea, vomiting, abdominal pain, and bloating were assessed using a 0–10 numerical rating scale (NRS), where 0 corresponded to “no symptoms at all” and 10 to “worst possible symptoms”; early satiety was measured using a 5-point verbal rating scale (VRS), where participants could select the description that most closely matched the quantity they were able to eat before feeling full, ranging from just one or two bites to completion of a normal meal. Raw scores on the early satiety item were transformed to range from 0 to 10, as described previously.7 Vomiting frequency was captured as a discrete, numerical variable. The GCSI-DD and the PAGI-SYM were also administered to assess construct validity and provide context for the DGSSD results.
Phase IIb data collection
Following regulatory advice, an item addressing the severity of PPF was added to the DGSSD, resulting in a seven-item measure, which was used in the Phase IIb trial (the remaining items were not modified). PPF was measured using a 0–10 NRS (0 corresponded to “no symptoms at all” and 10 to “worst possible symptoms”). Patients completed the seven-item DGSSD using an electronic diary. Several additional PRO measures were included in the Phase IIb trial: GCSI-DD, PAGI-SYM, symptom-specific Patient Global Impression of Status (PGIS) items and global PGIS-DG, and symptom-specific Patient Global Impression of Change (PGIC) items and global PGIC-DG. These measures were used to assess construct validity and provide context for the DGSSD results.
Phase IIa statistical and psychometric analyses
Data from all relamorelin and placebo arms were pooled for analysis. In order to compute weekly scores, data were required for a minimum of 4 days in each week. For items addressing symptom severity, the weekly score was computed as the average of the daily responses. Normalized weekly vomiting frequency was calculated by dividing 7 (days) by the number of days in that week with non-missing responses, and multiplying this by the sum of the daily responses in the week. The performance of a weekly 4-symptom composite score comprising severity ratings for nausea, abdominal pain, early satiety, and bloating (range, 0–40 points) was also psychometrically tested.
Descriptive statistics were used to summarize the demographic data and the DGSSD daily and weekly individual item and composite scores. Data from Weeks 3 and 4 were used to assess test–retest reliability using intraclass correlation coefficients (ICCs). An ICC value of ≥0.70 was deemed adequate.13
Construct validity of the DGSSD items and composite score was assessed by testing a priori hypotheses using Pearson correlation coefficients to compare the direction and strength of the relationships between the weekly DGSSD scores and those of the GCSI-DD and PAGI-SYM: ≥0.50 was a strong absolute correlation value, 0.30–0.49 was considered moderate, and 0.10–0.29 was considered small.14
ANOVA was used to examine known-groups validity, using the uppermost and lowest quartiles of the global status item at Week 4. The hypothesis was that patients with higher global status item scores would have greater DGSSD scores, and vice versa, tested at the P<0.05 level.
Responsiveness was evaluated using an effect size estimate.15 DGSSD changes for subgroups were reported based on global change item response. Patients who reported improvement were classified as responders; patients whose symptoms were unchanged or worsened were classified as non-responders.
Phase IIb statistical and psychometric analyses
Data from all relamorelin and placebo arms were pooled for analysis. Weekly item and composite level scores were computed as described in the previous section. Descriptive statistics were used to summarize the demographic data and the DGSSD daily and weekly individual item and composite scores, as well as the GCSI-DD, PAGI-SYM, symptom-specific PGIS, and PGIS-DG scores. Data from Weeks 11 and 12 were used to assess test–retest reliability using ICCs.13
Composite scores comprising combinations of the individual items were assessed at baseline, Week 11, and Week 12 of the Phase IIb trial. Although various alternatives were explored, including a 5-symptom composite score comprised of all symptoms measured on a 0–10 NRS, results are presented for one 3-symptom composite score (nausea, abdominal pain, and PPF) and three 4-symptom composite scores (nausea, abdominal pain, PPF, and bloating; nausea, abdominal pain, early satiety, and bloating; and nausea, abdominal pain, PPF, and early satiety).
Construct validity of the DGSSD items and composite scores was assessed by testing a priori hypotheses on the direction and strength of the relationships between the weekly DGSSD scores and those of the other PRO measures.14 ANOVA was used to assess known-groups validity by testing mean differences in weekly DGSSD item scores between patients classified into subgroups based on the corresponding symptom-specific PGIS at baseline and Week 12. The PGIS-DG was used to form subgroups for comparison of the weekly composite scores.
Three types of responsiveness effect size estimates were computed: average DGSSD change from baseline to Week 12 divided by the SD of the baseline scores (change in SD of baseline measurement units); average DGSSD change from baseline to Week 12 divided by the SD of the change score (standardized response mean); and average DGSSD change from baseline to Week 12 among patients classified as “improved,” “no change,” and “worsened” based on the symptom-specific PGIC.
An exploratory factor analysis was conducted to investigate relationships between the DGSSD items; iterated principal factor analysis was the primary method for factor extraction and an oblique rotation (promax) was the primary rotation method. A path diagram was used to illustrate factor groupings.
Results
Qualitative research
Focus groups
Of the 21 patients who participated in the focus groups, 17 (81%) were female and the mean age was 52.8 years. Twelve patients had type 2 diabetes (57%) and nine had type 1 diabetes (43%). The average length of time following diabetes diagnosis was 17 years, with an average duration of 7.5 years with DG symptoms. Fifteen participants (71%) reported using medication to treat their gastroparesis symptoms; however, all participants remained symptomatic.
Nausea, vomiting, abdominal pain, bloating, and early satiety/PPF were reported by participants in all five focus groups and were generally described consistently. Additional symptoms reported in three or four of the focus groups included weight loss (four groups), weight gain (four groups), and choking or difficulty swallowing (three groups). Importantly, participants did not generally distinguish between the concepts of early satiety and PPF, as both related to a sense of fullness more significant than one would expect based on the quantity eaten. Concept saturation was achieved; although 19 DG symptoms and impacts were reported by the first focus group, each subsequent focus group generated only one or two new concepts, which were generally impacts rather than symptoms of DG.
Cognitive debriefing interviews
Of the 20 interview participants, 14 (70%) were female and the mean age was 52.0 years. Twelve participants (60%) had type 2 diabetes and eight (40%) had type 1 diabetes. The average length of time following diabetes diagnosis was 20 years, with an average duration of 8 years with DG symptoms. Of this sample, nine participants (45%) reported vomiting in the past month.
The symptoms mentioned by interview participants were consistent with those described during the focus groups. Across all interviews (n=20), nausea was reported by 19 participants (95%), 14 reported vomiting (70%), 12 reported bloating (60%), 11 reported early satiety (55%), and nine reported abdominal pain (45%).
In all three rounds of interviews, participants reported that the instructions and the draft DGSSD items were clear and easy to understand, and that the 24-hour recall period was an appropriate length. Both the 0–10 NRS and 5-point VRS were tested with questions assessing symptom severity for nausea, abdominal pain, early satiety, and bloating; a significant preference was observed by participants for the 0–10 NRS for all items except early satiety. Among the four items tested to address early satiety, a question using a 5-point VRS asking how much of a normal-sized meal participants could eat before feeling full was understood and answered most easily. Participants consistently reported that the DGSSD items formed a comprehensive and useful assessment of gastroparesis symptoms.
The qualitative research from the focus groups and interviews resulted in a six-item DGSSD, designed to measure symptom severity for nausea, vomiting, abdominal pain, early satiety, and bloating, as well as vomiting frequency.
Psychometric evaluation
Demographics and baseline health characteristics
Of 204 participants in the Phase IIa trial, the results of which have been published previously,7 119 received at least one dose of study medication and had DGSSD vomiting severity baseline scores >0 (“no vomiting”), and therefore, were included in the psychometric analysis population. Of these, 70% were female and the mean age was 54 years (Table 1). The majority of participants had type 2 diabetes (89%). For type 2 patients, the mean (SD) duration of diabetes was 10.7 (8.7) years and the median (min, max) was 9.0 (0, 46) years. For type 1 patients, the mean (SD) duration of diabetes was 20.6 (9.5) years and the median (min, max) was 18.0 (4, 44) years.
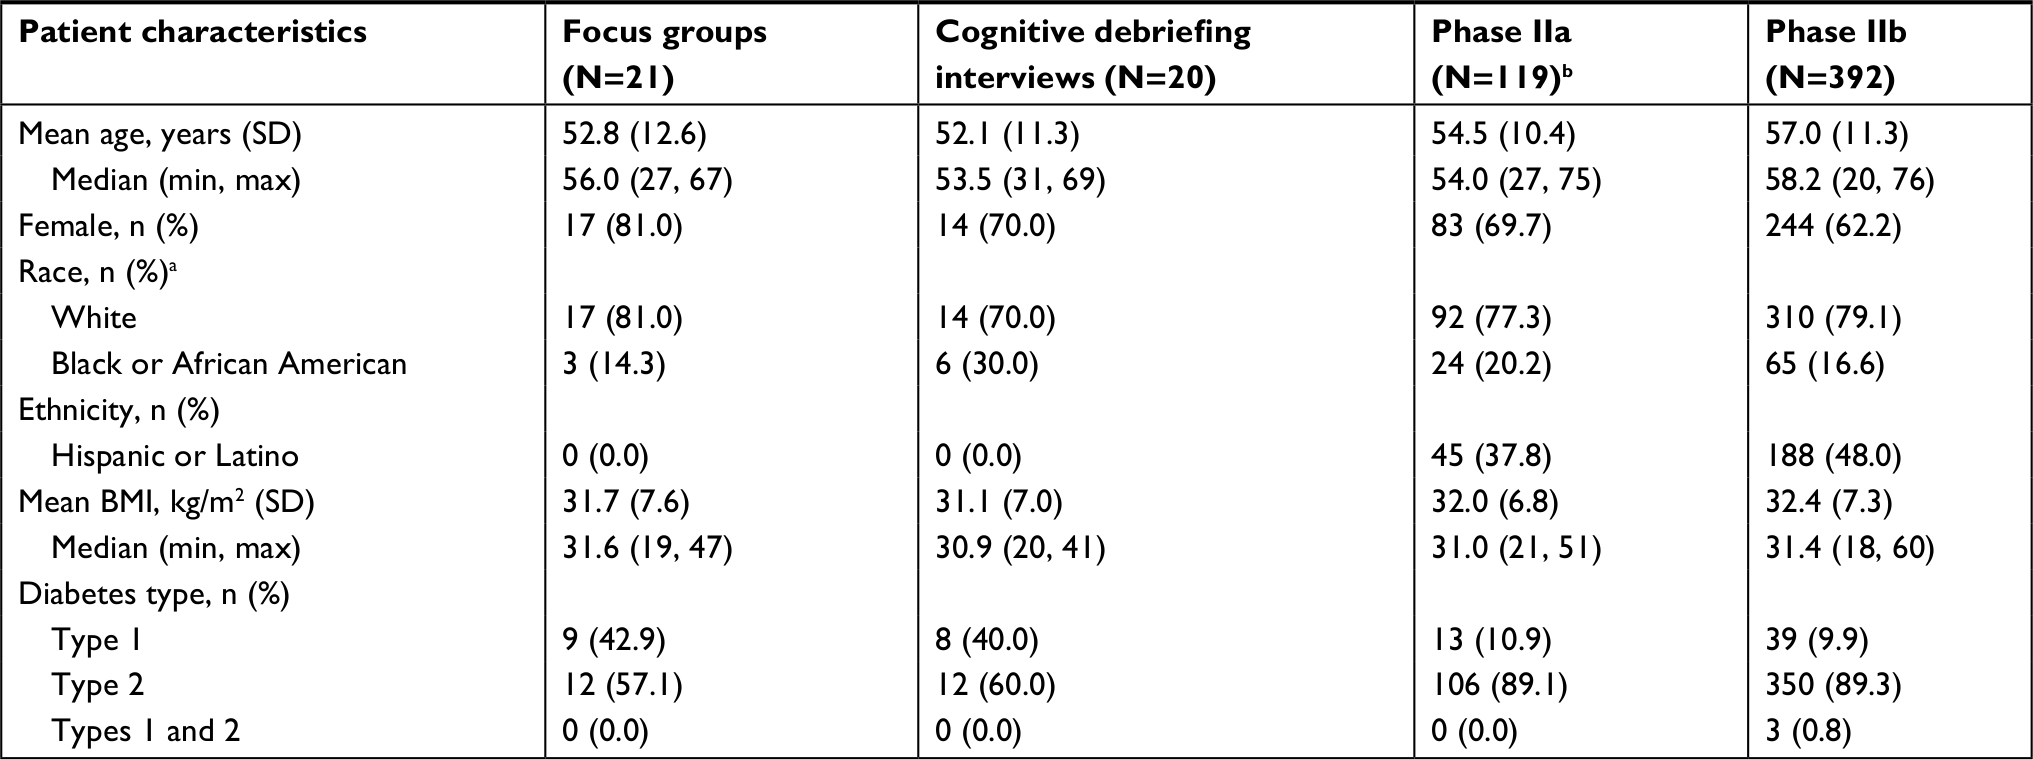 | Table 1 Patient demographics and baseline characteristics in the focus groups, cognitive debriefing interviews, and Phase IIa and IIb trials Notes: aOne focus group participant was mixed race; bthe Phase IIa psychometric analysis population comprised participants with vomiting severity score >0 at baseline. Abbreviations: BMI, body mass index. |
Of 393 participants in the Phase IIb trial, the results of which have been published previously,8 392 received at least one dose of study medication and provided at least one post-baseline DGSSD measurement, and therefore were included in the psychometric analyses. Of these, 62% were female and the mean age was 57 years (Table 1). The majority of participants had type 2 diabetes (89%) and the mean (SD) duration of diabetes was 13.6 (10.0) years. Participants had been diagnosed with DG for a mean (SD) duration of 4.2 (3.3) years.
Descriptive statistics
The mean symptom scores were lower (ie, improved) at Week 4 (Phase IIa) and Week 12 (Phase IIb) compared with baseline for all DGSSD items (Figure 1).
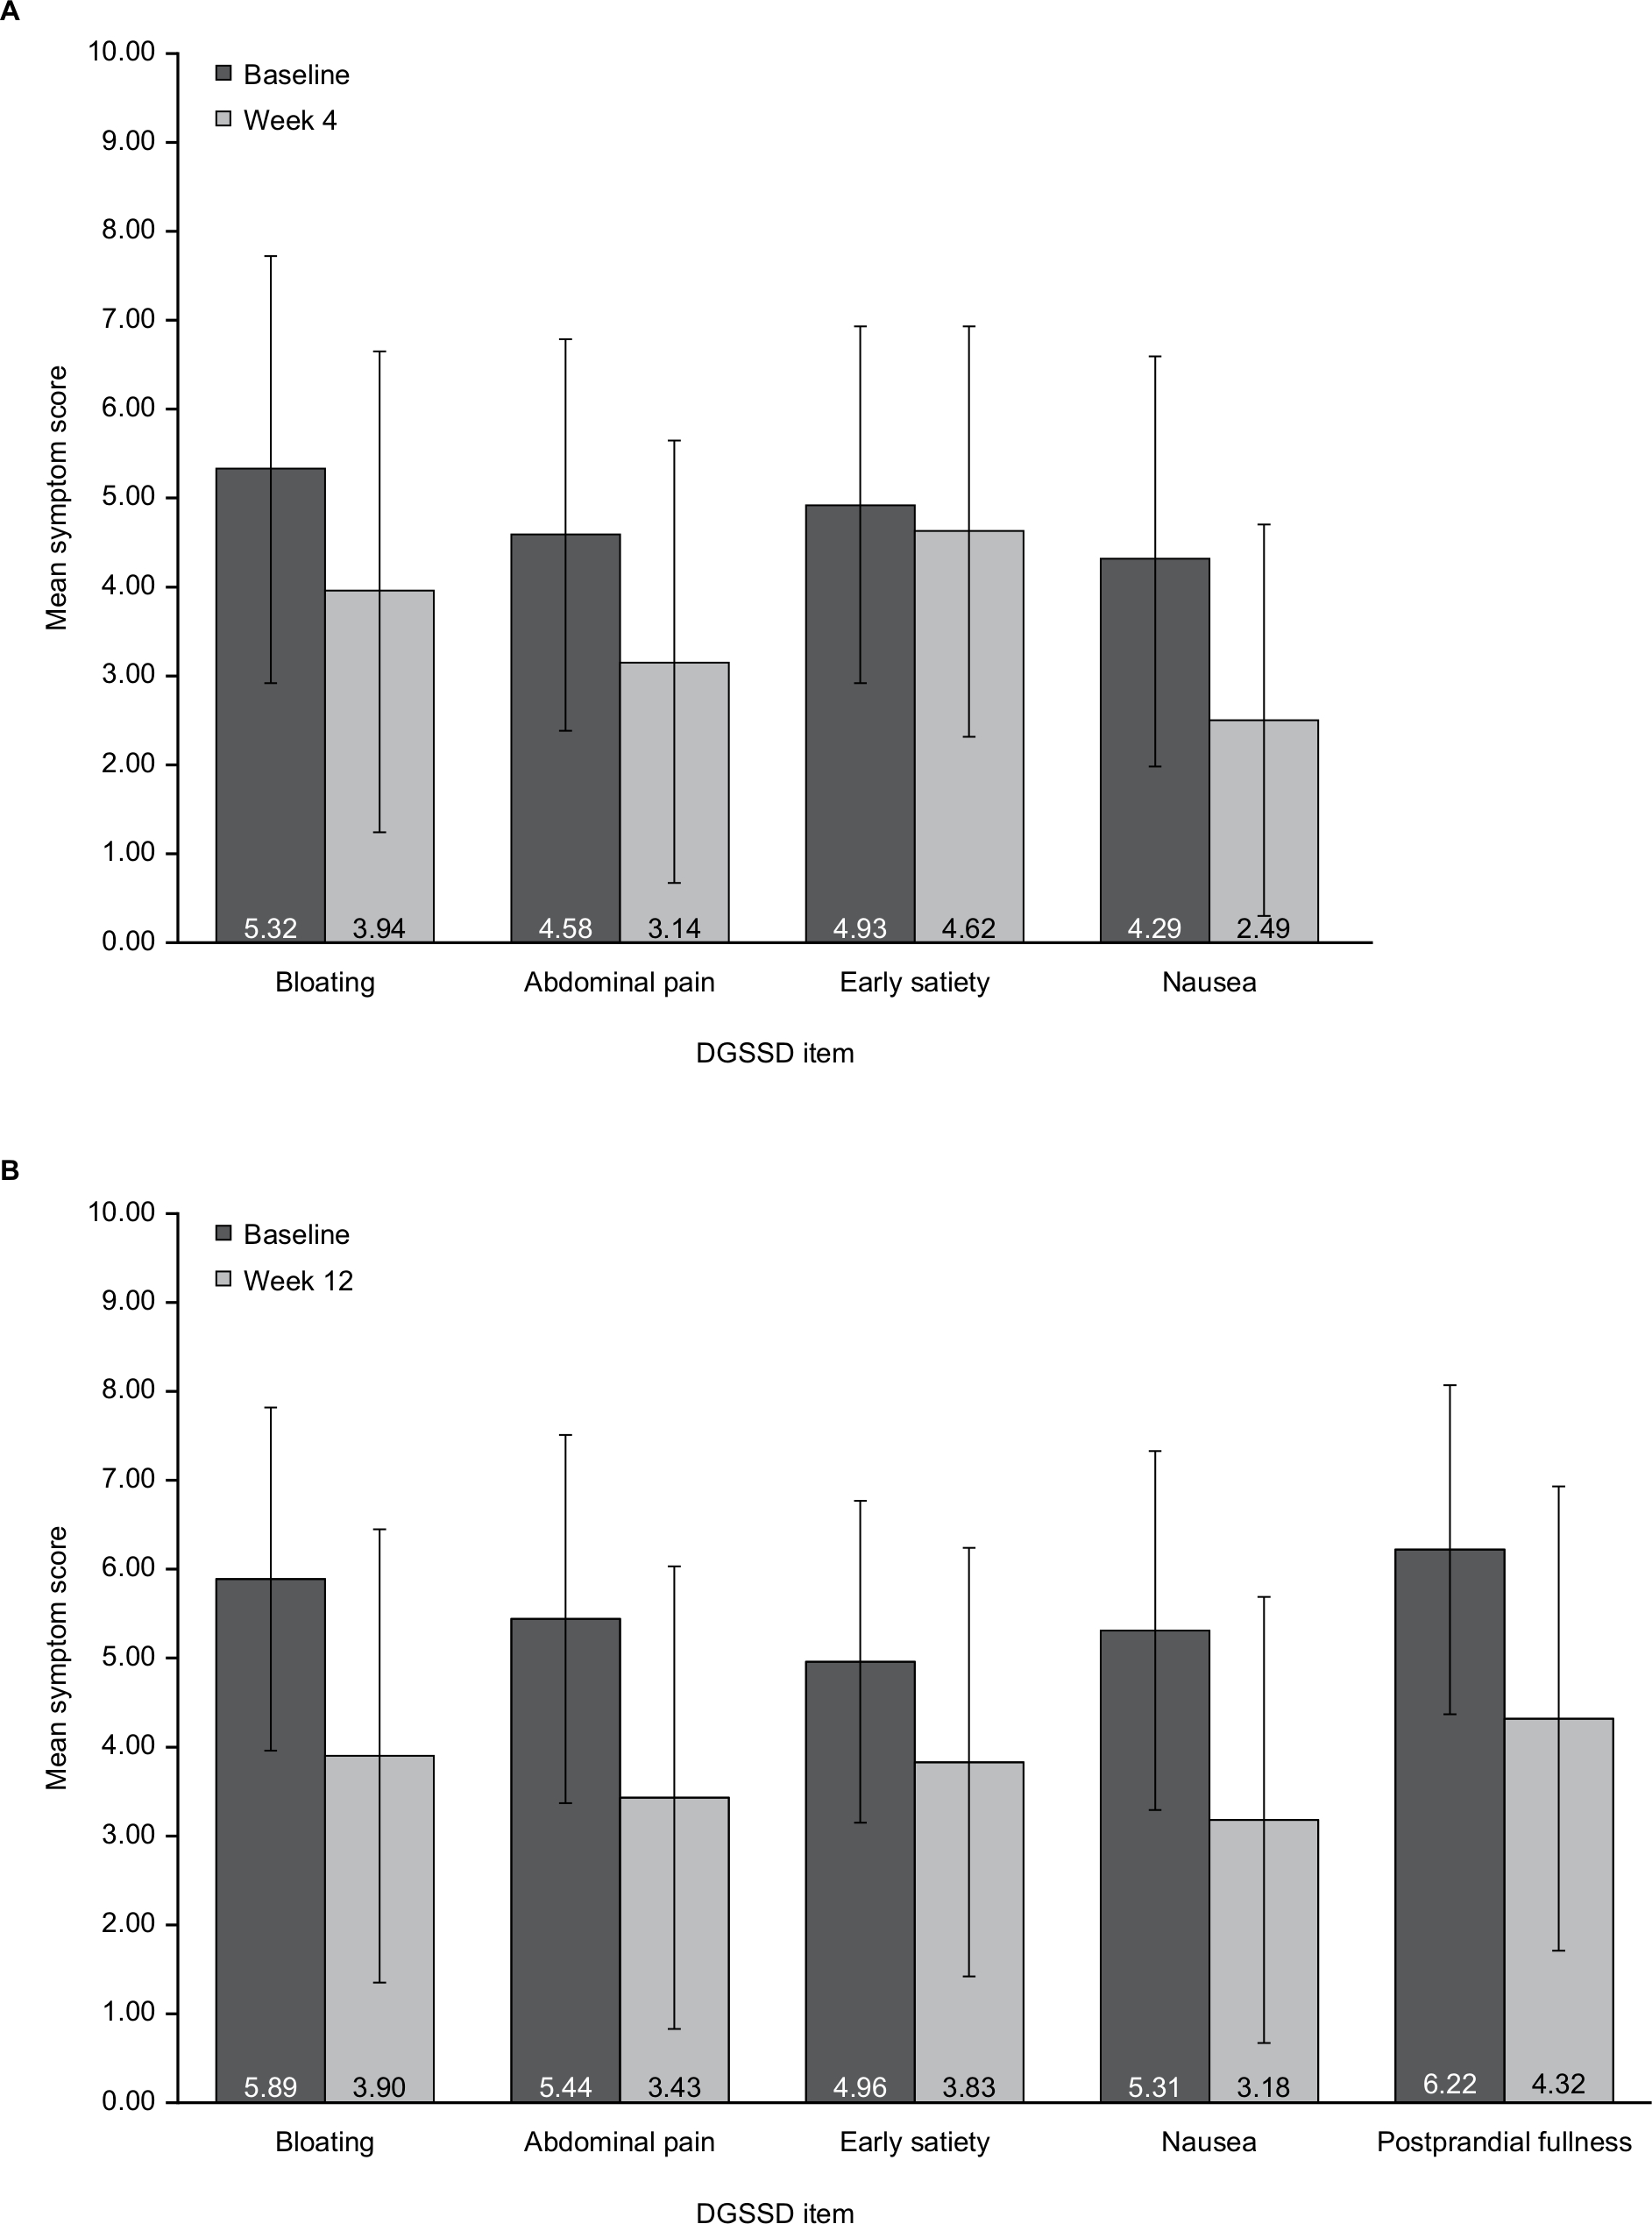 | Figure 1 Descriptive statistics (mean scores and SDs) for DGSSD items at baseline and Week 4 (Phase IIa) (A) and at baseline and Week 12 (Phase IIb) (B). Note: Data include all participants with baseline vomiting severity score >0 and who received at least one dose of study drug (combined relamorelin and placebo treatment groups). Abbreviations: DGSSD, Diabetic Gastroparesis Symptom Severity Diary. |
There was no evidence of floor or ceiling effects (defined as ≥50% of participants in the extreme response categories), although the distribution of vomiting frequency was non-normal at baseline in the psychometric analysis populations for both the Phase IIa (median: 3.0; mean: 8.57) and Phase IIb trials (median: 3.50; mean: 6.38), with a mean change from baseline of −4.82 episodes at the end of the Phase IIa trial (Week 4) and −3.05 episodes at the end of the Phase IIb trial (Week 12).
Structure
The exploratory factor analysis (384 participants; Phase IIb only) results showed a two-factor structure within the DGSSD items. Nausea, abdominal pain, PPF, and bloating were correlated (factor 1 loading ≥0.8), as were vomiting severity and vomiting frequency (factor 2 loading ≥0.8). Early satiety was not associated with either of these factors (factor loading <0.3 for both) (Table 2). The eigenvalues were 3.82 (78% variance) for factor 1 and 1.08 (22% variance) for factor 2. There was a weak correlation (r=0.34) between the two factors (Figure 2).
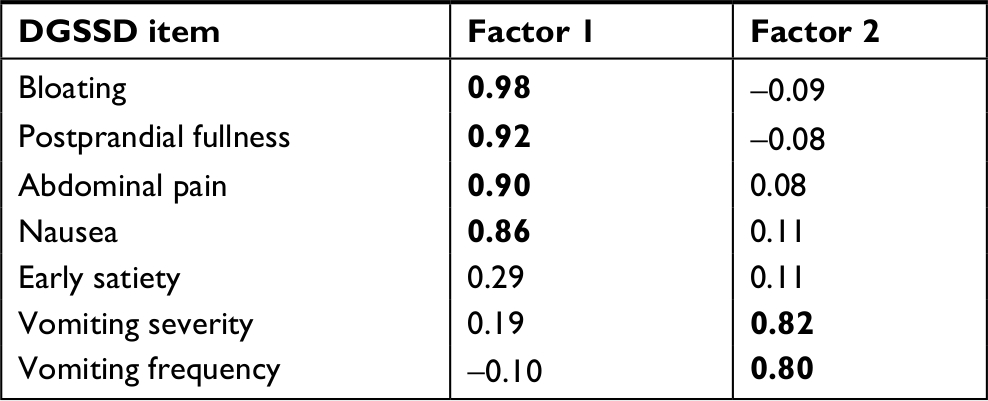 | Table 2 Factor loading values for the DGSSD items used in the Phase IIb trial Notes: Values in bold represent correlated items for each factor. Early satiety was associated with neither factor. Abbreviations: DGSSD, Diabetic Gastroparesis Symptom Severity Diary. |
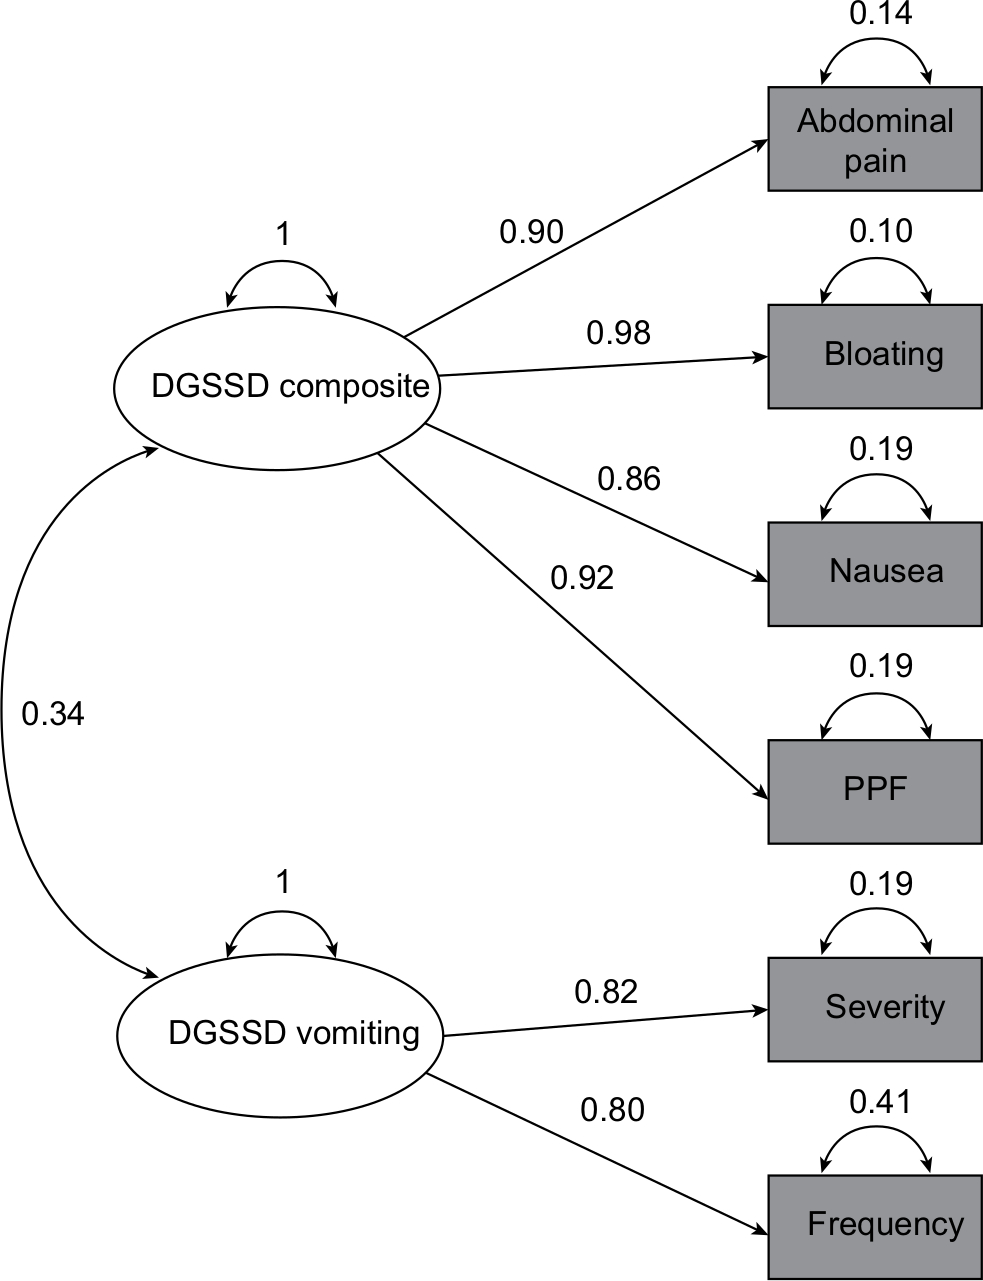 | Figure 2 Exploratory factor analysis path diagram. Note: Diagram shows items with factor loadings >0.3. Straight arrows indicate direct relationships. Curved double-headed arrows on the same item represent variance. Latent variables (factors) are shown in ovals; manifest variables are shown in rectangles. Abbreviations: DGSSD, Diabetic Gastroparesis Symptom Severity Diary; PPF, postprandial fullness. |
Test–retest reliability
In the Phase IIa trial, all test–retest ICCs for DGSSD symptom severity items and composite scores over the last 2 weeks of treatment were ≥0.84, with the exception of vomiting severity (0.73). The items addressing bloating and abdominal pain produced the highest ICCs among the individual items (both 0.91). The vomiting frequency ICC was much lower, at 0.46. While this lower value may be indicative of measurement error, it is also likely that the number of vomiting episodes varied from week to week for each patient, even without a change in the patients’ underlying condition.
For the Phase IIb trial, all test–retest ICCs for DGSSD symptom severity items and composites were ≥0.88; the highest ICC for an individual item was 0.97, for abdominal pain, PPF, and bloating. The vomiting frequency ICC was lower at 0.79, but this was still within the acceptable range typically applied to multi-item measures. The discrepancy in vomiting frequency ICC for the Phase IIa and IIb trials may be due to different baseline criteria between the two trials. In the Phase IIa trial, patients were required to have nausea and/or vomiting once per week in the 2 weeks prior to screening, and patients with persistent daily vomiting were excluded. In the Phase IIb trial, patients were required to have ≥2 vomiting episodes over the 2 weeks prior to screening, as well as at least one episode during the 2-week single-blind placebo run-in period.7,8
Construct and known-groups validity
As expected, in the Phase IIa trial, correlations between DGSSD and GCSI-DD items measuring similar concepts were stronger than correlations between items measuring different concepts (Table 3).
 | Table 3 Phase IIa trial: construct validity correlations of DGSSD items with GCSI-DD and PAGI-SYM Notes: Convergent validity (ie, construct validity between similar measures) identified by bolded correlations. Sample sizes for each correlation ranged from 104 to 105 based on the number of patients with complete data out of the 119 total patients. aEarly satiety was normalized and reverse coded as 0 = “all of a normal-sized meal” to 10 = “only 1 or 2 bites. Abbreviations: DGSSD, Diabetic Gastroparesis Symptom Severity Diary; GCSI-DD, Gastroparesis Cardinal Symptom Index-Daily Diary; PAGI-SYM, Patient Assessment of Upper Gastrointestinal-Symptom Severity Index; PRO, patient-reported outcome. |
For the Phase IIb trial, correlations were strong or moderate between DGSSD items addressing severity of nausea, abdominal pain, PPF, and bloating, and items from the other PRO measures assessing similar concepts (Table 4); however, correlations were smaller between early satiety in the DGSSD and similar measures of satiety in the other PRO instruments, perhaps reflecting the variation in response scales and item wording between assessment methods for this item.
 | Table 4 Phase IIb trial: construct validity correlations between DGSSD items and other PRO measures Notes: aConstruct validity correlation with the DGSSD PPF item was 0.30 at baseline and 0.37 at Week 12. Abbreviations: DG, diabetic gastroparesis; DGSSD, Diabetic Gastroparesis Symptom Severity Diary; GCSI-DD, Gastroparesis Cardinal Symptom Index-Daily Diary; N/V, nausea/vomiting; PAGI-SYM, Patient Assessment of Upper Gastrointestinal-Symptom Severity Index; PGIC, Patient Global Impression of Change; PGIS, Patient Global Impression of Status; PPF, postprandial fullness; PRO, patient-reported outcome. |
DGSSD item and composite scores were able to discriminate between a priori-defined subgroups of patients formed with the upper and lower quartiles of the global status item distribution at Week 4 (Phase IIa) and subgroups of patients who self-identified as none/mild or severe/very severe in terms of symptoms based on the PGIS at baseline and Week 12 (Phase IIb). All comparisons were significant at the P=0.05 level, except for Phase IIa early satiety (P=0.8).
Responsiveness
The responsiveness of the DGSSD in the Phase IIa trial was evaluated via an effect size estimate, with DGSSD changes for subgroups based on patients’ responses to the PGIC. The effect sizes were large (≥0.80) for bloating (−1.25) and abdominal pain (−1.68), medium for nausea (−0.64), and small for vomiting severity (−0.23), vomiting frequency (−0.11), and early satiety (0.09). The 4-symptom composite score, which comprised bloating, abdominal pain, nausea, and early satiety, produced a large effect size (−1.25).
The responsiveness of the DGSSD items and composite scores was evaluated based on three types of effect size estimation methods in the Phase IIb trial (Table 5). The standardized change in bloating was large (≥0.80) by all methods. The standardized changes in nausea, abdominal pain, and PPF were generally moderate (~0.50) for the “improve vs no change” and “worsen vs no change” method (based on the symptom-specific PGIC) and large when based on the SD of baseline measurement units or the standardized response mean. Consistent with the results of the Phase IIa evaluation, the early satiety item was not as responsive to change; effect sizes for this item were generally lower than for the other symptom severity items. The standardized change in vomiting frequency was also small (≤0.30). Interestingly, the four most responsive items were nausea, abdominal pain, PPF, and bloating, which formed one of the proposed 4-symptom composite scores.
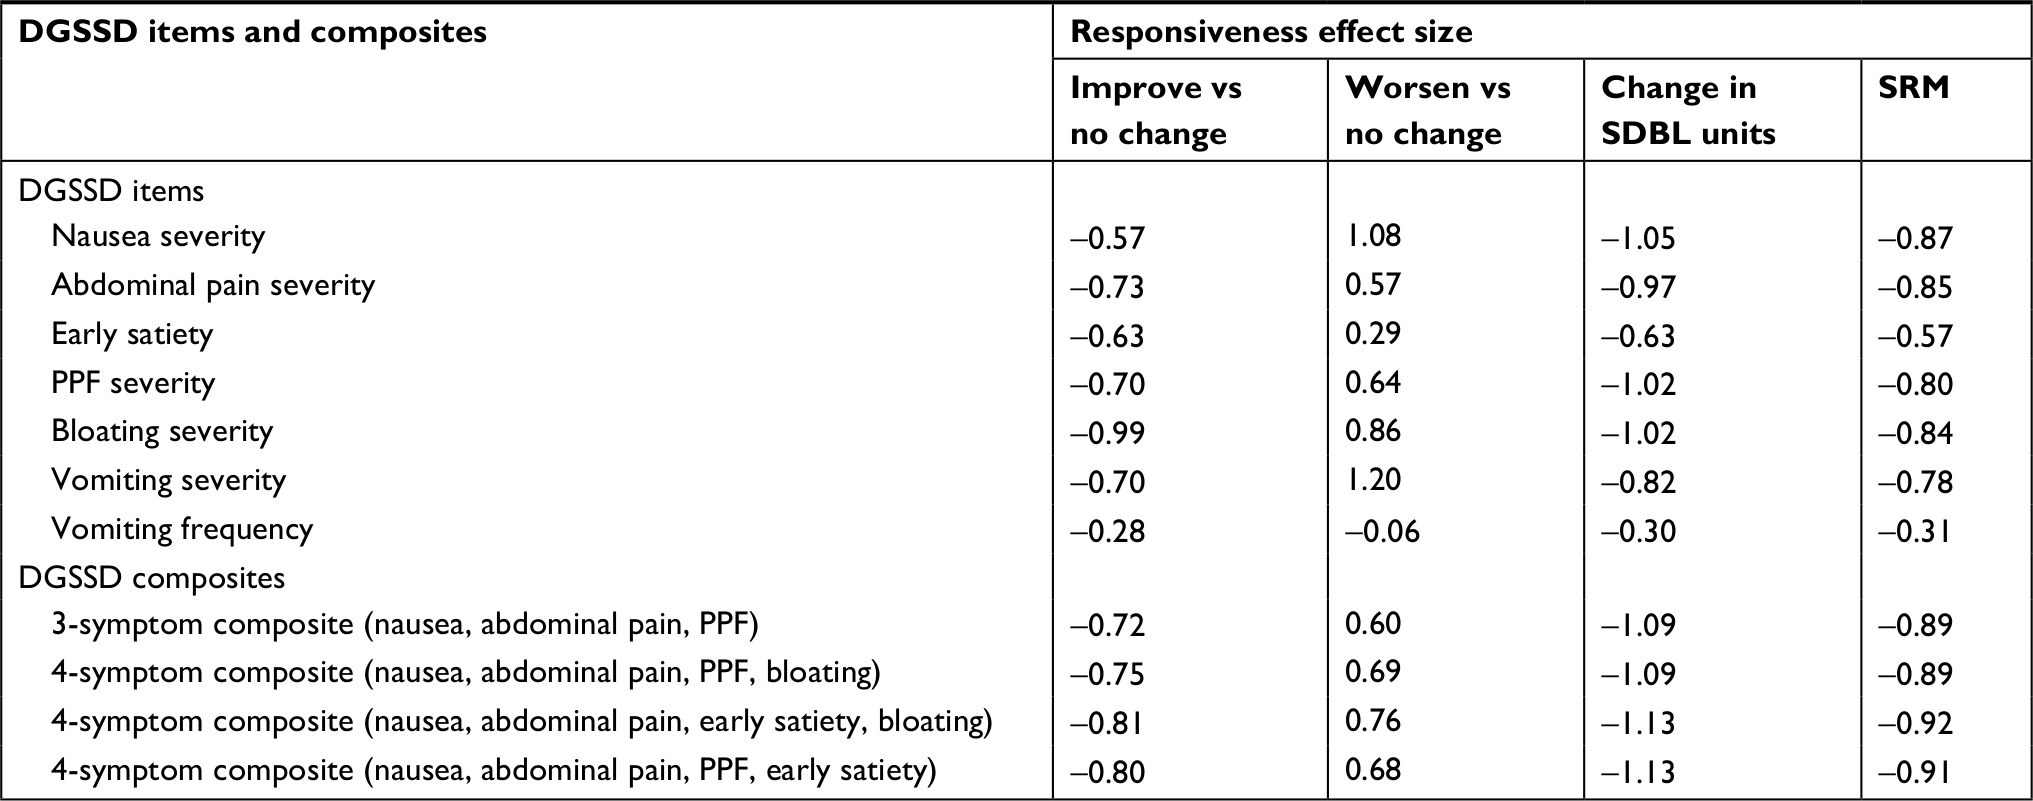 | Table 5 Phase IIb trial: DGSSD responsiveness effect sizes Notes: Responsiveness effect size shows the sensitivity of the DGSSD instrument to change. “Improve vs no change” and “worsen vs no change” effect size estimates were based on average DGSSD change from baseline to Week 12 among patients classified as “improved,” “no change,” and “worsened”, based on the symptom-specific PGIC. Abbreviations: DGSSD, Diabetic Gastroparesis Symptom Severity Diary; PGIC, Patient Global Impression of Change; PPF, postprandial fullness; SDBL, standard deviation of baseline measurement; SRM, standardized response mean. |
Discussion
The seven-item DGSSD used in the Phase IIb study resulted from a rigorous development process, which included a review of the literature and existing measures, qualitative research involving patients with DG, exploratory and confirmatory psychometric analysis, and the solicitation of input from clinical researchers and the FDA, to ensure that the final measure addressed the core signs and symptoms that are important to patients and clinically relevant for evaluation of treatment benefit.
Overall, the DGSSD performed well in Phase IIa and IIb trials in patients with DG. No floor or ceiling effects were observed, indicating that the entire response scales were used and that the DGSSD has the potential to detect both improvement and worsening of symptoms. For most items, the DGSSD showed good internal consistency and test–retest reliability, and the ability to discriminate between known groups. Exploratory factor analysis revealed a two-factor structure within the DGSSD and confirmed that the composite score comprising nausea, abdominal pain, PPF, and bloating was unidimensional.
The measurement properties for the early satiety item were not as strong as for the other items, especially with respect to inter-item correlations and responsiveness. Specifically, correlations between the DGSSD early satiety item and other PRO measures were weaker than anticipated. Furthermore, factor analyses illustrated that early satiety did not share a common factor with any other symptom, and the early satiety item was also the least responsive to change of any symptom severity measure (ie, not including vomiting frequency). This could partly be due to differences in response scale: the severity of all other symptoms was measured on a 0–10 NRS, while, based on patient interview results, the severity of early satiety was measured by asking how much participants could eat before feeling full, using a 5-point verbal response scale. These results, together with patients’ lack of distinction when describing the symptoms of early satiety and PPF, point toward the latter as more useful to include in a 4-symptom composite score. Given the poorer performance of the item addressing early satiety, the developers of the DGSSD modified this item and will evaluate its performance in future studies in order to provide a comprehensive assessment and communication of treatment benefit.
The responsiveness effect size for vomiting frequency was small for both the Phase IIa and IIb trials, especially when compared with the other symptom measures. It should be noted that the measurement of vomiting was based on frequency (count), whereas the other items measured severity and were scored (or transformed in the case of early satiety) using a 0–10 NRS. The distribution of responses for vomiting frequency was highly non-normal, causing difficulty in obtaining a meaningful evaluation using parametric methodology.
Among the several symptom severity items considered for inclusion in a suitable composite score, nausea and abdominal pain were described as the most independent symptoms by qualitative research participants. The qualitative and psychometric performance of the PPF item compared with the early satiety item supports the inclusion of the former (without early satiety) in a DGSSD composite score addressing symptom severity. Despite its absence from FDA guidance,11,12 the qualitative evidence suggests that bloating is an important symptom to patients, and this item performed well in the psychometric analyses. Therefore, a combination of the items addressing the severity of nausea, abdominal pain, PPF, and bloating may yield the most appropriate and informative 4-symptom DGSSD composite score. The use of this particular symptom combination is further supported by the factor and responsiveness analyses. Vomiting frequency is an important measure of DG treatment and will continue to be measured and evaluated independently in future studies. Including an analysis on the number of vomit-free days could be useful in assessing treatment benefit.
While the current evaluation of the DGSSD is specific to patients with DG, use of this measure in patients with other forms of gastroparesis may be proven valuable through future research.
Conclusion
The rigorous development process and good psychometric performance in Phase II trials support the DGSSD as a robust PRO measure for use in clinical trials of new treatments for DG, including the support of product approval and labeling claims for those treatments, which effectively improve the symptoms of this condition. The clinical meaningfulness of score changes and evaluation of endpoints derived from the DGSSD will be explored in future studies.
Acknowledgments
This study was sponsored by Allergan plc, Dublin, Ireland and Motus Therapeutics, Inc. These sponsors were involved in the study design, analysis, and interpretation of the data. None of the authors have any personal conflicts of interest related to the present report. An abstract relating to this paper was presented at the 2017 Digestive Disease Week congress as a poster presentation with interim findings. The poster’s abstract was published in “AGA abstracts” in Gastroenterology in April 2017. DOI: https://doi.org/10.1016/S0016-5085(17)31904-2. Writing and editorial assistance was provided to the authors by Helena Cant of Complete HealthVizion, Inc., Chicago, IL, USA, and funded by Allergan plc, Dublin, Ireland. Neither honoraria nor payments were made for authorship.
Author contributions
The authors meet criteria for authorship as recommended by the ICMJE. SF, LN, and DD were involved in the study design, acquisition, analysis, and interpretation of the data. RTC, FTF, and SS were involved in the study design, analysis, and interpretation of the data. All authors contributed to drafting and revising the article, gave final approval of the version to be published, and agree to be accountable for all aspects of the work.
Disclosure
Financial arrangements of the authors with companies whose products may be related to the present report are listed here, as declared by the authors. SF, LN, and DD are employees of RTI Health Solutions, a consulting firm that received funding for the research described in this paper. RTC is an employee of and owns stock/stock options in Allergan plc. SS is a consultant with Motus Therapeutics, Inc. FTF is a former employee of Motus Therapeutics, Inc., a prior subsidiary of Rhythm Pharmaceuticals. The authors report no other conflicts of interest in this work.
References
Camilleri M, Bharucha AE, Farrugia G. Epidemiology, mechanisms, and management of diabetic gastroparesis. Clin Gastroenterol Hepatol. 2011;9(1):5–12. | ||
Parkman HP, Hasler WL, Fisher RS, American Gastroenterological Association. American Gastroenterological Association medical position statement: diagnosis and treatment of gastroparesis. Gastroenterology. 2004;127(5):1589–1591. | ||
Lacy BE, Crowell MD, Mathis C, Bauer D, Heinberg LJ. Gastroparesis: quality of life and health care utilization. J Clin Gastroenterol. 2018;52(1):20–24. | ||
DiBaise JK, Patel N, Noelting J, Dueck AC, Roarke M, Crowell MD. The relationship among gastroparetic symptoms, quality of life, and gastric emptying in patients referred for gastric emptying testing. Neurogastroenterol Motil. 2016;28(2):234–242. | ||
Pasricha PJ, Pehlivanov N, Sugumar A, Jankovic J. Drug insight: from disturbed motility to disordered movement–a review of the clinical benefits and medicolegal risks of metoclopramide. Nat Clin Pract Gastroenterol Hepatol. 2006;3(3):138–148. | ||
Camilleri M, Parkman HP, Shafi MA, Abell TL, Gerson L, American College of Gastroenterology. Clinical guideline: management of gastroparesis. Am J Gastroenterol. 2013;108(1):18–37. | ||
Lembo A, Camilleri M, McCallum R, et al. Relamorelin reduces vomiting frequency and severity and accelerates gastric emptying in adults with diabetic gastroparesis. Gastroenterology. 2016;151(1):87–96. | ||
Camilleri M, McCallum RW, Tack J, Spence SC, Gottesdiener K, Fiedorek FT. Efficacy and safety of relamorelin in diabetics with symptoms of gastroparesis: a randomized, placebo-controlled study. Gastroenterology. 2017;153(5):1240–1250. | ||
Revicki DA, Camilleri M, Kuo B, et al. Development and content validity of a gastroparesis cardinal symptom index daily diary. Aliment Pharmacol Ther. 2009;30(6):670–680. | ||
Rentz AM, Kahrilas P, Stanghellini V, et al. Development and psychometric evaluation of the patient assessment of upper gastrointestinal symptom severity index (PAGI-SYM) in patients with upper gastrointestinal disorders. Qual Life Res. 2004;13(10):1737–1749. | ||
U.S. Food and Drug Administration. Guidance for industry. Patient-reported outcome measures: use in medical product development to support labeling claims; 2009. Available from: https://www.fda.gov/downloads/Drugs/GuidanceComplianceRegulatoryInformation/Guidances/UCM193282.pdf. Accessed July 25, 2017. | ||
U.S. Food and Drug Administration. Gastroparesis: clinical evaluation of drugs for treatment. Guidance for industry; 2015. Available from: https://www.fda.gov/downloads/drugs/guidancecomplianceregulatoryinformation/guidances/ucm455645.pdf. Accessed July 25, 2017. | ||
Nunnally JC, Bernstein IH. Psychometric Theory. 3rd ed. New York: McGraw-Hill; 1994. | ||
Cohen J. A power primer. Psychol Bull. 1992;112(1):155–159. | ||
Guyatt G, Walter S, Norman G. Measuring change over time: assessing the usefulness of evaluative instruments. J Chronic Dis. 1987;40(2):171–178. |
 © 2019 The Author(s). This work is published and licensed by Dove Medical Press Limited. The
full terms of this license are available at https://www.dovepress.com/terms
and incorporate the Creative Commons Attribution
- Non Commercial (unported, 3.0) License.
By accessing the work you hereby accept the Terms. Non-commercial uses of the work are permitted
without any further permission from Dove Medical Press Limited, provided the work is properly
attributed. For permission for commercial use of this work, please see paragraphs 4.2 and 5 of our Terms.
© 2019 The Author(s). This work is published and licensed by Dove Medical Press Limited. The
full terms of this license are available at https://www.dovepress.com/terms
and incorporate the Creative Commons Attribution
- Non Commercial (unported, 3.0) License.
By accessing the work you hereby accept the Terms. Non-commercial uses of the work are permitted
without any further permission from Dove Medical Press Limited, provided the work is properly
attributed. For permission for commercial use of this work, please see paragraphs 4.2 and 5 of our Terms.