Back to Journals » Drug Design, Development and Therapy » Volume 9
Development and optimization of carvedilol orodispersible tablets: enhancement of pharmacokinetic parameters in rabbits
Authors Aljimaee Y, El-Helw A, Ahmed OAA ![]() , El-Say KM
, El-Say KM ![]()
Received 4 January 2015
Accepted for publication 23 January 2015
Published 5 March 2015 Volume 2015:9 Pages 1379—1392
DOI https://doi.org/10.2147/DDDT.S80294
Checked for plagiarism Yes
Review by Single anonymous peer review
Peer reviewer comments 3
Editor who approved publication: Prof. Dr. Wei Duan
Yazeed HM Aljimaee,1 Abdel-Rahim M El-Helw,1 Osama AA Ahmed,1,2 Khalid M El-Say1,3
1Department of Pharmaceutics and Industrial Pharmacy, Faculty of Pharmacy, King Abdulaziz University, Jeddah, Saudi Arabia; 2Department of Pharmaceutics and Industrial Pharmacy, Faculty of Pharmacy, Minia University, Minia, 3Department of Pharmaceutics and Pharmaceutical Technology, Faculty of Pharmacy, Al-Azhar University, Cairo, Egypt
Background: Carvedilol (CVD) is used for the treatment of essential hypertension, heart failure, and systolic dysfunction after myocardial infarction. Due to its lower aqueous solubility and extensive first-pass metabolism, the absolute bioavailability of CVD does not exceed 30%. To overcome these drawbacks, the objective of this work was to improve the solubility and onset of action of CVD through complexation with hydroxypropyl-β-cyclodextrin and formulation of the prepared complex as orodispersible tablets (ODTs).
Methods: Compatibility among CVD and all tablet excipients using differential scanning calorimetry and Fourier transform infrared spectroscopy, complexation of CVD with different polymers, and determination of the solubility of CVD in the prepared complexes were first determined. A Box-Behnken design (BBD) was used to study the effect of tablet formulation variables on the characteristics of the prepared tablets and to optimize preparation conditions. According to BBD design, 15 formulations of CVD-ODTs were prepared by direct compression and then evaluated for their quality attributes. The relative pharmacokinetic parameters of the optimized CVD-ODTs were compared with those of the marketed CVD tablet. A single dose, equivalent to 2.5 mg/kg CVD, was administered orally to New Zealand white rabbits using a double-blind, randomized, crossover design.
Results: The solubility of CVD was improved from 7.32 to 22.92 mg/mL after complexation with hydroxypropyl-β-cyclodextrin at a molar ratio of 1:2 (CVD to cyclodextrin). The formulated CVD-ODTs showed satisfactory results concerning tablet hardness (5.35 kg/cm2), disintegration time (18 seconds), and maximum amount of CVD released (99.72%). The pharmacokinetic data for the optimized CVD-ODT showed a significant (P<0.05) increase in maximum plasma concentration from 363.667 to 496.4 ng/mL, and a shortening of the time taken to reach maximum plasma concentration to 2 hours in comparison with the marketed tablet.
Conclusion: The optimized CVD-ODTs showed improved oral absorption of CVD and a subsequent acceleration of clinical effect, which is favored for hypertensive and cardiac patients.
Keywords: bioavailability, Box-Behnken design, hydroxypropyl-β-cyclodextrin, oral absorption
Introduction
Carvedilol (CVD) (±)-[3-(9H-carbazol-4-yloxy)-2-hydroxypropyl][2-(2-ethoxyphenoxy)ethyl] amine is an α1, β1, and β2-adrenergic receptor blocker. CVD is used for the treatment of essential hypertension and other cardiovascular disorders such as heart failure and myocardial infarction.1,2 CVD is a basic drug that exhibits pH-dependent solubility with a pKa value of 7.8. At acidic pH, CVD shows slight improvement of aqueous solubility as a result of drug ionization, but shows extremely low solubility at alkaline pH levels, which may hinder drug absorption in the small intestine and colon.3 CVD undergoes significant first-pass metabolism and also has poor aqueous solubility, resulting in low (about 30%) bioavailability.4,5
Solubility problems are a major barrier for drug formulators, since about 40% of the marketed drugs are classified as practically insoluble.6 Several attempts have been made to improve the dissolution rate of CVD utilizing self-emulsifying and nanoemulsifying delivery systems, formation of inclusion complexes with cyclodextrins (CDs), and formulation as buccal sprays that have successfully improved the bioavailability of CVD.7–10 In addition, improved CVD bioavailability has been observed following absorption from the buccal mucosa and the lower portions of the gastrointestinal tract.11,12
The oral route is the most preferred route for drug administration.13 To avoid swallowing problems, orodispersible tablets (ODTs) were designed to disintegrate rapidly in saliva. This improves drug dissolution as well as the onset of clinical effect and pregastric absorption of drugs. Molecular dispersions, as solid dispersions, improve drug solubility through molecular dispersions of drug particles after carrier dissolution and improved drug wettability.14 This technique enhances the solubility of poorly soluble drugs, such as CVD, to meet the compendial requirements of ODTs.
Accordingly, the aim of this work focuses on improvement of the solubility of CVD and enhancement of its onset of effect through formulation of CVD as ODTs that disintegrate rapidly on contact with saliva. Response surface methodology was utilized to help in production of an optimized formulation of ODTs that have acceptable hardness, a shorter disintegration time, and maximum amount of CVD release. Box-Behnken design (BBD) was implemented to understand the formulation parameters that affect the preparation and characteristics of ODTs. Pharmacokinetic parameters of the optimized CVD-ODTs were compared with those of the presently marketed CVD tablets in rabbits. Successful achievement of this formulation could improve patient convenience and compliance because of its ease of administration, particularly for patients for whom swallowing of a conventional solid oral dosage form is a challenge.
Materials and methods
Materials
CVD was supplied by Riyadh Pharma, Riyadh (Saudi Arabia) and α, β, γ, and hydroxylpropyl-β (HP-β) CDs were provided by Nihon Shokuhin Kako Co Ltd (Tokyo, Japan). Polyvinyl pyrrolidone (PVP) with average molecular weights of 44,000 (PVP K30), and 360,000 (PVP K90) were purchased from Fluka AG, Buchs SG, (Switzerland). Camphor was sourced from Koch-Light Laboratories Ltd (Coinbrook, England), microcrystalline cellulose (Avicel PH 101) from Fluka (Hach Lange, Ireland), sodium starch glycolate (Explotab) from JRS Pharma (Patterson, NY, USA), mannitol and magnesium stearate from Winlab (Market Harborough, UK), talc from Holyland (Saudi Arabia), and methanol from Sigma-Aldrich (Seelze, Germany). All other chemicals and solvents were of analytical grade.
Preparation of CVD binary systems
Solid binary systems of CVD with different polymers, ie, PVP K30, PVP K90, and α, β, γ and HP-β-CD in different ratios were prepared by the kneading method.15,16 The calculated amounts of CVD and the hydrophilic polymers used were triturated in a mortar with a small volume of a solvent blend of water:methanol (1:1 v/v) to form a homogeneous slurry. The thick slurry formed was kneaded for 45 minutes then dried at 55°C in a hot air oven. The dried powder was then passed through mesh No 200.
Saturation solubility studies
The effects of the solid dispersion and inclusion complex on the solubility of CVD were evaluated according to the Higuchi and Connors method.17 Briefly, excess amounts of pure CVD and CVD complexes were mixed with 10 mL of distilled water in screw-capped vials kept in a thermostatically controlled shaking water bath at 25°C±0.5°C for 48 hours. Samples were analyzed every day until equilibrium was reached. Thereafter, aliquots were withdrawn, filtered through a 0.22 μm filter, and assayed spectrophotometrically for drug content at 242.5 nm.
Differential scanning calorimetry
Differential scanning calorimetry was used for thermal analysis of CVD alone and CVD mixed with ODTs excipients (2 mg samples) using aluminum crucibles in a dynamic nitrogen atmosphere (flow rate 50 mL per minute) and at a heating rate of 10°C per minute in the temperature range of 25°C–400°C.
Fourier transform infrared spectroscopy
Fourier transform infrared spectra were recorded on a Jasco FT IR-6100 spectrometer using KBr discs with a 2 cm−1 resolution in the range of 4,000–400 cm−1.
Application of BBD experimental design
To study the effects of different variables on the characteristics of the produced ODTs and optimize the process to obtain them with a minimum disintegration time, acceptable strength, and rapid release pattern, a three-level, three-factor BBD was used. These variables are the percentage of superdisintegrant, sodium starch glycolate (Explotab) X1, subliming agent (camphor) X2, and the used binder (Avicel) X3. The responses selected for evaluation and optimization were hardness of the prepared tablets (Y1), disintegration time (Y2), and cumulative amount of drug released after one hour (Y3). The design was performed with Statgraphics Plus® For Windows (Manugistics Inc, Rockville, MD, USA). The design suggests 15 experimental runs. Table 1 summarizes the independent variables with their intervals and the dependent variables selected to perform the BBD.
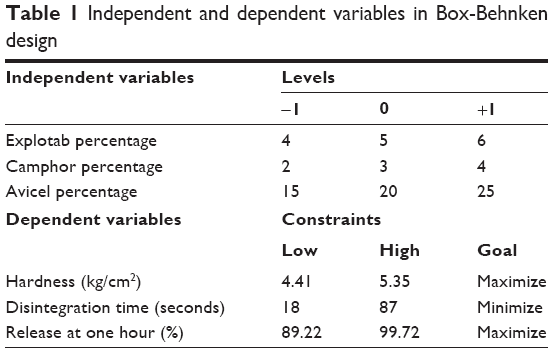 | Table 1 Independent and dependent variables in Box-Behnken design |
Preparation of CVD-ODTs
Formulations of CVD-ODTs were prepared by the direct compression method. Fifteen tablet formulations of 250 mg total weight and containing drug complex equivalent to 12.5 mg CVD with different ratios of tablet excipients were prepared according to the formulations given in Table 2. The obtained blend was directly compressed by7 mm flat round punches using a tablet machine (Erweka, GmbH, Heusenstamm, Germany).
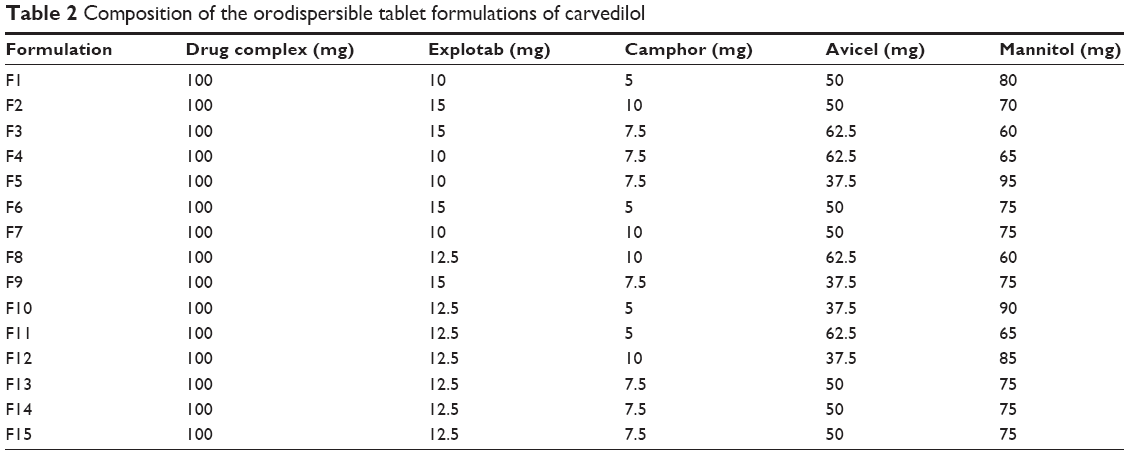 | Table 2 Composition of the orodispersible tablet formulations of carvedilol |
Evaluation of the prepared ODTs
The prepared CVD-ODTs were evaluated for visual appearance, uniformity of content and weight, thickness, hardness, friability, and in vitro disintegration according to US Pharmacopeia tests for tablets.18
In vitro dissolution test
Drug release from the CVD-ODTs was determined by USP dissolution apparatus II (paddle) using a DT 700 LH device (Erweka). The dissolution medium was 900 mL of distilled water at 37°C±0.5°C containing 0.05% w/v sodium lauryl sulfate with stirring at 50 rpm. Samples of 5 mL were withdrawn at 5, 10, 15, 20, 30, 45, and 60 minutes and replaced with fresh dissolution medium at 37°C±0.5°C. The withdrawn samples were filtered and analyzed after appropriate dilution using an ultraviolet spectrophotometer at 242.5 nm.
Kinetic treatment of release data
The release data for CVD were fitted to zero-order, first-order, Higuchi, and Korsmeyer–Peppas kinetic models.19–23 The best fitted model was selected to describe the mechanism of drug release from the prepared ODTs.
In vivo and pharmacokinetic parameters
Subject population
Male New Zealand white rabbits (2–2.5 kg) were administered a single oral dose of CVD (2.5 mg/kg). Animal use was approved by the unit of biomedical ethics, KAU which ensures that the care and use of animals conforms to the European Union Directive 2010/63/EU concerning the protection of animals used for scientific purposes.24 The rabbits were fasted for at least 24 hours prior to the experiment and were allowed free access to water. Animals were divided into three groups (6 animals/group). The first two groups received the optimized CVD-ODTs and the commercial tablets. The study was carried out using a crossover design with a washout period of 7 days between the two doses. During the first phase, rabbits received crushed tablets containing either the reference product (commercial tablet) or the test product (optimized formula of CVD-ODTs) suspended in water. In the second phase, rabbits that received the test product first were administered the reference product or vice versa. The reference product was administered orally in distilled water via a catheter. A third group was administered plain crushed tablets orally as a negative control.
Sample collection
Blood samples (0.5 mL) were withdrawn from the marginal ear vein of each rabbit at 0, 0.5, 1, 1.5, 2, 4, 6, 8, 10, 12, 18, and 24 hours after oral administration of the test/reference product. Next, the blood samples were centrifuged at 3,500 rpm for 5 minutes and then analyzed by high-performance liquid chromatography (HPLC).
Chromatographic conditions
Determination of CVD in plasma was done using a modified HPLC method.25 An Agilent 1200 series HPLC apparatus (Agilent, Waldbronn, Germany) was used with a tandem mass spectrometry detector system. The mobile phase was a mixture of acetonitrile and 0.1% formic acid (70:30, v/v) at a flow rate of 0.25 mL per minute.
Pharmacokinetic analysis
Pharmacokinetic parameters were estimated from the plasma data following oral administration of each of the two formulations. The maximum plasma concentration (Cmax) and time taken to reach maximum plasma concentration (tmax), elimination rate constant (Ke), half-life, mean residence time, and area under the plasma concentration-time curve (AUC0–∞) after oral administration were determined. The data are expressed as the mean ± standard deviation and were analyzed using GraphPad Prism 6 (GraphPad Software, San Diego, CA, USA). Two-way analysis of variance followed by Sidak’s multi-comparison were used to assess the difference and a P-value <0.05 was considered to be statistically significant.
Results and discussion
Solubility of CVD binary system
The results of the saturation solubility studies are presented in Figure 1. The solubility of the pure drug in distilled water was found to be 7.323 mg/mL. The solubility of CVD was improved after preparation of a solid dispersion using PVP (K30 and K90) in different ratios to reach 22.667 mg/mL for a PVP K90 1:3 (w/w) ratio. On the other hand, inclusion complexes of CVD with α-CD in 1:2 and β-CD in 1:1 and 1:2 molar ratios decreased the solubility of the drug to 3.584, 5.255, and 5.213 mg/mL, respectively. The CVD solubility improved more than three-fold after complexation with HP-β-CD in a 1:2 molar ratio (Figure 1). These results indicate more improvement in CVD solubility when it was complexed with HP-β-CD as compared with the other CD derivatives studied. This finding is attributed to the fact that the CVD molecule contains two well separated benzene groups which may individually complex with HP-β-CD. The availability of this appropriate geometry of CVD with HP-β-CD in water causes the nonpolar aromatic portions of CVD to be more likely to enter the nonpolar cavity of the HP-β-CD molecule, thereby improving CVD aqueous solubility.26,27
 | Figure 1 Solubility of CVD in solid dispersion and complexes with different polymers in different ratios. Values in the figure indicate highest and lowest solubility of binary complex compared with the raw CVD value. |
Differential scanning calorimetry
The thermal behavior of pure CVD and the binary mixtures are shown in Figure 2. The differential scanning calorimetry thermogram of CVD indicates a sharp endothermic peak (Tpeak 113.82°C) corresponding to its melting point, which is in agreement with values reported in the literature.28 However, this characteristic peak was retained in all the binary mixtures, but nearly disappeared in the thermogram for the HP-β-CD complex, indicating that CVD forms an inclusion complex with HP-β-CD. These observations are again in agreement to those reported in the literature.29
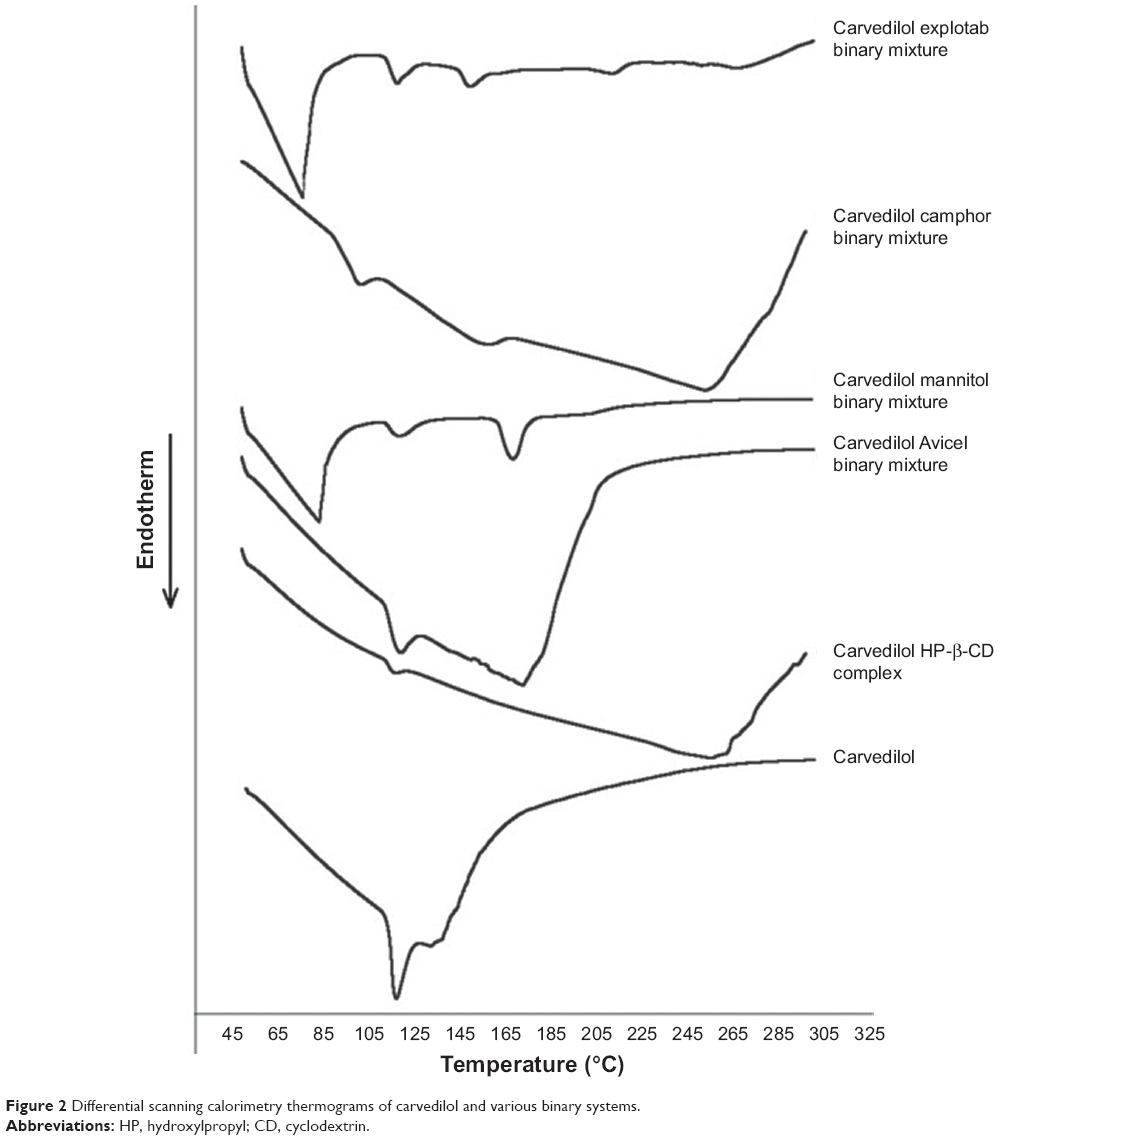 | Figure 2 Differential scanning calorimetry thermograms of carvedilol and various binary systems. |
Fourier transform infrared spectroscopy
The Fourier transform infrared spectra for CVD and the binary mixtures of CVD with Avicel, mannitol, camphor, and Explotab, as well as for the inclusion complex of CVD with HP-β-CD in a 1:2 molar ratio are presented in Figure 3. Characterization of the inclusion complex by the infrared spectroscopy method showed that there was a difference in the spectrum for CVD and that for its inclusion complex with HP-β-CD. Specific absorbance of CVD is in the range of 3,500-3,000 cm−1 for vibration of N-H; 3,050-2,950 cm−1 for vibration of C-H; 1,600-1,480 cm−1 for vibration of aromatic C=C; 1,454-1,444 cm−1 for vibration of C-N; 1,403-1,256 cm−1 for vibration of the phenyl ring of C-C; and 1,040-800 cm−1 for vibration of substituted benzene rings for CVD.30 Significant differences were observed in the inclusion complex spectrum, for instance: aromatic C=C vibration at 1,589.74 cm−1 and 1,502.21 cm−1 as well as the vibration of C-N at 1,447.49 cm−1 were disappeared from the spectrum of the inclusion complex of CVD with HP-β-CD. In addition, the N-H vibration of the CVD HP-β-CD complex at 3,340.79 cm−1 was slightly broadened and the band of the CH stretching region at 2,923.21 cm−1 was merged and broadened. The disappearance of vibration intensity in the CVD spectrum could have occurred as a result of the interaction between CVD with HP-β-CD and formation of an inclusion complex that would disturb vibration. Generally, band broadening and merging can be explained by the possibility of intermolecular arrangements due to conversion of the sample from a crystalline state to an amorphous state. Moreover, it was found that there was no change in CVD diagnostic bands when mixed with ODTs excipients as binary mixtures (Figure 3). Accordingly, it can be postulated that only weak van der Waals or hydrogen forces are involved in binding of CVD to the excipients used in the preparation of ODTs.
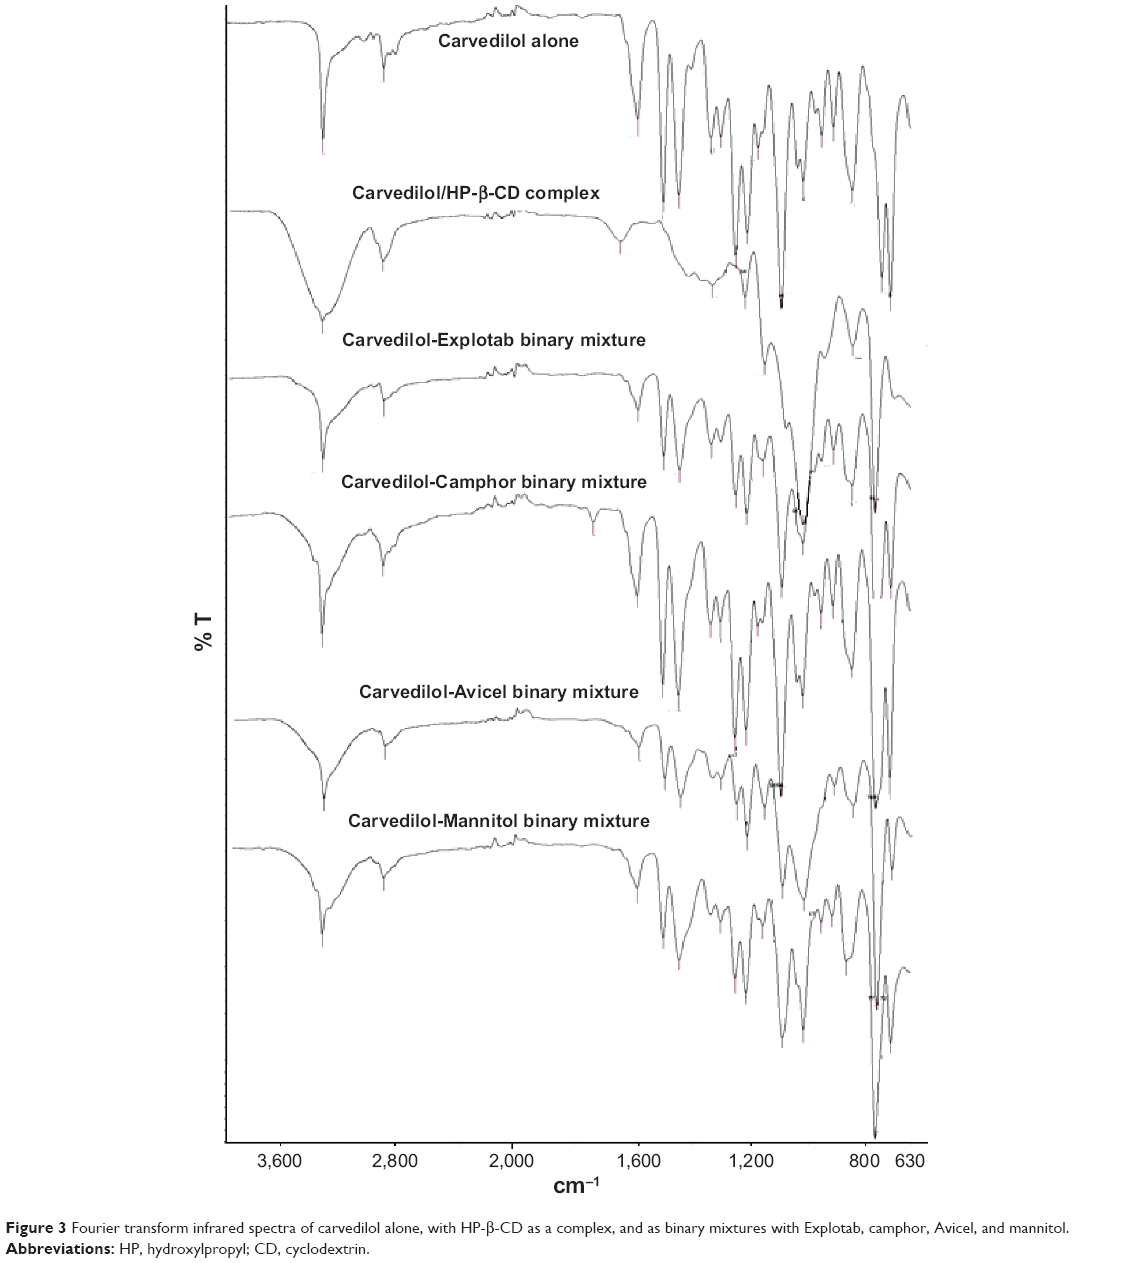 | Figure 3 Fourier transform infrared spectra of carvedilol alone, with HP-β-CD as a complex, and as binary mixtures with Explotab, camphor, Avicel, and mannitol. |
Evaluation of the prepared ODTs
The prepared tablet formulations were evaluated for the different parameters to ensure uniformity and compatibility of the prepared tablets with compendial requirements (see Table 3). The weight of each tablet showed variability of no more than 1%, which met the specification of the USP limits. The average weight of the 15 formulations was found to be in the range of 240.3–243.5 mg. Thickness, hardness, friability, and in vitro disintegration time of all the tablet formulations ranged from 3.178 to 3.290 mm, 4.412 to 5.35 kg/cm2, 0.129% to 0.984%, and 18 to 87 seconds, respectively. According to the European Pharmacopoeia, ODTs should disintegrate within 3 minutes, so all the prepared tablets met the pharmacopeial requirement. Friability for the CVD tablet formulations was less than 1.0%. Drug content of all the formulations was in the range of 95.79%–104.40%. These results support the reproducibility of the CVD formulation and tableting process used in this study.
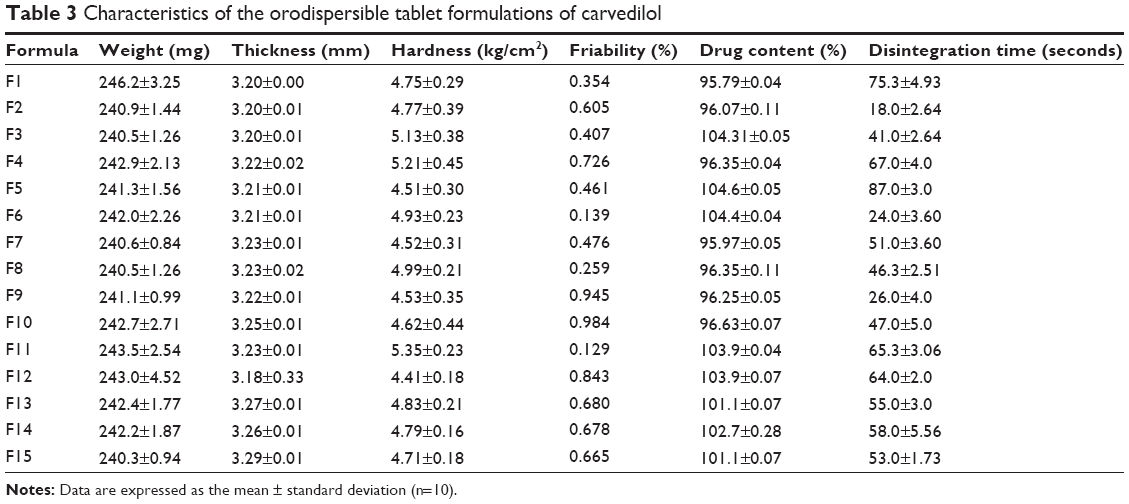 | Table 3 Characteristics of the orodispersible tablet formulations of carvedilol |
In vitro dissolution studies
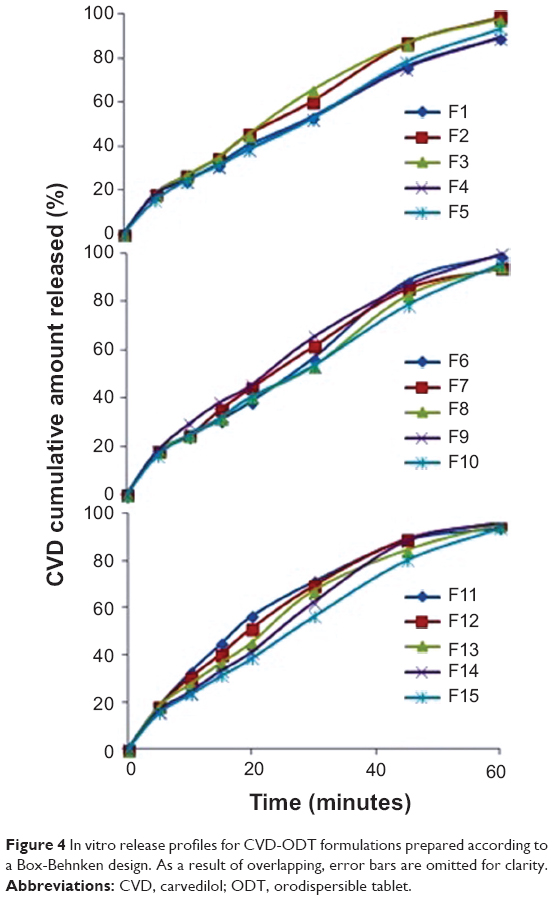
The in vitro dissolution results are presented in Figure 4. Sodium lauryl sulfate was added to the dissolution medium to maintain sink conditions and enhance the solubility of CVD at higher pH, as recommended by the US Food and Drug Administration for lipophilic drugs.31 All formulations showed cumulative CVD release of at least 89.22% within 60 minutes. Thus, it can be concluded that the prepared CVD-ODTs are a better alternative to the currently used conventional CVD tablet.
 | Figure 4 In vitro release profiles for CVD-ODT formulations prepared according to a Box-Behnken design. As a result of overlapping, error bars are omitted for clarity. |
Kinetic treatment of the in vitro release data
The goodness-of-fit method was used to study the release behavior of CVD from the different ODT formulations. In all formulations, zero-order equation showed higher correlation coefficient (r) compared with first-order and Higuchi’s square-root of time equations (Table 4).
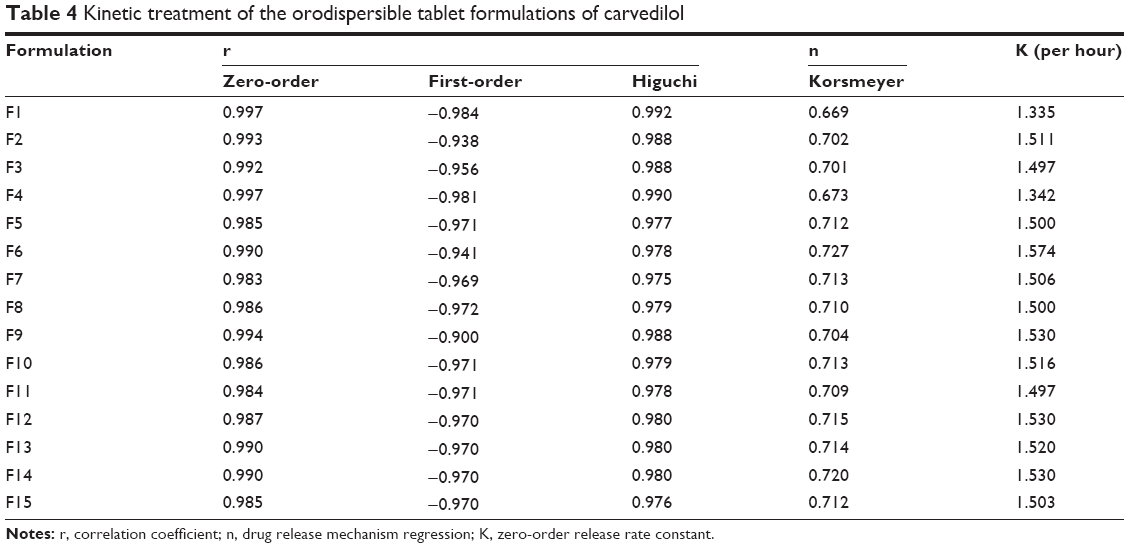 | Table 4 Kinetic treatment of the orodispersible tablet formulations of carvedilol |
The highest release rate constant (K) according to zero-order kinetics was 1.57 per hour as shown in F6 (Table 4), which was related to the high tablet erosion rate during the dissolution test. The semi-empirical equation Mt/M8 = Ktn was used to determine the drug release mechanism.32 In all cases, the exponent “n” ranged between 0.669 and 0.727 (Table 4). These values indicate non-Fickian or anomalous release, suggesting that release is controlled by a combination of diffusion and polymer relaxation.
Response surface methodology for optimization of CVD-ODTs
A three-factor, three-level BBD was constructed to evaluate the effects of the ingredients in the formulation on the hardness, disintegration time, and in vitro release of CVD from ODTs. Statistical analysis of BBD batches was performed to estimate the quantitative effects of the factors X1–X3. Two-way analysis of variance and factors, estimated effects of factors and associated P-values for (Y1–Y3) are presented in Table 5. According to these results, X1 had no significant effect on Y1, but had a significant antagonistic effect on Y2 (P=0.0001) and a significant synergistic effect on Y3 (P=0.0002). Also, it was found that X2 had a significant antagonistic effect only on Y1 (P=0.0137). On the other hand, X3 has a significant synergistic effect on Y1 (P=0.0002) and a significant antagonistic effect on Y3 (P=0.0240), with no significant effect on Y2. In addition, Y2 was significantly affected by the antagonistic effects of X1, the interaction term X2X3 and the quadratic term of X1 and X2 (P=0.0001, P=0.0132, P=0.0417, and P=0.0470, respectively). Whereas, Y2 was significantly affected by the synergistic effect of the interaction term X1X3 and the quadratic term of X3 with P=0.0147 and P=0.0434, respectively.
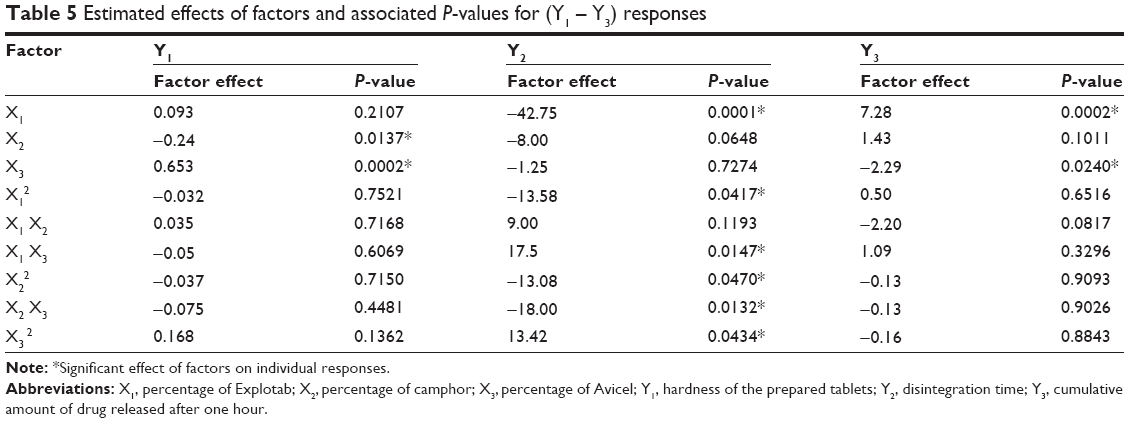 | Table 5 Estimated effects of factors and associated P-values for (Y1 – Y3) responses |
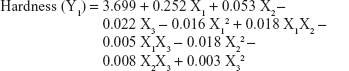
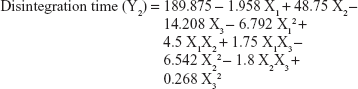
The values for the responses (Y1–Y3) of the ODTs were analyzed using Statgraphics Plus For Windows software and the mathematical model for each response was generated. The results of the multiple linear regression analysis for each response variable derived by the best fit method are shown in Equations 2–4:
|
|
|
|
|
|
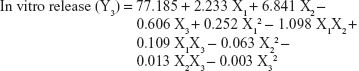
Equations 1–3 reflect the quantitative influence of the formulation variables, ie, percentage superdisintegrant (X1), percentage subliming agent (X2), and percentage binder (X3), and their interactions on the responses, ie, hardness (Y1), disintegration time (Y2), and in vitro release (Y3).
Pareto charts and main effects plots (Figure 5) are used to demonstrate the effect (in decreasing order of importance) of the independent variables and their interactions on the dependent variables. The chart includes a vertical reference line at the critical P-value of 0.05. An effect that exceeds the vertical line is considered to be statistically significant. The fact that the bar for the variable X1 extends after the reference line and has a relatively larger coefficient in the regression equations for both Y2 and Y3. As shown in Figure 5, X1 has an antagonistic effect on the disintegration time (Y2) and a synergistic effect on in vitro release (Y3). On the other hand, the variable X2 has a significant effect only on the hardness of the tablets (Y1) and its quadratic term has a significant effect on the disintegration time (Y2). The variable X3 has a significant effect on Y1 and Y3, indicating that the binder percentage (Avicel) has a significant effect in increasing both tablet hardness and decreasing the in vitro release of CVD from the ODTs after 60 minutes.
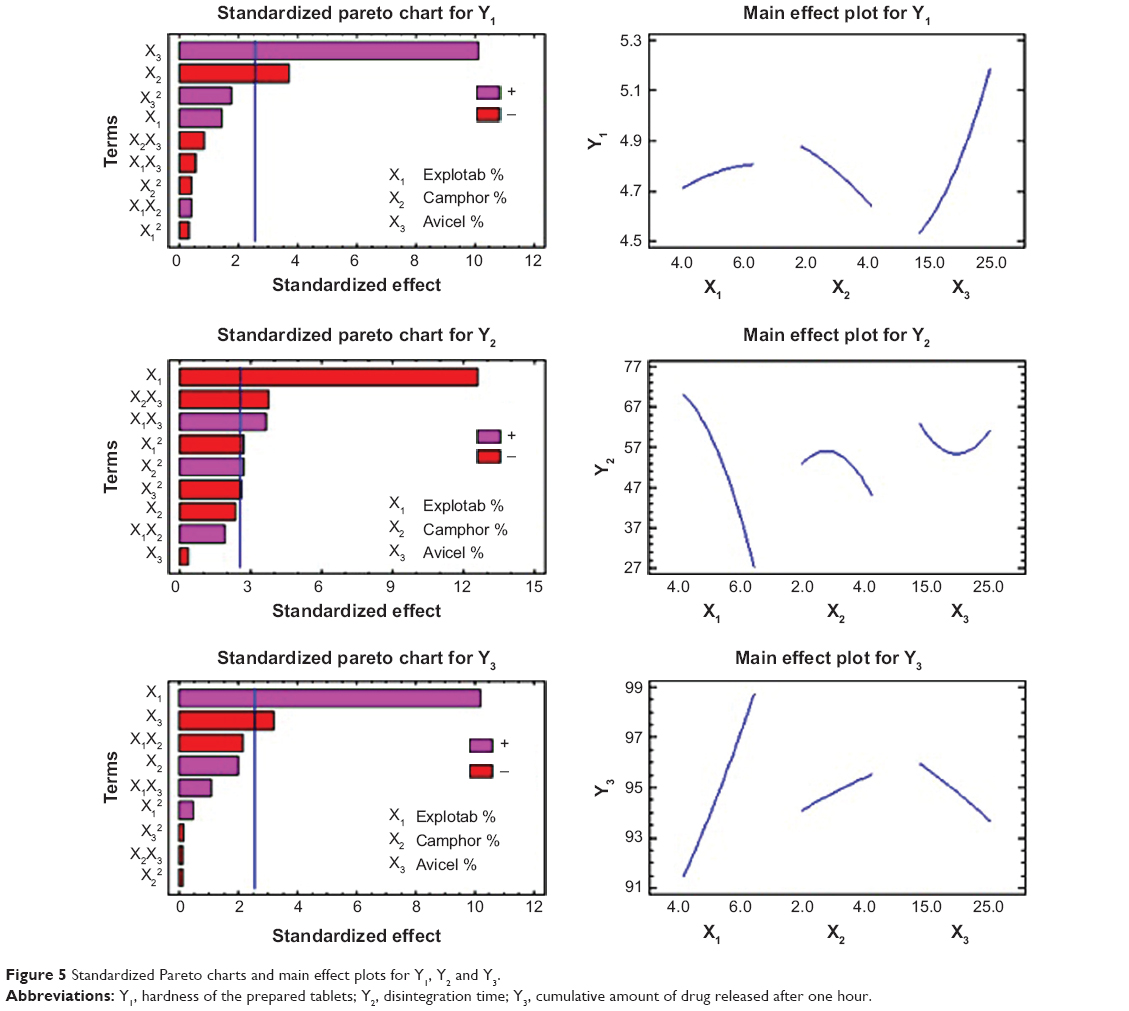 | Figure 5 Standardized Pareto charts and main effect plots for Y1, Y2 and Y3. |
Effects on hardness (Y1)
The Y1 response ranged from 4.41 kg/cm2 for F12 to 5.35 kg/cm2 for F11, as shown in Table 3. It was found that X3 has the main effect on determining the hardness of the formulation, as seen in the main effect plot for Y1 (Figure 5). A direct relationship was found between X3 and Y1. Increasing X3 from 15% to 25% increased Y1 for the CVD-ODTs from 4.51 kg/cm2 in F5 to 5.21 kg/cm2 in F4 and from 4.41 kg/cm2 in F12 to 4.99 kg/cm2 in F8. This may be explained by the increase in binding effect of Avicel, which is in agreement with previous work.33,34 On the other hand, an inverse relationship was found between X2 and Y1, ie, an increase in X2 percent will decrease Y1. This finding was deduced from the increase in Y1 from 4.77 kg/cm2 to 4.93 kg/cm2 with the decrease of X2 from 4% to 2%. This finding can be verified by the results of F1 and F7 that have a hardness of 4.75 kg/cm2 and 4.52 kg/cm2, respectively. This may be attributed to the presence of camphor in high concentration that increases the porosity of the tablets and consequently decreases the hardness of the tablets produced.35–37 Finally, the rest of the variables, their interactions, and the quadratic terms have no significant effects on hardness (Y1).
Effects on disintegration time (Y2)
The Y2 response ranged from 18 seconds in F2 to 87 seconds in F5, as shown in Table 3. It was found that X1 was the main factor responsible for the difference in disintegrating times of the formulations, as displayed in the main effect plot for Y2 (Figure 5). There was an inverse relationship between X1 and Y2. As X1 increased from 4% to 6%, Y2 decreased from 75 seconds (F1) to 24 seconds (F6), from 51 seconds (F7) to 18 seconds (F2), and from 67 seconds (F4) to 41 seconds (F3). From these results, it is obvious that the increase in X1 markedly decreases Y2, and that could be attributed to the ability of Explotab to swell in the prepared formulations; Explotab absorbs water rapidly, resulting in swelling that leads to rapid disintegration of tablets.38 Finally, the results revealed that Y2 is significantly affected by the interaction terms X2X3, X1X3, and the quadratic terms of X1, X2, and X3.
Effects on the cumulative % release (Y3)
The in vitro dissolution data for all the CVD-ODT formulations are shown in Figure 4. It is evident from the dissolution profiles that all formulations had a rapid and complete dissolution profile. The Y3 response ranged from 89.22% in F1 to 99.72% in F5, as seen in Figure 4. X1 and X3 were found to have the main effect on determining release of CVD from the ODTs. There was a direct relationship between X1 and Y3. As the percentage of X1 increased from 4% to 6%, Y3 increased from 89.22% in F1 to 98.69% in F6, from 93.61% in F7 to 98.69% in F2, and from 89.26% in F4 to 97.64% in F3. From these results, the increase in X1 markedly increased the release of CVD from ODTs. This could be related to Explotab’s porous structure that allows highest water absorption ratio, rapid rate of water uptake, and enhanced wetting of tablets.39 In contrast, when X3 increased from 15% to 25%, Y3 decreased from 99.72% in F9 to 97.64% in F3, from 93.52% in F5 to 89.26% in F4, and from 95.02% in F10 to 93.75% in F11, which can be attributed to the increased tablet hardness resulting from the increase in percentage of Avicel in the formulation. This prolongs the disintegration time and subsequently reduces the amount of drug released. Three-dimensional response surface plots and the contours of these estimated response surfaces (Figure 6) were determined graphically using the software to understand the relationship between the studied factors and the obtained responses.
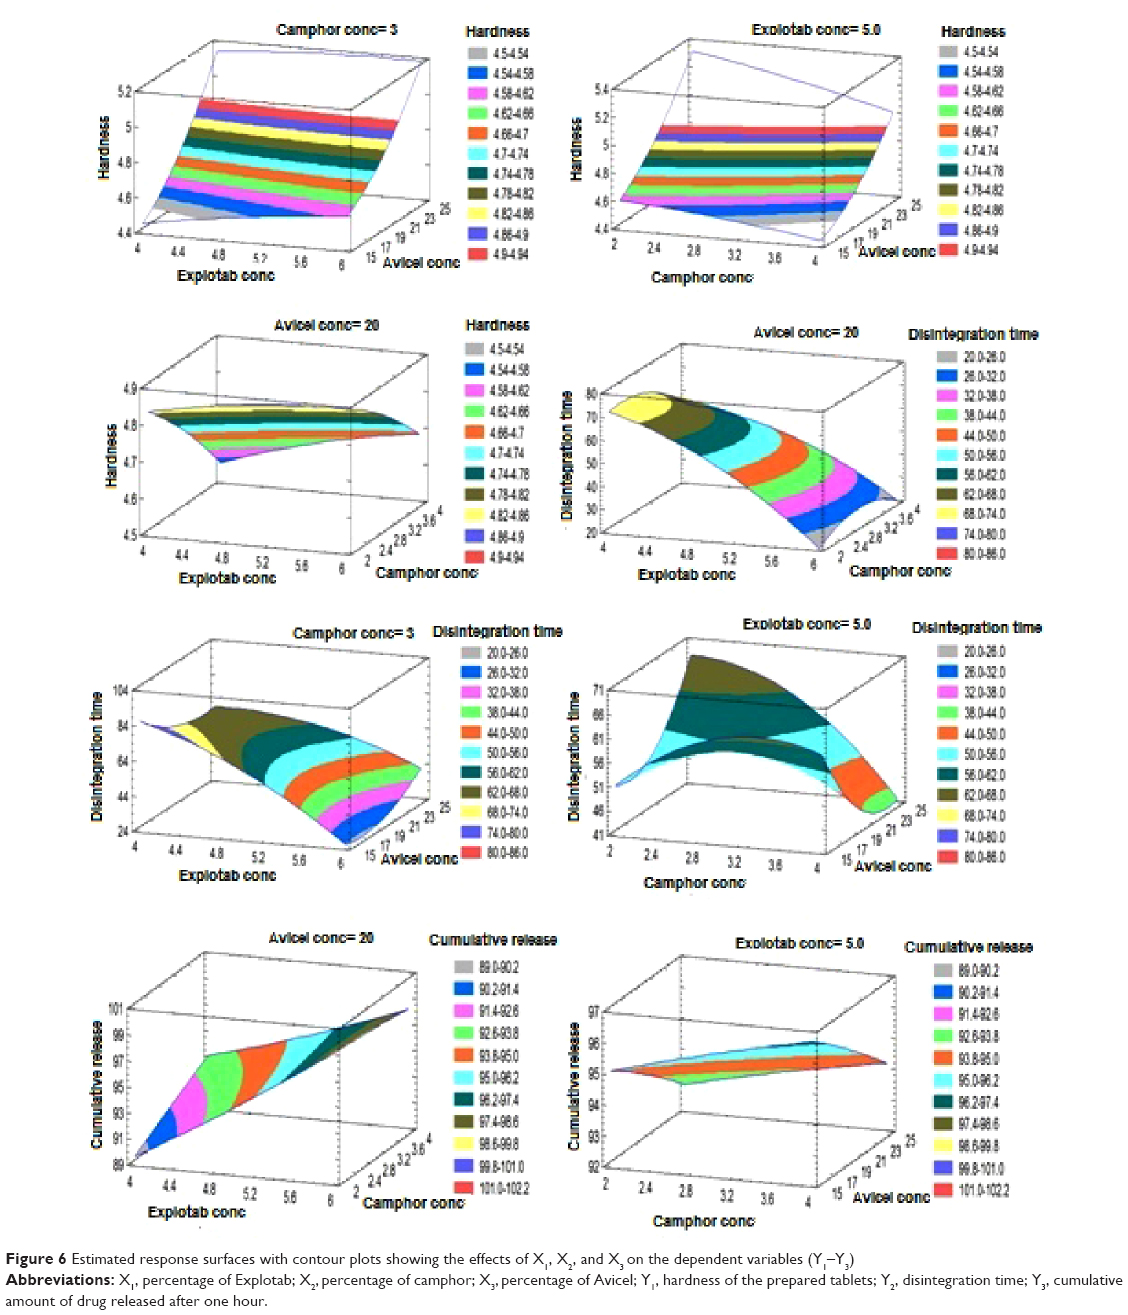 | Figure 6 Estimated response surfaces with contour plots showing the effects of X1, X2, and X3 on the dependent variables (Y1–Y3) |
Prediction of the optimized formulation
Analysis of experimental parameters was carried out to compromise the studied responses in order to reach an optimium combination of factor levels. Accordingly, this combination will maximize the desirability function over the indicated region of the obtained data. To confirm the validity of the calculated optimal parameters and the predicted responses, the responses at optimal combination of independent factors were carried out. Table 6 illustrates the optimal calculated parameters, the observed and predicted responses, and the residual values for the responses. From these results, it can be concluded that the optimized combination of independent factors ensured the desired hardness, disintegration time, and drug release profile. In addition, this finding verified the reliability of the optimization procedure with regard to maximizing the hardness of the ODTs, shortening the disintegration time to fulfill pharmacopeial requirements, and improving the amount of CVD released within 60 minutes via the direct compression method.
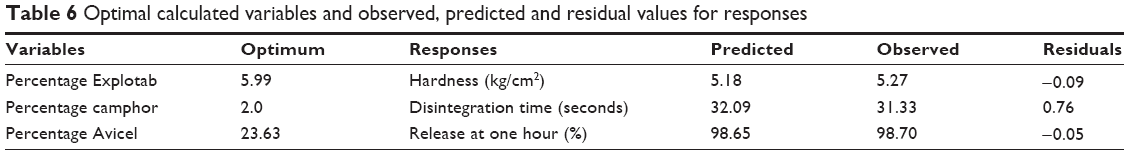 | Table 6 Optimal calculated variables and observed, predicted and residual values for responses |
In vivo and pharmacokinetic evaluation in rabbits
An in vivo study was done to compare the pharmacokinetics of CVD from the optimized ODT formulation with those of the marketed CVD tablet. A single dose of CVD (2.5 mg/kg) was given to New Zealand white rabbits according to a double-blind, randomized, crossover design.
The mean plasma concentration-time profiles of CVD after oral administration of a single dose (2.5 mg/kg) of the optimized CVD-ODT formulation and the marketed tablet are shown in Figure 7. Cmax, tmax, AUC0–24, half-life, Kel, and mean residence time for CVD from these formulations are summarized in the inset table of Figure 7.
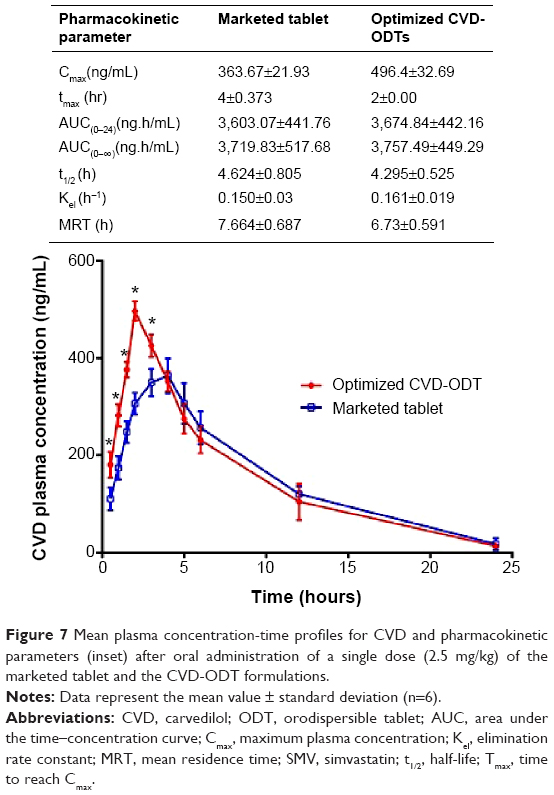 | Figure 7 Mean plasma concentration-time profiles for CVD and pharmacokinetic parameters (inset) after oral administration of a single dose (2.5 mg/kg) of the marketed tablet and the CVD-ODT formulations. |
The results indicated that the bioavailability (F) of the ODT formulation when compared with that of the marketed tablet was 101.992%. These data indicate that the ODT slightly improved the bioavailability of CVD in comparison with the marketed tablet. On the other hand, the in vivo data showed that the oral absorption of CVD from the ODT formulation was markedly higher than that of the marketed tablet as a result of the significant improvement in Cmax from 363.667 to 496.4 ng/mL for the marketed tablet and the optimized CVD-ODT formulation, respectively. Moreover, the tmax of the ODT decreased to 2 hours, compared with the tmax of 4 hours for the marketed tablet. This leads to acceleration of the onset of action for the ODT when compared with the marketed tablet.
Analysis of variance showed significant (P<0.0001) differences between samples taken from the two groups of rabbits during the absorption phase at 0.5, 1, 1.5, 2, and 3 hours, indicating significant enhancement achieved by the ODT. The inclusion complex of CVD with HP-β-CD formulated as oral disintegrating tablets allows for higher apparent solubility, thereby increasing both the dissolution rate and the concentration of drug available for absorption.40 Based on these results, the inclusion complex of CVD with HP-β-CD as well as its formulation as an ODT is a promising method for enhancing the solubility and oral absorption of CVD.
Conclusion
The results of this study showed that preparation of solid binary systems of CVD with HP-β-CD in a molar ratio of 1:2 improves drug solubility by more than three-fold. BBD was used to evaluate the independent variables producing optimum ODT properties. The percentage of the superdisintegrant (sodium starch glycolate) had the main effect in achieving the desired tablet properties, in addition to the subliming agent (camphor) used and the concentration of the incorporated binder (Avicel). Optimized combination of independent factors maximized the hardness of the ODT, shortened the disintegration time to fulfill pharmacopeial requirements and increased the amount of CVD released within 60 minutes. Comparison of the pharmacokinetics of the optimized CVD-ODT with that of the marketed tablet in healthy rabbits showed a significant improvement in the onset of action of CVD after oral administration of the optimized formulation due to enhancement of drug solubility and subsequently accelerated drug absorption.
Disclosure
The authors report no conflicts of interest in this work.
References
Stafylas PC, Sarafidis PA. Carvedilol in hypertension treatment. Vasc Health Risk Manag. 2008;4(1):23–30. | ||
World Health Organization. The Selection and Use of Essential Medicines, WHO Expert Committee Report, 2011. Available from: http://www.who.int/selection_medicines/committees/expert/17/en/. Accessed January 28, 2015. | ||
Chakraborty S, Shukla D, Jain A, Mishra B, Singh S. Assessment of solubilization characteristics of different surfactants for carvedilol phosphate as a function of pH. J Colloid Interface Sci. 2009;335(2):242–249. | ||
Neugebauer G, Akpan W, Kaufmann B, Reiff K. Stereoselective disposition of carvedilol in man after intravenous and oral administration of the racemic compound. Eur J Clin Pharmacol. 1990;38(2):108–111. | ||
Morgan T. Clinical pharmacokinetics and pharmacodynamics of carvedilol. Clin Pharmacokinet. 1994;26(5):335–346. | ||
Takagi T, Ramachandran C, Bermejo M, Yamashita S, Yu LX, Amidon GL. A provisional biopharmaceutical classification of the top 200 oral drug products in the United States, Great Britain, Spain, and Japan. Mol Pharm. 2006;3(6):631–643. | ||
Wei L, Sun P, Nie S, Pan W. Preparation and evaluation of SEDDS and SMEDDS containing carvedilol. Drug Dev Ind Pharm. 2005;31(8):785–794. | ||
Mahmoud EA, Bendas ER, Mohamed MI. Preparation and evaluation of self-nanoemulsifying tablets of carvedilol. AAPS Pharm Sci Tech. 2009;10(1):183–192. | ||
Pamudji JS, Mauludin R, Lestari VA. Improvement of carvedilol dissolution rate through formation of inclusion complex with β-cyclodextrin. Int J Pharm Pharm Sci. 2014;6(4):2–7. | ||
Yamsani V, Gannu R, Kolli C, Rao M, Yamsani M. Development and in vitro evaluation of buccoadhesive carvedilol tablets. Acta Pharm. 2007;57(2):185–197. | ||
Vishnu V, Chandrasekhar K, Ramesh G, Rao MY. Development of mucoadhesive patches for buccal administration of carvedilol. Curr Drug Deliv. 2007;4(1):27–39. | ||
Nolte K, Backfisch G, Neidlein R. In vitro absorption studies with carvedilol using a new model with porcine intestine called BM-RIMO (Boehringer-Mannheim ring model). Arzneimittelforschung. 1999;49(09):745–749. | ||
Valleri M, Mura P, Maestrelli F, Cirri M, Ballerini R. Development and evaluation of glyburide fast dissolving tablets using solid dispersion technique. Drug Dev Ind Pharm. 2004;30(5):525–534. | ||
Karavas E, Ktistis G, Xenakis A, Georgarakis E. Effect of hydrogen bonding interactions on the release mechanism of felodipine from nanodispersions with polyvinylpyrrolidone. Eur J Pharm Biopharm. 2006;63(2):103–114. | ||
Tenjarla S, Puranajoti P, Kasina R, Mandal T. Preparation, characterization, and evaluation of miconazole-cyclodextrin complexes for improved oral and topical delivery. J Pharm Sci. 1998;87(4):425–429. | ||
Modi A, Tayade P. Enhancement of dissolution profile by solid dispersion (kneading) technique. AAPS Pharm Sci Tech. 2006;7(3):68. | ||
Higuchi T, Connors A. Phase-solubility techniques. In: Advances in Analytical Chemistry Instrumentation. New York, NY, USA: Wiley Interscience; 1965. | ||
The United States Pharmacopoeia, The National Formulary (USP 28/NF23), USP Convention INC., Rockville, MD, 2005: 2411–2503. | ||
Wagner J. Interpretation of percent dissolved-time plots derived from in vitro testing of conventional tablets and capsules. J Pharm Sci. 1969;58:1253–1257. | ||
Desai SJ, Singh P, Simonelli AP, Higuchi W. Investigation of factors influencing release of solid drug dispersed in inert matrices III. Quantitative studies involving the polyethylene plastic matrix. J Pharm Sci. 1966;55(11):1230–1234. | ||
Higuchi T. Mechanism of sustained-action medication. Theoretical analysis of rate of release of solid drugs dispersed in solid matrices. J Pharm Sci. 1963;52(12):1145–1149. | ||
Korsmeyer RW, Gurny R, Doelker E, Buri P, Peppas N. Mechanisms of potassium chloride release from compressed, hydrophilic, polymeric matrices: effect of entrapped air. J Pharm Sci. 1983;15(1):1189–1191. | ||
Ritger P, Peppas N. A simple equation for description of solute release. II. Fickian and anomalous release from swellable devices. J Control Release. 1987;5:37–42. | ||
European Parliament. Directive 2010/63/EU of the European Parliament and of the Council of 22 September 2010 on the protection of animals used for scientific purposes. 2010;L 276/33 D:33–79. Available from: http://ec.europa.eu/environment/chemicals/lab_animals/legislation_en.htm. Accessed January 28, 2015. | ||
Kim S-H, Lee SH, Lee HJ. Rapid and sensitive carvedilol assay in human plasma using a high-performance liquid chromatography with mass/mass spectrometer detection employed for a bioequivalence study. Am J Anal Chem. 2010;01(03):135–143. | ||
Shewale BD, Sapkal NP, Raut NA, Gaikwad NJ, Fursule RA. Effect of hydroxylpropyl-β-cyclodextrin on solubility of carvedilol. Indian J Pharm Sci. 2008;70(2):255–257. | ||
Patel R, Purohit N. Physico-chemical characterization and in vitro dissolution assessment of clonazepam-cyclodextrins inclusion compounds. AAPS Pharm Sci Tech. 2009;10(4):1301–1312. | ||
Pokharkar VB, Mandpe LP, Padamwar MN, Ambike AA, Mahadik KR, Paradkar A. Development, characterization and stabilization of amorphous form of a low Tg drug. Powder Technol. 2006;167(1):20–25. | ||
Chowdary K, Reddy G. Complexes of nifedipine with beta and hydroxypropyl beta cyclodextrins in the design of nifedipine SR tablets. Indian J Pharm Sci. 2002;64(2):142−146. | ||
Jagannathan L, Meenakshi R, Gunasekaran S, Srinivasan S. FT-IR, FT-Raman and UV-vis spectra and quantum chemical investigation of carvedilol. Mol Simul. 2010;36(4):283–290. | ||
Jamzad S, Fassihi R. Role of surfactant and pH on dissolution properties of fenofibrate and glipizide – a technical note. AAPS Pharm Sci Tech. 2006;7(2):E33. | ||
Peppas NA. Analysis of Fickian and non-Fickian drug release from polymers. Pharm Acta Helv. 1985;60(4):110–111. | ||
Kumar V, de la Luz Reus-Medina M, Yang D. Preparation, characterization, and tabletting properties of a new cellulose-based pharmaceutical aid. Int J Pharm. 2002;235(1–2):129–140. | ||
de la Luz Reus Medina M, Kumar V. Evaluation of cellulose II powders as a potential multifunctional excipient in tablet formulations. Int J Pharm. 2006;322(1–2):31–35. | ||
Gohel M, Patel M, Amin A, Agrawal R, Dave R, Bariya N. Formulation design and optimization of mouth dissolve tablets of nimesulide using vacuum drying technique. AAPS Pharm Sci Tech. 2004;5(3):e36. | ||
Abed KK, Hussein AA, Ghareeb MM, Abdulrasool AA. Formulation and optimization of orodispersible tablets of diazepam. AAPS Pharm Sci Tech. 2010;11(1):356–361. | ||
Bhatt SA, Mandge SA, Prititrivedi. Design, development and optimization of fast dissolving tablet of ondansetron HCl using mannitol with camphor, a subliming material. Int J Pharm Pharm Sci. 2013;5(3):1–6. | ||
Fini A, Bergamante V, Ceschel GC, Ronchi C, de Moraes CA. Fast dispersible/slow releasing ibuprofen tablets. Eur J Pharm Biopharm. 2008;69(1):335–341. | ||
Pabari R, Ramtoola Z. Effect of a disintegration mechanism on wetting, water absorption, and disintegration time of orodispersible tablets. J Young Pharm. 2012;4(3):157–163. | ||
Kawabata Y, Wada K, Nakatani M, Yamada S, Onoue S. Formulation design for poorly water-soluble drugs based on biopharmaceutics classification system: basic approaches and practical applications. Int J Pharm. 2011;420(1):1–10. |
 © 2015 The Author(s). This work is published and licensed by Dove Medical Press Limited. The
full terms of this license are available at https://www.dovepress.com/terms
and incorporate the Creative Commons Attribution
- Non Commercial (unported, 3.0) License.
By accessing the work you hereby accept the Terms. Non-commercial uses of the work are permitted
without any further permission from Dove Medical Press Limited, provided the work is properly
attributed. For permission for commercial use of this work, please see paragraphs 4.2 and 5 of our Terms.
© 2015 The Author(s). This work is published and licensed by Dove Medical Press Limited. The
full terms of this license are available at https://www.dovepress.com/terms
and incorporate the Creative Commons Attribution
- Non Commercial (unported, 3.0) License.
By accessing the work you hereby accept the Terms. Non-commercial uses of the work are permitted
without any further permission from Dove Medical Press Limited, provided the work is properly
attributed. For permission for commercial use of this work, please see paragraphs 4.2 and 5 of our Terms.