Back to Journals » Drug Design, Development and Therapy » Volume 15
Development and Evaluation of a Physiologically Based Pharmacokinetic Drug-Disease Model of Propranolol for Suggesting Model Informed Dosing in Liver Cirrhosis Patients
Authors Kalam MN, Rasool MF ![]() , Alqahtani F
, Alqahtani F ![]() , Imran I, Rehman AU, Ahmed N
, Imran I, Rehman AU, Ahmed N ![]()
Received 21 December 2020
Accepted for publication 25 February 2021
Published 17 March 2021 Volume 2021:15 Pages 1195—1211
DOI https://doi.org/10.2147/DDDT.S297981
Checked for plagiarism Yes
Review by Single anonymous peer review
Peer reviewer comments 2
Editor who approved publication: Prof. Dr. Tin Wui Wong
Muhammad Nasir Kalam,1 Muhammad Fawad Rasool,2 Faleh Alqahtani,3 Imran Imran,4 Asim Ur Rehman,1 Naveed Ahmed1
1Department of Pharmacy, Quaid-i-Azam University, Islamabad, 45320, Pakistan; 2Department of Pharmacy Practice, Faculty of Pharmacy, Bahauddin Zakariya University, Multan, 60800, Pakistan; 3Department of Pharmacology and Toxicology, College of Pharmacy, King Saud University, Riyadh, 11451, Saudi Arabia; 4Department of Pharmacology, Faculty of Pharmacy, Bahauddin Zakariya University, Multan, 60800, Pakistan
Correspondence: Naveed Ahmed
Department of Pharmacy, Quaid-i-Azam University, Islamabad, 45320, Pakistan
Tel +92 (51) 90644180
Email [email protected]
Muhammad Fawad Rasool
Department of Pharmacy Practice, Faculty of Pharmacy, Bahauddin Zakariya University, Multan, Pakistan
Tel +923008639046
Email [email protected]
Aim: The study was aimed to understand the underlying causes for the differences in propranolol pharmacokinetics (PK) between healthy and cirrhosis populations by using a systematic whole-body physiologically based pharmacokinetic (PBPK) model-building approach for suggesting model informed propranolol dosing in liver cirrhosis patients with different stages of disease severity.
Methods: A whole-body PBPK model was developed by using population simulator PK-Sim® by using reported physicochemical and clinical data for propranolol in healthy and liver cirrhosis populations. The model evaluation was done by visual verification and comparison of PK parameters using their observed/predicted ratios (Robs/pred).
Results: The developed model has effectively described the disposition of propranolol after intravenous and oral application in healthy and liver cirrhosis populations. All the model predictions were comparable to the observed clinical data and the Robs/pred for all the PK parameters were within a 2-fold range. A significant increase in plasma concentration of propranolol and decrease in drug clearance was observed in progressive stages of liver cirrhosis. The developed model after evaluation with the reported clinical PK data was used for suggesting model informed propranolol dosing in different stages of liver cirrhosis based on systemic unbound drug concentration.
Conclusion: The developed PBPK model has successfully described propranolol PK in healthy and cirrhosis populations after IV and oral administration. The evaluated PBPK propranolol-cirrhosis model can have many implications in predicting propranolol dosing in liver cirrhosis patients with different stages of disease severity.
Keywords: PBPK, propranolol, cirrhosis, dose adjustments, drug therapy
Introduction
Propranolol, a non-selective beta-blocker drug first marketed in 1964, is still indicated for a variety of cardiovascular diseases (CVD) like cardiac arrhythmias, ischemic heart disease, heart failure, and hypertension.1,2 It is also prescribed in non-cardio-vascular diseases (NCVD) like migraine, anxiety, thyrotoxicosis, tremors, and infantile haemangiomas.1 It is recommended for pre, primary and secondary prophylaxis of variceal bleeding in cirrhosis.1–3 It significantly reduces variceal re-bleeding as compared to placebo4 but at the same time, it reduces the portal vein velocity (PVV) which is a major cause of portal vein thrombosis (PVT), an adverse outcome of liver cirrhosis.4,5 In a recent meta-analysis, a significant association was found between the use of propranolol in cirrhosis and the development of PVT.5
Propranolol has a high hepatic extraction ratio (0.8–0.9)6 and is extensively metabolized by the liver UDP-glucuronosyltransferases (UGTs)7 and cytochrome P450 (CYP) 2D6, 2C19, and 1A2 enzymes.8 Therefore, an alteration in hepatic blood flow (QH) and CYP enzyme activity may have a considerable effect on propranolol disposition.9 Its pharmacokinetics (PK) can be altered in conditions where changes in QH and hepatic enzymes are reported, as in liver cirrhosis.10 The pathophysiological changes occurring in chronic conditions (liver cirrhosis) can be incorporated into a physiologically based pharmacokinetic (PBPK) model to predict and optimize administered drug doses.11–15
There is a need to develop a generic whole-body PBPK model of propranolol for a wide range of intravenous (IV) and oral (PO) doses among healthy and diseased populations as it is still one of the most recommended drugs for a variety of CVD and NCVD.16 The availability of published clinical PK data, after IV and oral administration of propranolol in healthy populations, can assist the development of the whole-body PBPK model of propranolol by using a systematic model-building approach.11,17 After successful evaluation of the developed PBPK model in the healthy adults, the disease-specific pathophysiological changes occurring in liver cirrhosis can be incorporated into the evaluated PBPK model for predicting propranolol PK in liver cirrhosis.18,19 There are few published reports for PBPK models of propranolol that were focused on predicting the effect of food on its PK.20–22 The PBPK-Cirrhosis models for various other drugs are reported18,19,23–25 but to the best of our knowledge, there is no published report of a PBPK model for propranolol that has been used to predict its exposure in liver cirrhosis patients with different degree of disease severity. Therefore, if such a model is developed it may be used in suggesting model informed propranolol doses in liver cirrhosis patients with respect to their disease severity.5
The objective of the present study was to understand the differences in propranolol PK between healthy and disease populations by developing a whole-body PBPK model using a systematic model-building approach. This work aimed to suggest model informed propranolol dosing in liver cirrhosis patients with different stages of disease severity.
Materials and Methodology
Clinical Pharmacokinetic Data
A comprehensive literature search was done by using Pubmed and Google Scholar databases to shortlist the published literature in which concentration-time profiles and pharmacokinetic data of propranolol were available after oral and IV administration. GetData Graph Digitizer® V.2.26.0 (accessible via http://getdata-graph-digitizer.com/) was used to extract the data of plasma concentration of propranolol, at various time intervals from the reported clinical PK studies. Data from 22 clinical studies (7 for IV administration and 15 for oral administration) in healthy individuals was extracted. One-third (3 IV26–28 and 5 oral29–33) of which were used for the development of the PBPK model and the rest of the two-thirds (4 IV and 10 oral) were used for subsequent model verifications. All the observed data sets were used for model evaluation. The list of clinical studies and demographics used for the development and verification of the propranolol-PBPK model in the healthy population are summarized in Table 1.
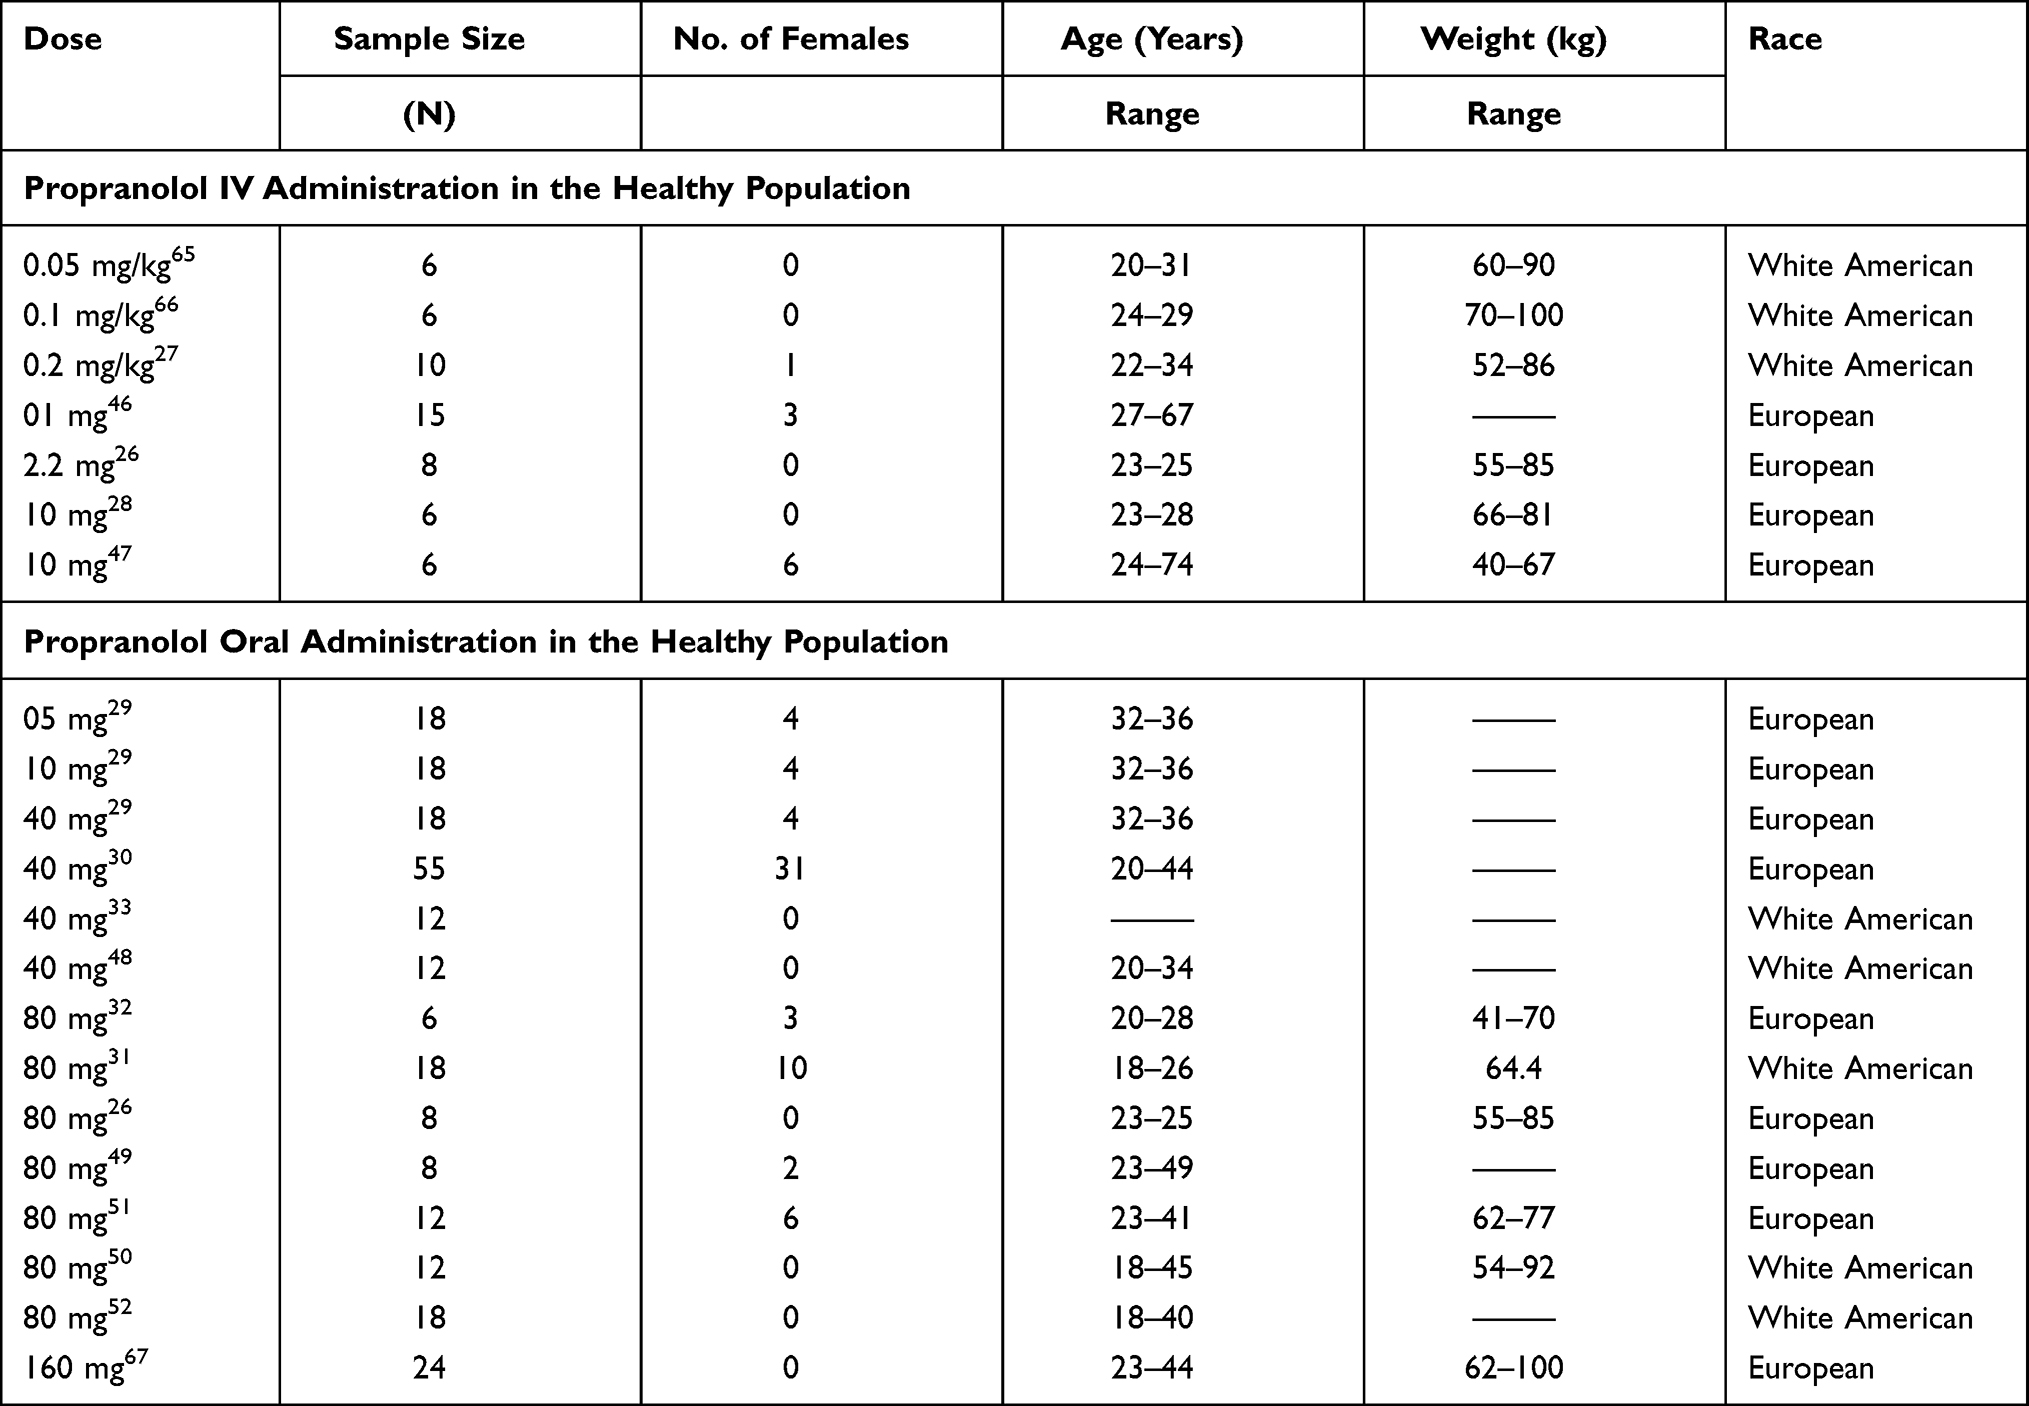 |
Table 1 List of Clinical Studies and Their Demographics Used for the Development and Verification of Propranolol-PBPK-Healthy Population Model |
In liver cirrhosis, 07 clinical studies were used and their demographics are summarized in Table 2. Participants of these studies were classified based on the severity of liver cirrhosis measured by the physiological scoring method as Child Pugh-A (CP-A), Child Pugh-B (CP-B), and Child Pugh-C (CP-C) for mild, moderate, and severe cirrhosis respectively.34 This scoring is based upon the measurement of five morphological and physiological biomarkers including i) total bilirubin concentration ii) serum albumin levels iii) prothrombin time with international normalized ratio (INR) iv) ascites and v) hepatic encephalopathy.34 In six clinical studies participants were stratified into CP A, B, and C groups but in one of the selected studies, only data of morphological and physiological biomarkers was available.35 This information was used to classify participants of this study into different CP groups.34 All of the studies, which were included for model evaluation in liver cirrhosis consisted of mixed cirrhosis populations (CP A–C).
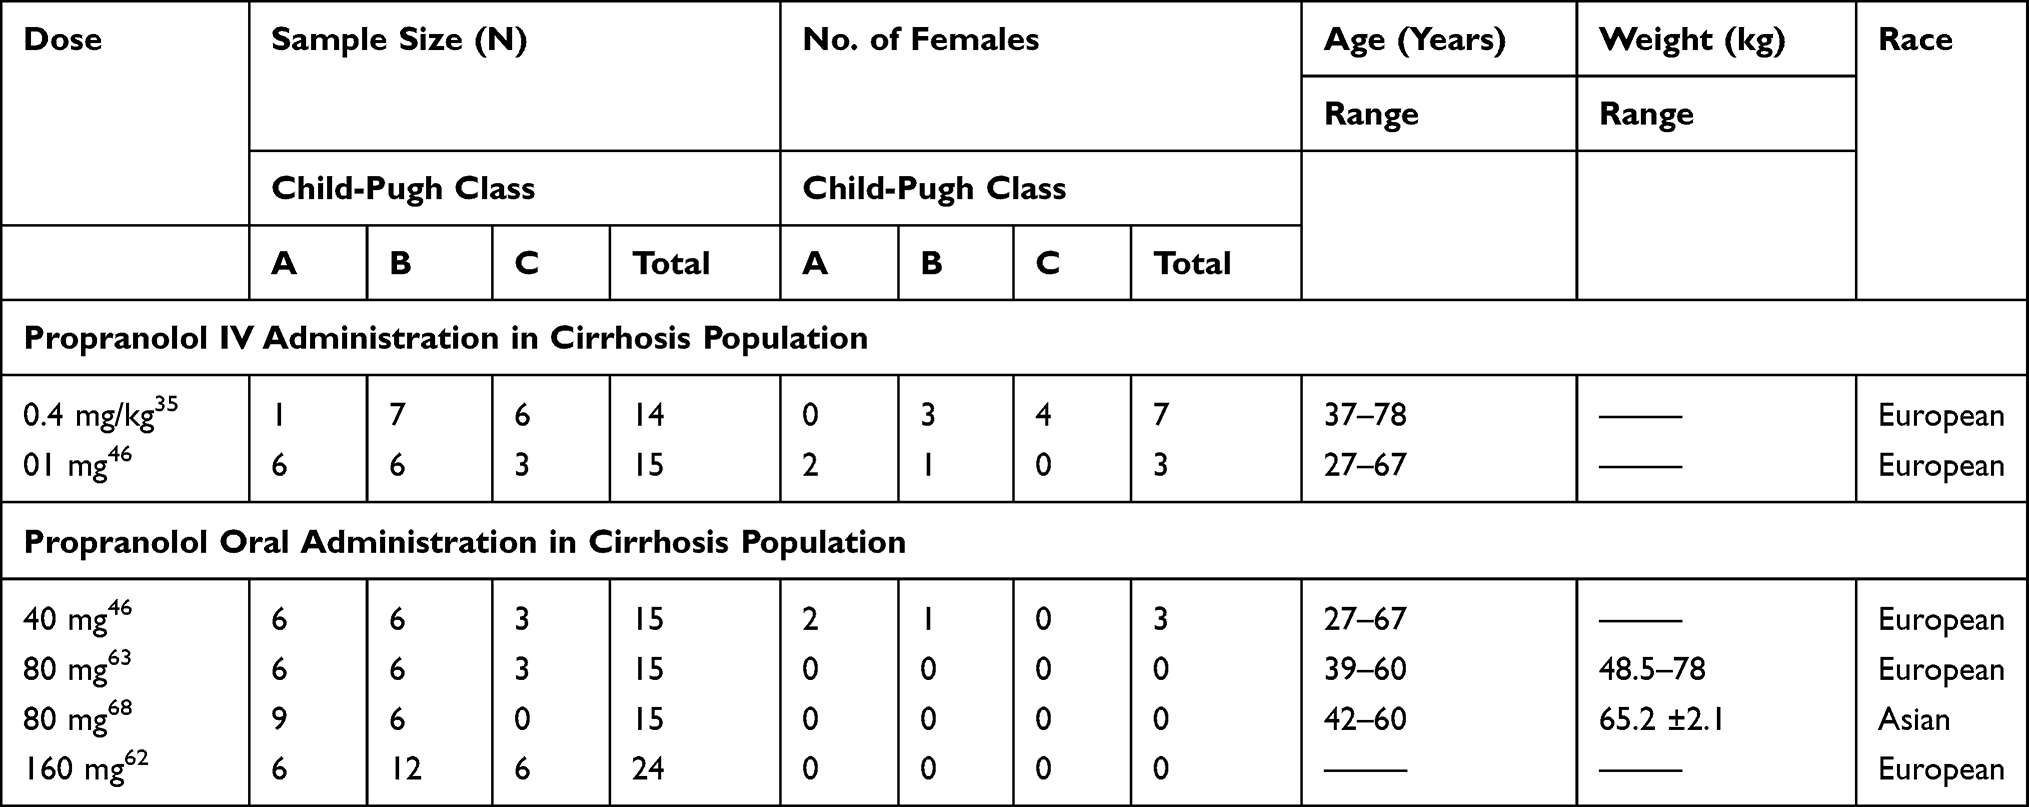 |
Table 2 List of Clinical Studies and Their Demographics Used for the Development and Verification of Propranolol- Cirrhosis PBPK Model |
PBPK Modeling Software
Whole-body physiological based pharmacokinetic (WB-PBPK) models of propranolol in healthy adults and cirrhotic population were developed using the population-based PBPK simulator PK-Sim® (modeling program). This software package and source codes of developed models are the parts of open system pharmacology (OSP) suit are now freely available for all the users (http://www.open-systems-pharmacology.org).
Development of Building Blocks
As PBPK modeling in the used modeling platform is based upon the principle of building blocks. To create building blocks, drug and disease-related data were gathered from literature and incorporated into the building blocks. Certain parameters were fitted after parameter identification to predict the exposure of the drug more precisely. Input parameters used in the development of the PBPK model of propranolol are summarized in Table 3.
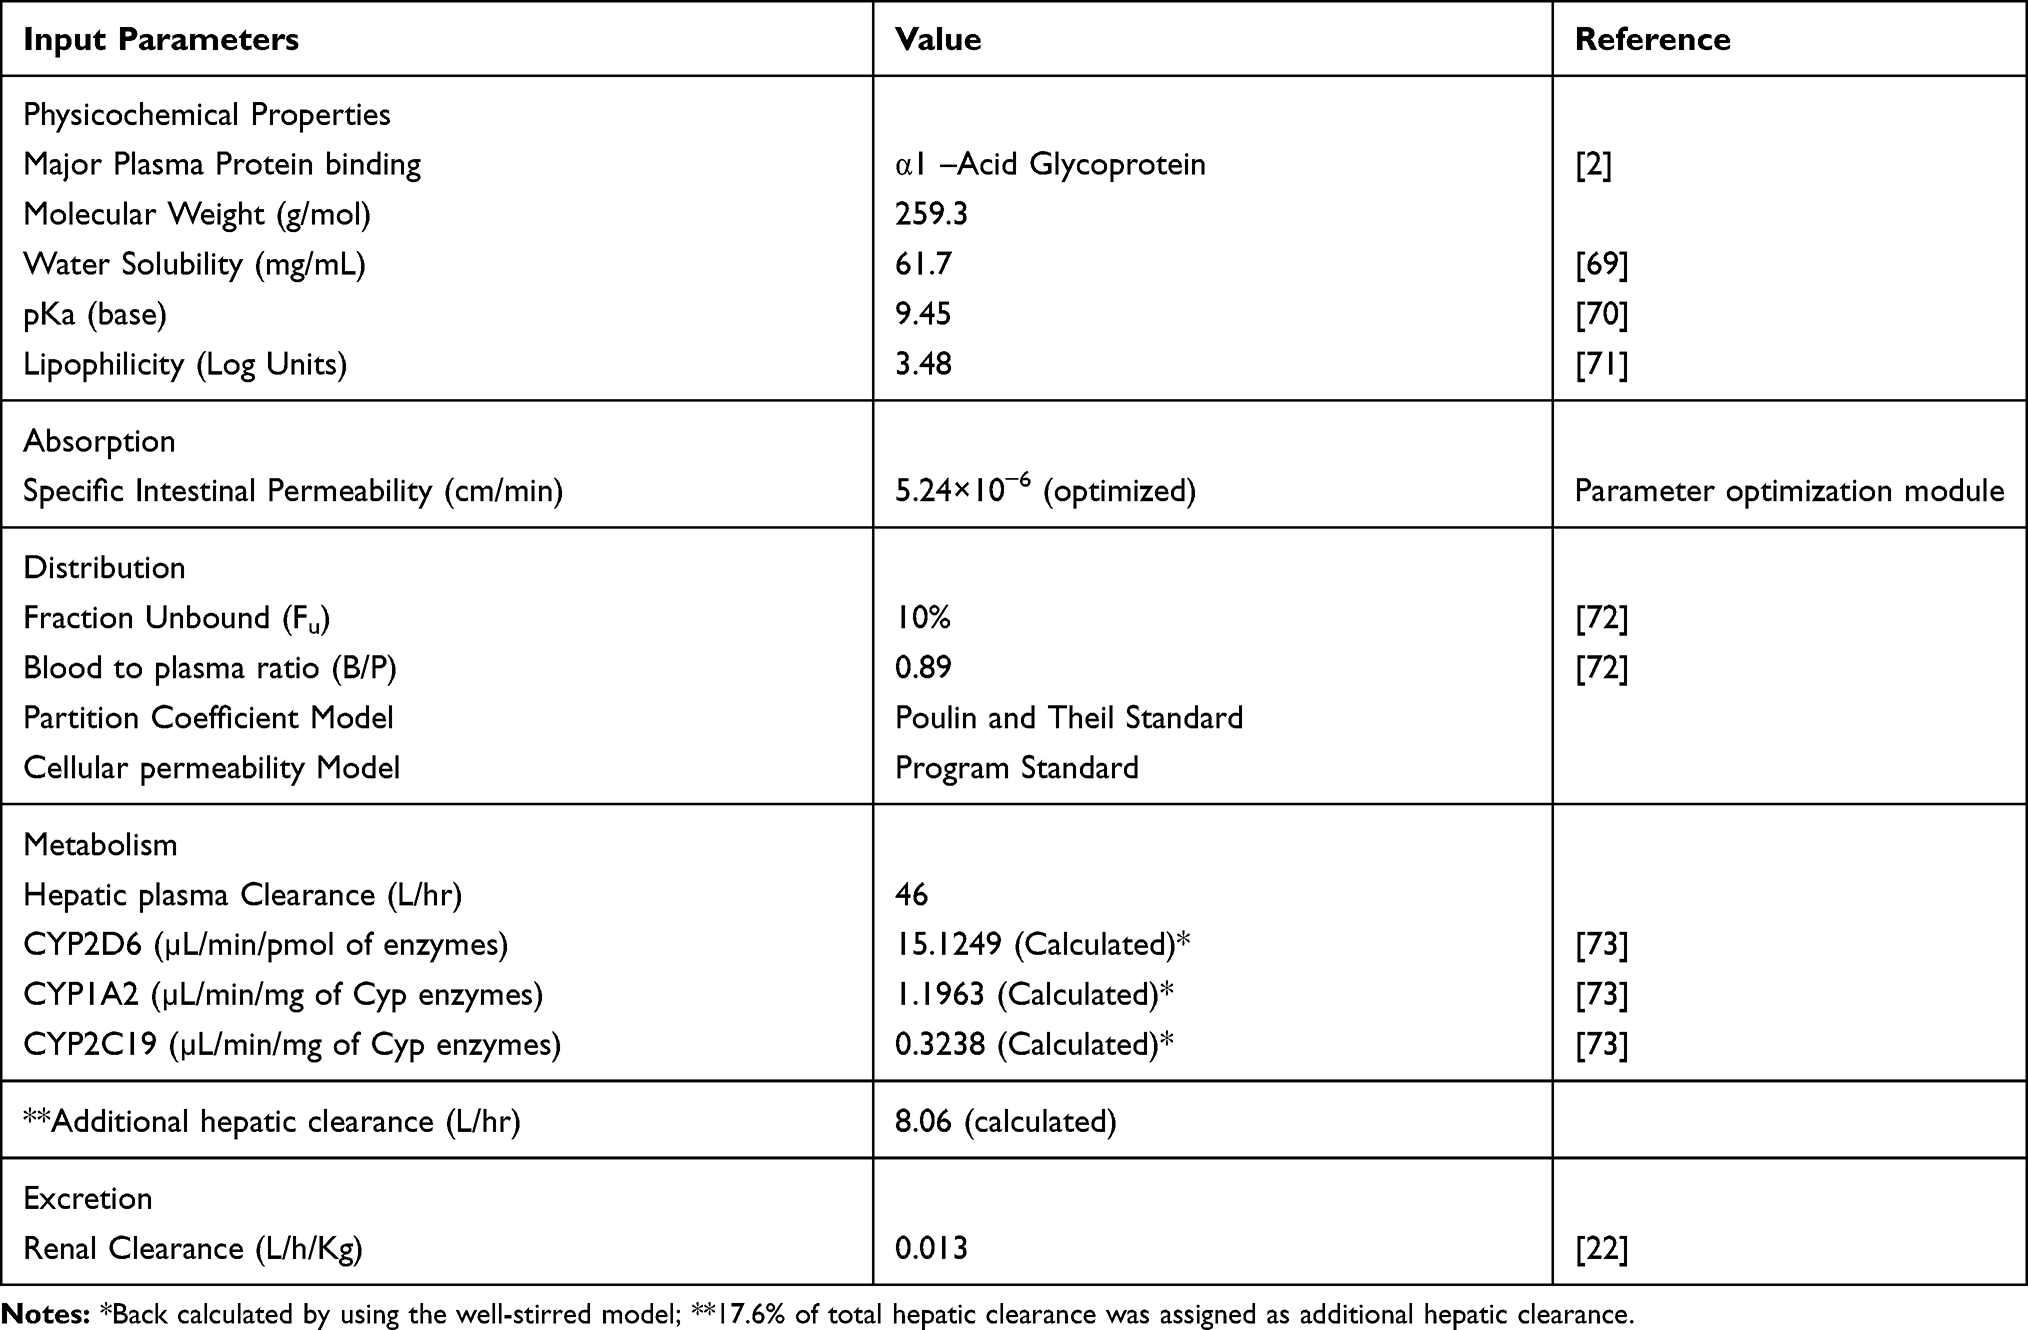 |
Table 3 Input Parameters Used for the Development of PBPK Model of Propranolol |
Modeling Strategy
The modeling strategy adopted for PBPK simulations of propranolol is depicted in Figure 1. The standard protocol was observed to develop PBPK models as described in the literature.11 First drug disposition was modulated after IV administration because absorption is a complex process and involves the partition of a drug between multiple compartments. To bypass the complexity of absorption, the IV approach was adopted first which yielded distribution and elimination patterns comparable to observed data. In this step, intrinsic clearance of CYP2D6, CYP1A2, CYP2C19, hepatic and renal clearances were used as elimination parameters. Molecular weight and fraction unbound of propranolol described the distribution of a drug between various compartments. Program inbuilt differential equations were used to explain the distribution of the drug. In every simulation, a total of 100 virtual subjects were created with a similar proportion of females, frequency and dose administered, age, weight, height, and ethnicity as reported in the reference clinical study. The modeling tool has inbuilt population-specific values of organ weights, blood flow rates, tissue composition on age, gender, body weight, and body mass index for different ethnic populations. Different combinations of these parameters are assigned to individuals within the mean input values until the whole population has been created.
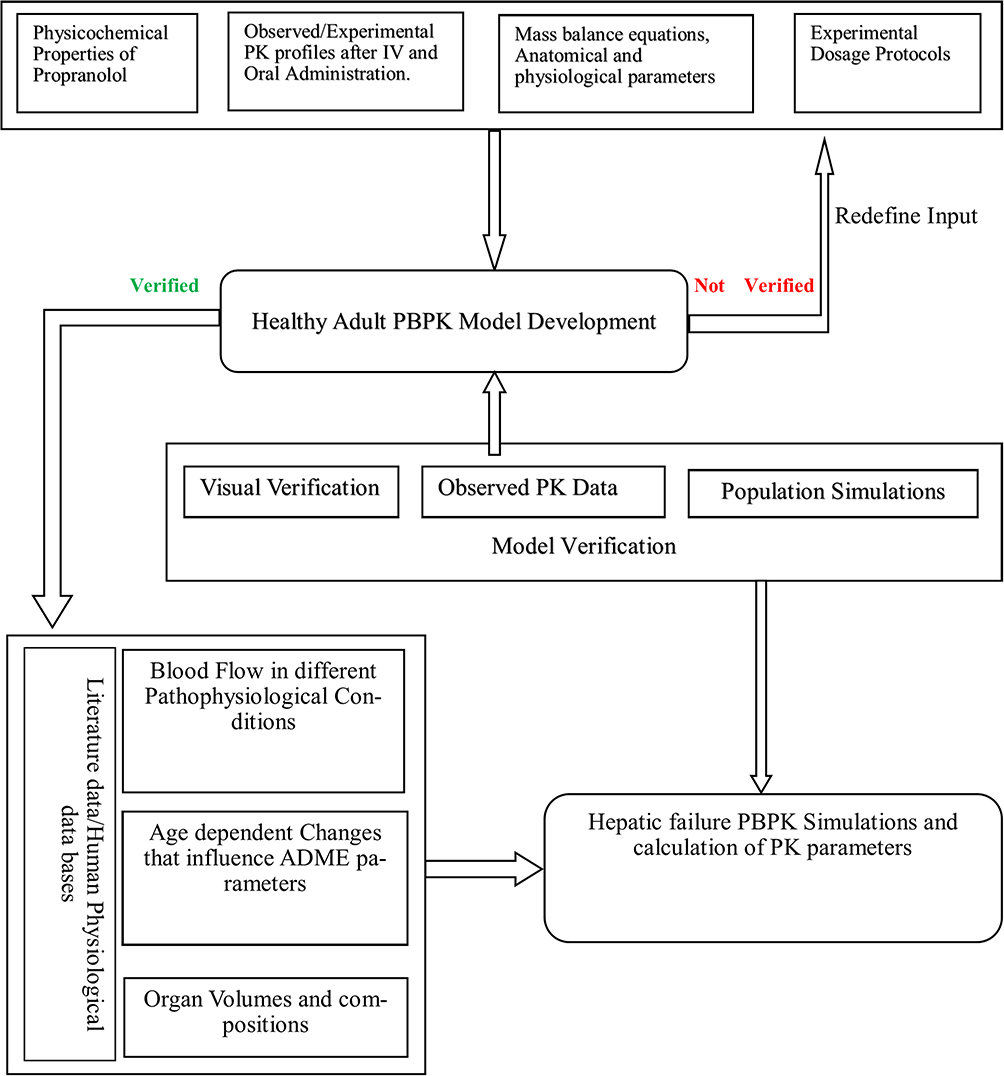 |
Figure 1 General workflow of the development of propranolol PBPK model in healthy and cirrhotic populations. |
Model Structure
Physicochemical Properties
Propranolol (C16H21NO2) is a basic drug with a pKa value of 9.42, molecular weight 259.3 g/mol, and lipophilicity constant (Log p) 3.48. Further details of physicochemical properties are presented in Table 3.
Absorption
For oral drug administration, the mechanistic absorption model of the modeling program was used. In this absorption model gastrointestinal tract (GIT) was divided into 12 compartments and each compartment was further divided into additional mucosal compartments.36 Specific intestinal permeability of propranolol, calculated from its lipophilicity and molecular weight, was 6.64×10⁻⁴ cm/min. A value of 5.24×10⁻⁶ cm/min was used in this model after the parameter identification feature of the modeling program.37 The specific intestinal permeability of propranolol reported in the literature ranged from 2.8×10⁻⁴–6.67×10⁻⁴ and 6.67 ± 3.42 ×10⁻⁴ cm/s.38,39
Distribution
The standard calculation method present in the modeling program was adopted to estimate the cellular permeability. The Poulin and Theil model was used for the estimation of tissue plasma partition coefficients.36
Elimination
To describe elimination in the best way, the intrinsic clearance (CLint) values of CYP enzymes responsible for the metabolism of propranolol were back-calculated from the well-stirred liver model.11 Firstly, total hepatic intrinsic clearance (CLint(H)) of all contributing enzymes was calculated from unbound plasma fraction (fu), blood to plasma ratio (B/P) of drug, hepatic clearance (CLH) of propranolol (Table 3) after IV administration, and renal clearance (CLR) (Table 3) clearance.40 Secondly, The CLint(H) was used to estimate the CLint of each contributing CYP enzyme by multiplying the percentage contribution of the respective enzyme with CLint(H). Propranolol is extensively metabolized in the liver through CYP (82.4%) and UGTs (17.6%). The percentage contributions of CYP enzymes reported in the literature are 59% (2D6), 21% (1A2), and 2.4% (2C19) respectively,41 but there is no exact information available for the contributions by UGTs. In addition to this, the abundance of UGTs remained preserved in liver cirrhosis18,24 therefore, the remaining 17.6% CLint(H) was assigned as additional hepatic clearance (CLHadd) in the developed model.
Scaling of Adult PBPK Model for Predictions in Cirrhotic Population
The reported pathophysiological changes in different stages of the liver cirrhosis (CP-A-C) population were incorporated into the developed PBPK model. These include changes in blood flow, organ volume, plasma protein binding, and hematocrit as reported previously (Table 4).18,19 All the studies which were selected for propranolol-cirrhosis PBPK model verification did not have stratified plasma concentration-time data in different stages of liver cirrhosis (CP-A–C) rather they had a mean plasma concentration-time curve for the overall cirrhosis populations. Only the information on the total number of CP-A, CP-B, and CP-C participants along with their age, weight, height, and gender was available. Therefore, for the model verification process, separate predictions for each CP class were carried out first, and then their mean values were compared with the observed data sets.
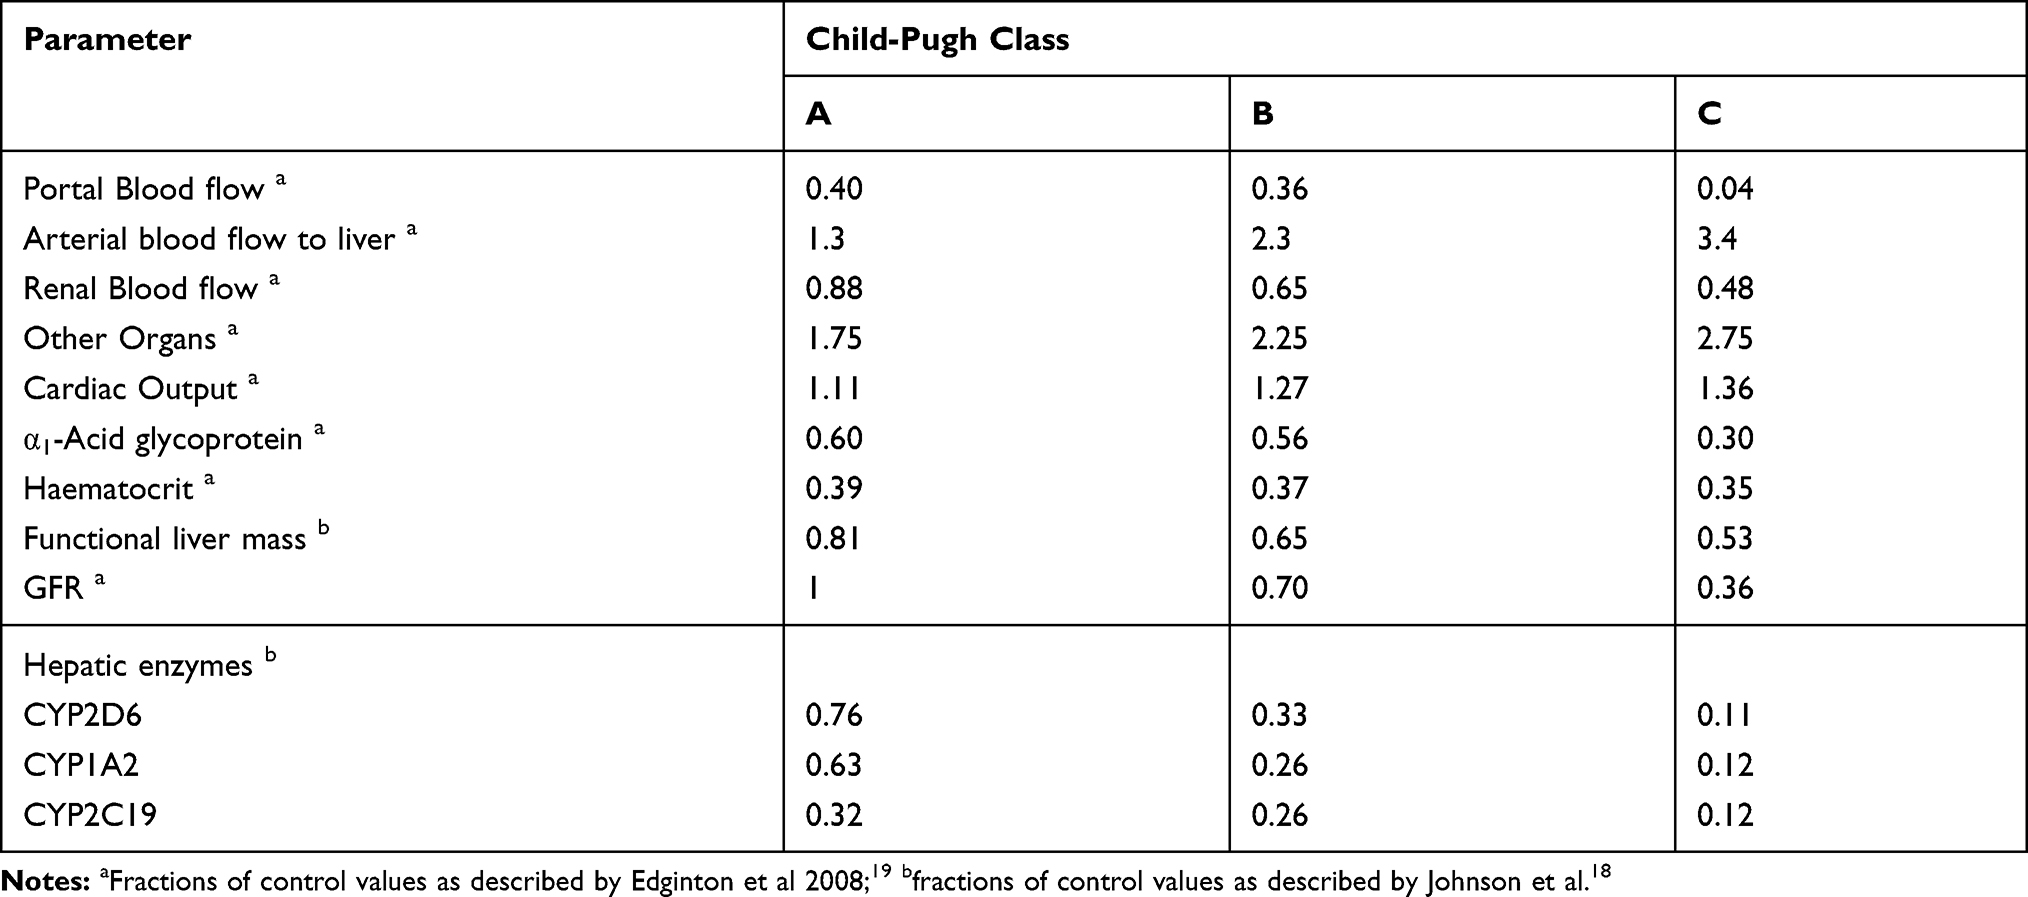 |
Table 4 Fractions of Physiological Changes, Incorporated in the Propranolol-Cirrhosis-PBPK Model |
After successful evaluation of the drug-disease PBPK model of propranolol, it was used for predicting model informed propranolol dosing in different stages of liver cirrhosis (CP-A–C). For this purpose, additional simulations were performed after creating virtual populations of healthy adults and cirrhosis patients (CP-A–C) within the age range of 18–60 years, weight 50–80 kg, and height 150–165 cm. The ranges of these demographic parameters were estimated from the clinical studies used for PBPK model development and verification in healthy populations. Firstly, an oral dose of 40 mg propranolol was administered to both healthy and cirrhosis populations (CP-A–C). Secondly, the dose reductions were suggested based on a comparison of total AUC (AUCtotal) and unbound AUC (AUCunbound) between healthy and cirrhosis (CP-A–C) populations. The administered propranolol doses in cirrhosis populations were gradually reduced until the AUCunbound was comparable between the healthy and cirrhosis (CP-A–C) populations. The results for dose adjustments were presented graphically as box-whisker plots.
Model Appraisal and Verification
The developed PBPK models were appraised by visual verification and by comparison of various pharmacokinetic parameters with observed clinical studies (Table 1). For visual verification, predicted arithmetic mean (AM), 10th–90th percentile, minimum and maximum venous plasma concentration-time curves were compared with the mean plasma concentration-time curves of observed data. The Microsoft Excel add-in PK-Solver® was used for the calculation of various PK parameters of the observed and predicted data by non-compartmental analysis (NCA).42 Ratio of observed versus predicted (Robs./pred.) was used to compare the mean area under plasma concentration-time curve from zero to infinity (AUC0-inf), maximum plasma drug concentration (Cmax), and plasma drug clearance (CL/F) of observed to predicted data with 95% confidence interval (CI). A two-fold error range was considered acceptable for model verification as reported previously.13,14,23,43 The average fold error (AFE) and root mean square error (RMSE) were calculated for further verification of the developed PBPK model.14,44 The box-whisker plots were used to express the drug dosing recommendations in cirrhosis patients (CP-A–C). For this purpose, AUCunbound and AUCtotal of the propranolol in healthy and diseased populations (CP-A–C) were determined. AUCtotal was available in the modeling program output files and AUCunbound was calculated by multiplying Fu of propranolol in the healthy and diseased state with the AUCtotal.45
Results
Healthy Adults
Mean drug-plasma concentration-time curves of observed and simulated data, after intravenous (0.05–0.2 mg/kg, 1–10 mg) and oral (5–160 mg) administration in healthy individuals, are compared in Figure 3. All observed data sets qualify visual verification analysis when compared with mean, 10th–90th percentile, minimum, and maximum simulated concentration curves. The mean Robs./pred. of AUC0-Inf, Cmax, and CL after IV and oral administration, were 1.2 (range: 0.85–1.69, 95% CI 0.9–1.5) and 0.9 (range: 0.61–1.38, 95% CI 0.75–1.05), 0.76 (range: 0.53–1.06, 95% CI 0.58–0.94) and 1.1 (range: 0.6–1.92, 95% CI 0.89–1.31), 0.86 (range: 0.59–1.17, 95% CI 0.64–1.07) and 1.19 (range: 0.72–1.63, 95% CI 1.01–1.38) respectively. All Robs./pred of PK-parameters (AUC0-Inf, Cmax, and CL) were within the two-fold error range (Table 5, Figures 2 and 3). Average fold error (AFE) and root mean square error (RMSE) for predictions of all the doses used for the development and evaluation of the presented propranolol-PBPK are described in Table 5.
 |
Table 5 Mean Observed and Predicted Values of Different Pharmacokinetic Parameters After Intravenous and Oral Administration of Propranolol Among Healthy and Their Ratios (Observed vs Predicted). Average Fold Error (AFE) and Root Mean Square Error (RMSE) of All Predictions of the Developed PBPK Model in Healthy Individuals |
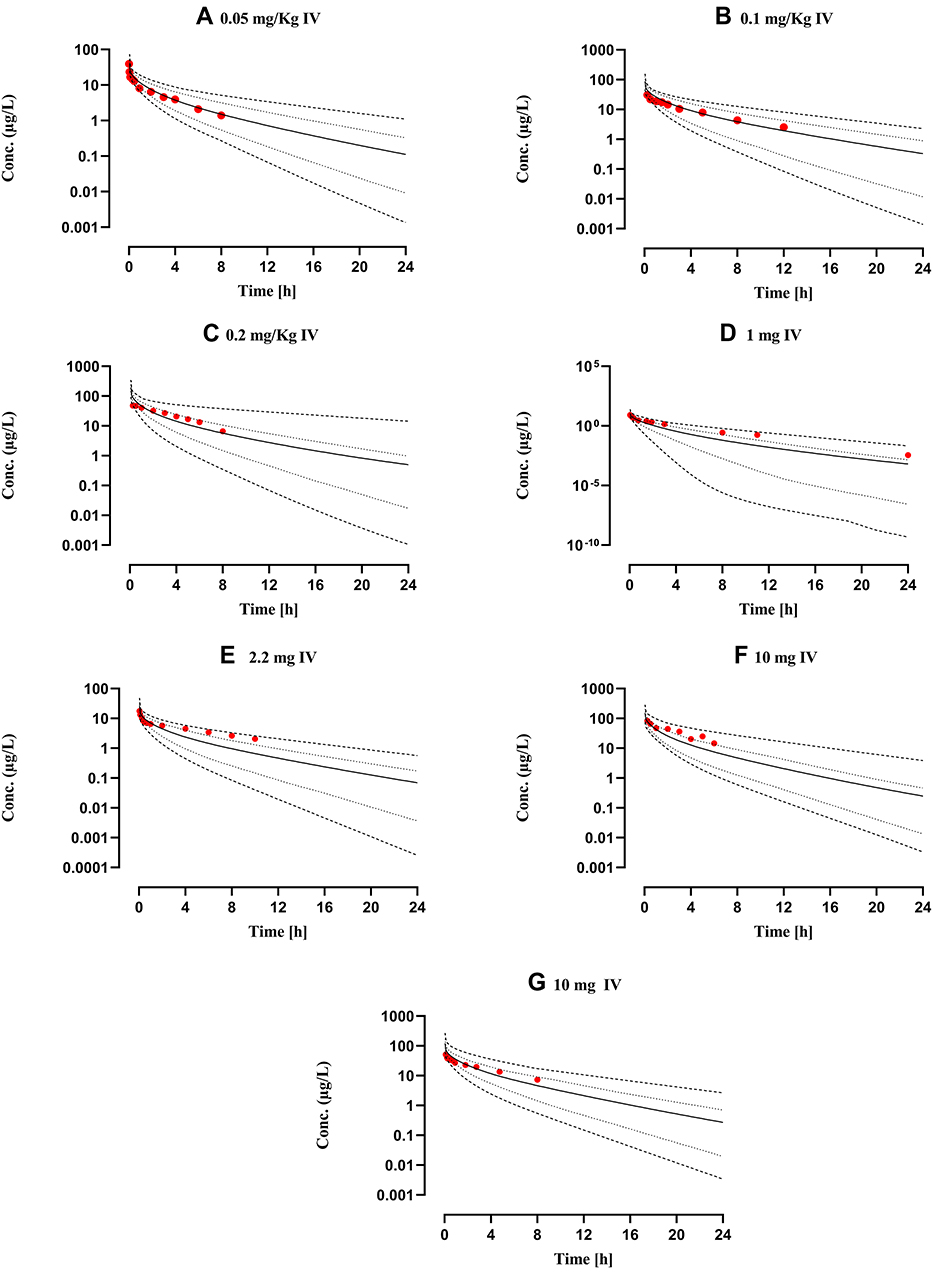 |
Figure 2 Comparison of observed and predicted systemic propranolol plasma concentration versus time profile in healthy subjects after IV dose of (A) 0.05 mg/kg,65 (B) 0.1 mg/kg,66 (C) 0.2 mg/kg,27 (D) 1 mg46 (E) 2.2 mg26 (F) and (G) 10 mg28,47 respectively. Solid line (―) are indicating arithmetic mean, dash line (---------) minimum and maximum concentrations, dotted line (.............) 10th and 90th percentile. |
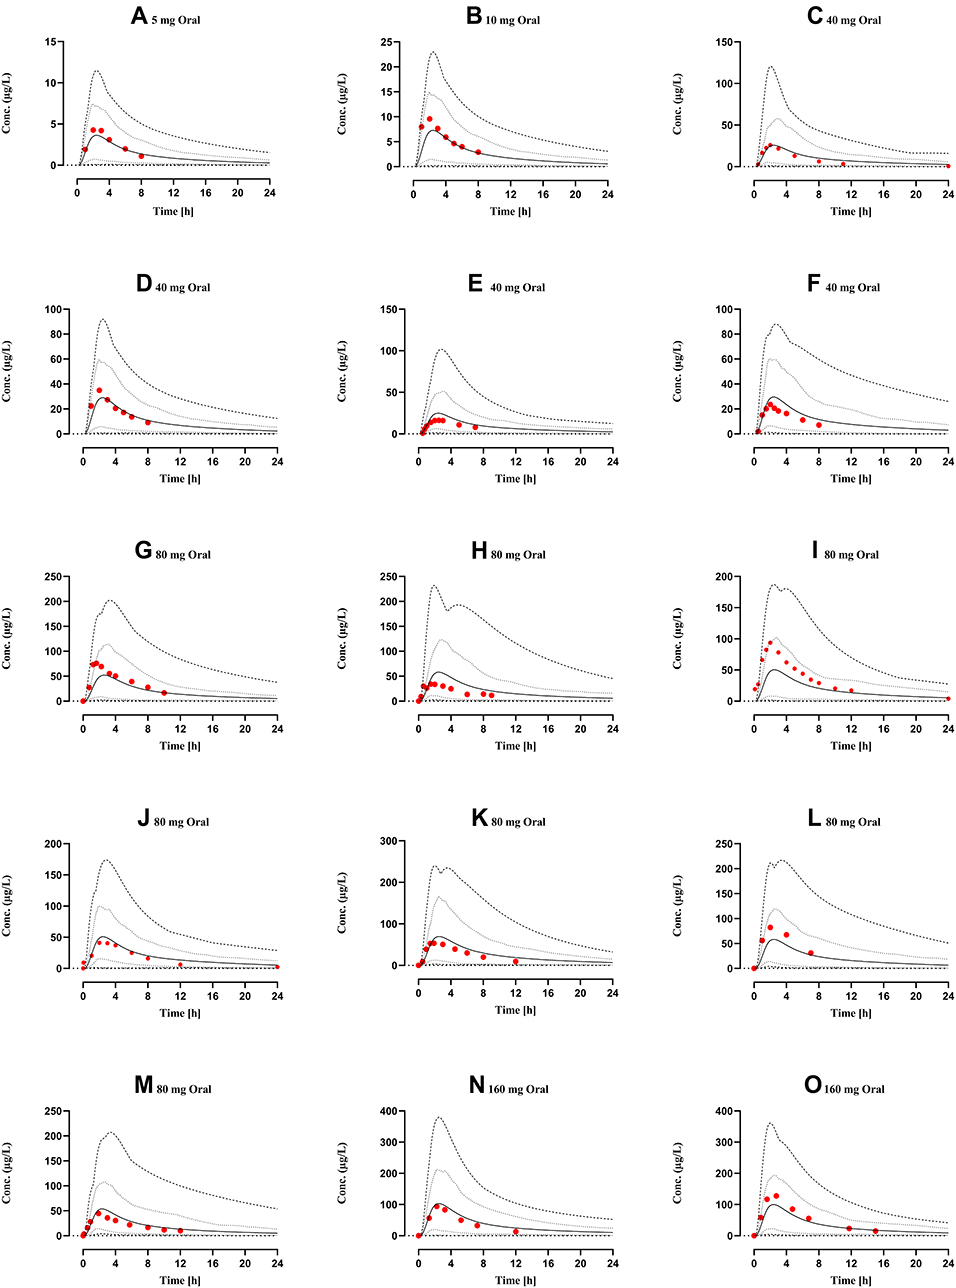 |
Figure 3 Comparison of observed and predicted systemic propranolol plasma concentration versus time profile in healthy subjects after oral dose of (A) 5 mg,29 (B) 10 mg,29 (C–F) 40 mg,29,30,46,48 (G–M) 80 mg26,31,32,49–52 (N) and (O) 160 mg67,68 respectively. Solid line (―) are indicating arithmetic mean, dash line (---------) minimum and maximum concentrations, dotted line (.............) 10th and 90th percentile. |
Liver Cirrhosis Population
The comparison of simulated propranolol plasma concentration-time profiles, after IV doses of 0.4 mg/kg, 1 mg, and oral doses of 40–160 mg, in cirrhotic patients (CPA–C) with the observed data sets showed that the developed model has successfully predicted propranolol PK in liver cirrhosis populations (CP A–C) (Figure 4). The mean ratio (observed/predicted) of AUC0-Inf, Cmax, and CL, after IV and oral administration, were 1.25 (95% CI: 0.9–1.5) and 0.88 (95% CI: 0.75–1.05), 0.72 (95% CI: 0.58–0.94) and 1.0 (95% CI: 0.89–1.31), 0.90 (95% CI: 0.64–1.07) and 0.94 (95% CI: 1.01–1.38) respectively. Average fold error (AFE) and root mean square error (RMSE) for all the model predictions are described in Table 6. All observed vs predicted ratios of PK-parameters (AUC0-Inf, Cmax, and CL) were within the two-fold error range (Table 6, Figure 4).
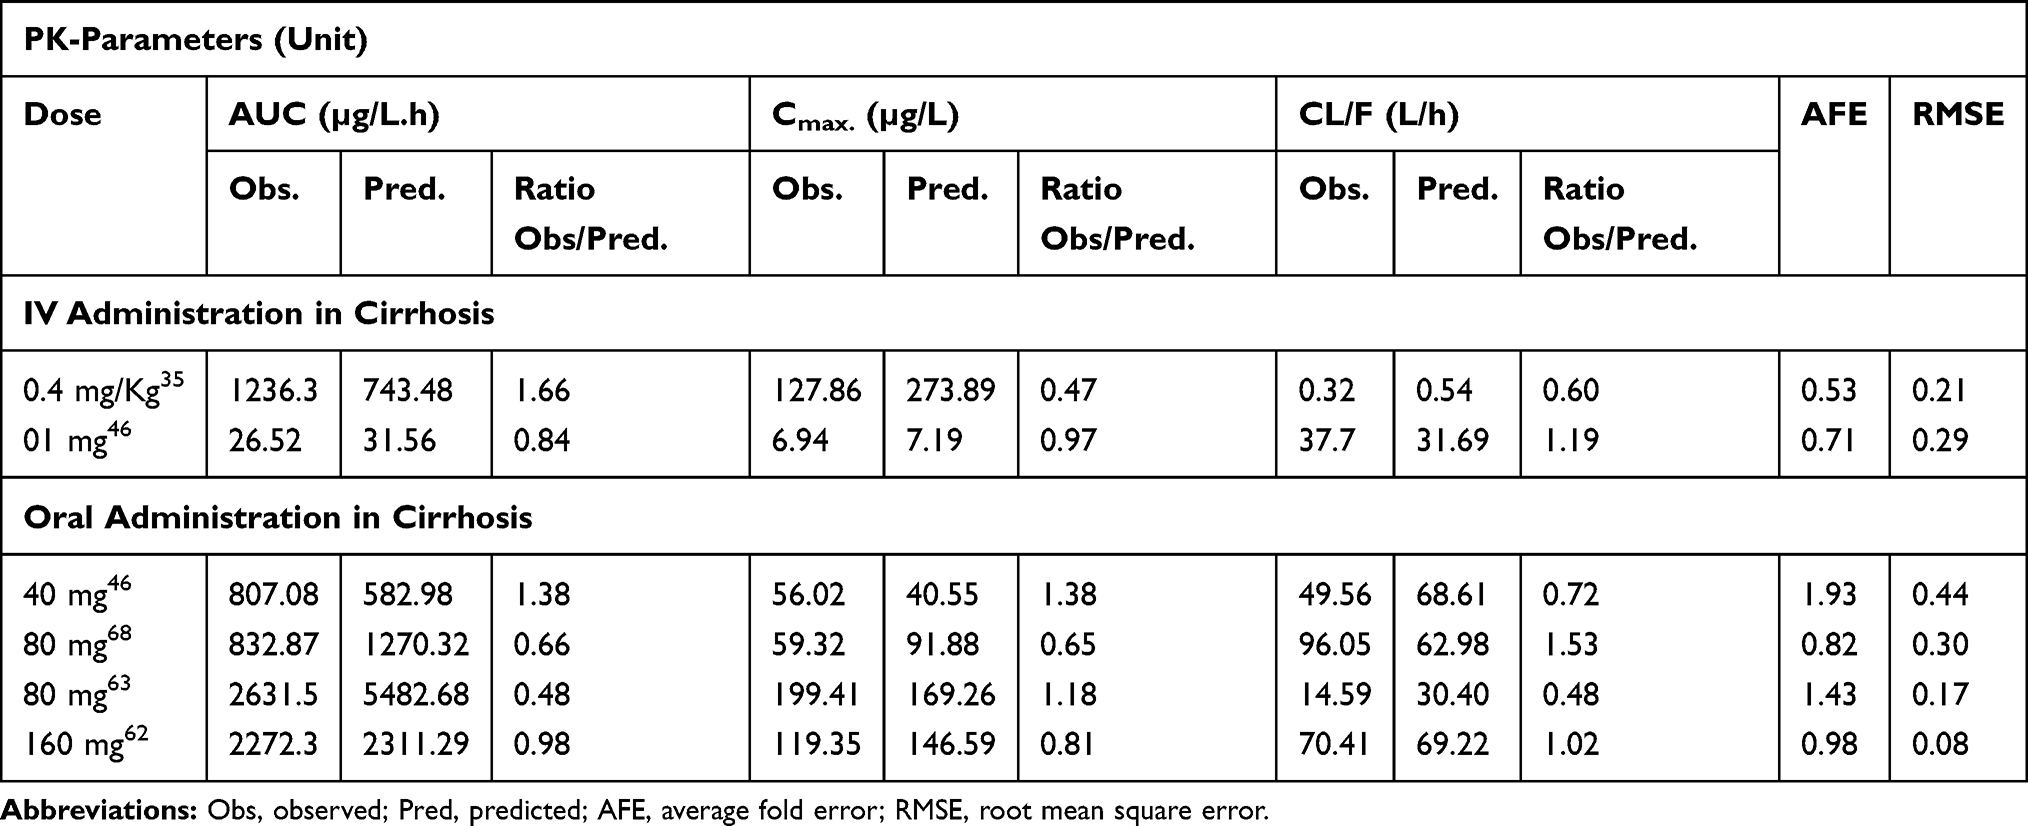 |
Table 6 Mean Observed and Predicted Values of Different Pharmacokinetic Parameters After Intravenous and Oral Administration of Propranolol Among Cirrhosis Populations and Their Ratios (Observed vs Predicted). Average Fold Error (AFE) and Root Mean Square Error (RMSE) of All Predictions of the Developed PBPK Model in Healthy Individuals |
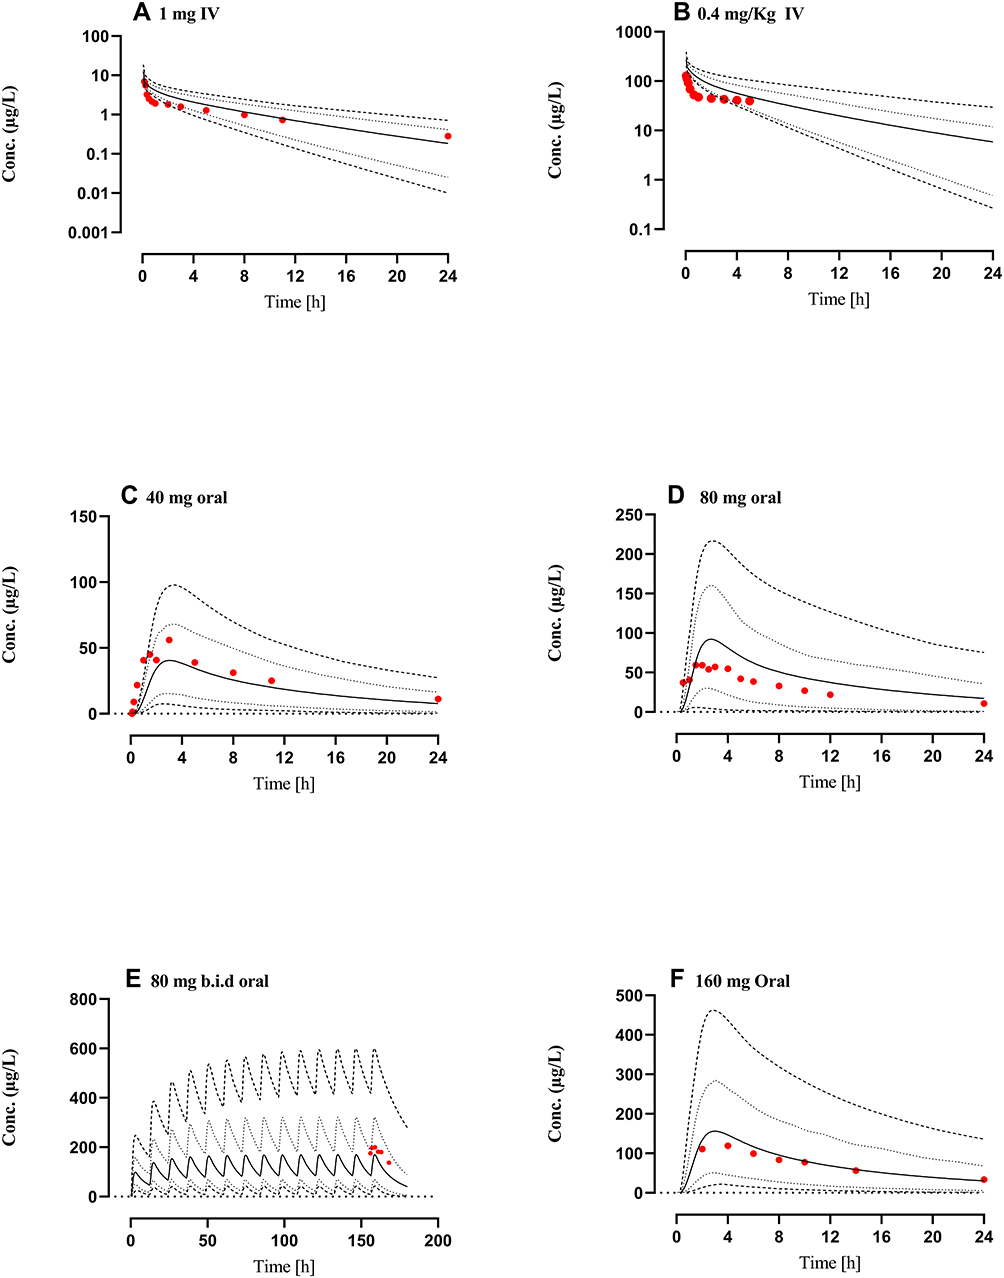 |
Figure 4 Comparison of observed and predicted systemic propranolol plasma concentration versus time profile in Cirrhosis population (CP-A–C) subjects after IV dose of (A) 1 mg46 (B) 0.4 mg/kg,35 an oral dose of (C) 40 mg,46 (D) 80 mg,69 (E) 80 mg twice daily (b.i.d)63 and (F) 160 mg62 respectively. Solid line (―) indicating Arithmetic mean, dash line (---------) minimum and maximum concentrations, dotted line (................) 10th and 90th percentile. |
Propranolol Dose Optimization in Cirrhosis
In comparison to the healthy adults, a 3, 9, and 10 fold increase in the AUCtotal and 5, 14, and 27 fold increase in AUCunbound was observed in CP-A, CP-B, and CP-C populations after administering 40 mg oral propranolol (Figure 5A and B). To have similar propranolol exposure (AUCtotal) in healthy and cirrhosis populations (CP-A–C) after administering 40 mg oral propranolol, the dose of propranolol was decreased up to 20% (8 mg), 10% (4 mg), and 5% (2 mg) in CP-A, CP-B and CP-C populations respectively (Figure 5C). This decrease in administered propranolol dose in cirrhosis populations (CP-A–C) was not able to keep the AUCunbound comparable with the healthy population (Figure 5D). Therefore, the administered propranolol doses were further reduced by 25% (8 mg to 6 mg), 50% (4 mg to 2 mg), and 25% (2 mg to 1.5 mg) in CP-A, CP-B, and CP-C populations to make the AUC unbound values comparable between the healthy and cirrhosis populations (CP-A–C) (Figure 5E and F).
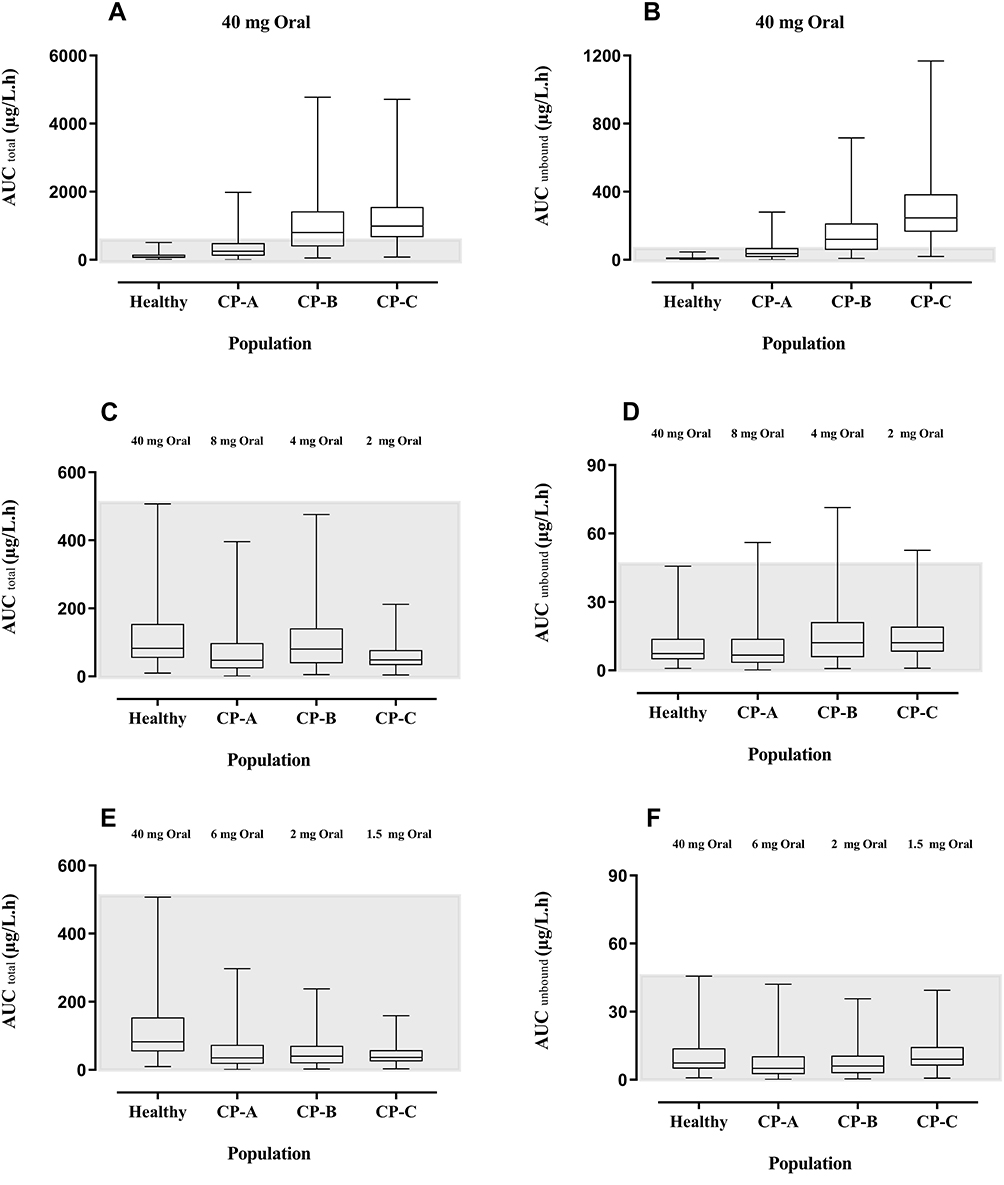 |
Figure 5 Box-Whisker plots compare the AUCtotal and AUCunbound after oral doses of propranolol among healthy, CP-A, CP-B, and CP-C populations. (A) AUCtotal after 40 mg oral dose of propranolol in healthy adults and CP-A–C populations. (B) AUCunbound after 40 mg oral dose of propranolol among healthy adults and CP-A–C populations. (C) AUC total up to 20%, 10%, and 5% reduction in oral doses of propranolol in CP-A, CP-B, and CP-C populations respectively as compared to 40 mg oral dose in the healthy population. (D) AUC unbound up to 20%, 10%, and 5% reduction in oral doses of propranolol in CP-A, CP-B, and CP-C populations respectively as compared to 40 mg oral dose in the healthy population. (E) AUC total after further 25%, 50%, and 25% reduction in oral doses of propranolol among CP-A, CP-B, and CP-C populations respectively (F) after further 25%, 50%, and 25% reduction in oral doses of propranolol among CP-A, CP-B, and CP-C populations respectively. Abbreviations: AUC, area under the curve; CP-A, Child-Pugh class A; CP-B, Child-Pugh class B; CP-C, Child-Pugh class C. |
Discussion
In the presented study, a whole-body PBPK model capable of explaining the propranolol PK after IV and oral administration was developed and evaluated successfully in healthy and cirrhosis populations. Since propranolol is a high protein-bound drug (Alpha-1 acid glycoprotein) and is eliminated primarily by hepatic clearance, therefore, it was important to estimate whether its PK are affected in altered physiological conditions or not. All the model predictions in healthy and cirrhosis populations were comparable to the observed clinical data as ratio obs/pred for all the PK-parameters were within the 2-fold range.
The presented model has effectively described the disposition of propranolol after IV and oral application in healthy populations. This argument can be further verified by comparison of the mean observed clearance (CL) 0.82 L/h/kg (95% CI: 0.64–1.00)26–28,46,47 with mean predicted clearance 0.99 L/h/kg (95% CI: 0.70–1.2) after IV administration. Similarly, CL/F in healthy individuals was also comparable, as its observed and reported values were 217 L/h (95% CI: 183.6–250.80)26,29–33,46,48–52 and 183.3 L/h (95% CI: 169.9–196.6), respectively. Furthermore, the AFE value for CL (0.83 and 1.15 after IV and oral dose predictions) strengthened the argument that the developed PBPK model was predicting the disposition of the drug precisely (Table 4).
The liver is a vital homeostatic organ and every chronic complication of the liver ends in the development of cirrhotic liver, characterized by fibrosis in the parenchyma, nodule formulation, and loss of hepatocytes.53 All these physiological and anatomical changes affect not only the homeostatic functions of the liver but also develop serious and sometimes fatal complications.53 Inter-hepatic resistance to blood flow demonstrates the development of portal hypertension which is further responsible for gastroesophageal variceal bleeding.19 Reduction in functional liver size, hepatic arterial blood flow, gut and liver CYP enzyme expression, hepatic extraction ratio, glomerular filtration rate, cardiac output, albumin, and alpha-1 acid glycoprotein concentrations, blood flow to portal vein and villi were anatomical and physiological changes associated with liver cirrhosis and can severely affect the exposure of the administered drug.18 Despite all these anatomical and physiological changes in the liver cirrhosis, the abundance of human UGTs remains unaltered.18,24 The US, Food, and Drug Administration (FDA) and the European Medical Agency (EMA) recommend the evaluation of PK parameters of an administered drug in a liver cirrhosis population based on the disease severity (CP-A–C).54,55
Propranolol has a high hepatic extraction ratio and a substrate of liver CYP enzymes (2D6, 2C19, and 1A2)8 therefore an alteration in blood flow (Q(H)) and CYP enzyme activity in liver cirrhosis may have a considerable effect on propranolol disposition.9 Furthermore, the concentration of plasma alpha-1 glycoprotein, a major plasma binding protein for propranolol, has been reduced in liver cirrhosis and an increase in fraction unbound of propranolol is expected.18,56 The developed PBPK model has precisely predicted an increase in plasma drug concentration after administration of the same dose of propranolol in healthy and cirrhosis population (CP A–C). The mean plasma propranolol concentration in the cirrhosis population (CP A–C) was increased proportionally compared to the healthy population as the administered dose was increased (Tables 5 and 6, Figures 3 and 4). A ~3–8 fold increase (9.28 vs 31.56, 156 vs 582.9, 440.6 vs 3376.5 and, 761.4 vs 2311.3) was observed in the AUC0–inf [µg/L.h], after 1 mg IV, 40 mg, 80 mg, and 160 mg of oral dose administration in the cirrhosis population (CP A-C) as compared to the healthy population (Tables 5 and 6). This increase in plasma drug concentration was due to a reduction in the concentration of α-1 acid glycoprotein.57 In liver cirrhosis its concentration is reduced up to 40%, 44%, and 70 in CP-A, CP-B, and CP-C populations respectively,19 therefore, the more unbound drug will be available in plasma. Moreover, reduced portal absorption and portal blood flow to the liver in cirrhosis prevent propranolol from first passed hepatic metabolism. These facts result in a significant increase in unbound plasma drug concentration.58 A recent study compared the efficacy of propranolol with other non-selective beta-blocker (NSBB’s) and accessed that propranolol was equally effective in the prevention of variceal bleeding as other NSBB’s and Its low cost made it a more suitable drug in this indication.59
Propranolol had significantly reduced variceal re-bleeding in cirrhosis patients4 and recommended for pre, primary and secondary prophylaxis of cirrhotic variceal bleeding.3 At the same time, it significantly reduced PVV which is a major cause of PVT, an adverse outcome of liver cirrhosis.5 In a recent meta-analysis, a significant association was found between the use of NSBB’s in cirrhosis and the development of PVT.5 It was evident that with progressive stages of liver cirrhosis retention of unbound drug in the plasma increased which may result in the prognosis of PVT in the severe stage of liver cirrhosis (CP-C population).60 An additional care and dose adjustment will be required in this indication to avoid this life-threatening situation. It was also evident from the evaluation of the developed PBPK drug-disease model that clearance of propranolol is much lower in progressive stages of liver cirrhosis and plasma concentration of drug increases with the progression in severity of disease ie from CP-A to CP-C population.
The use of propranolol in cirrhosis is established since long61 and in the reported clinical trials, the same dose of propranolol had been administered to all cirrhosis patients irrespective of the severity of the disease.35,46,58,62,63 Moreover, there was no clear information available that can explain its exposure in various stages of liver cirrhosis (CP-A–C) rather than a mean population plasma concentration curves of all types of cirrhosis patients were reported. The developed drug-disease model was used to predict the exposure of propranolol in healthy, CP-A, CP-B and, CP-C cirrhosis populations after administration of the same (40 mg) oral dose of propranolol (Figure 5A). Total exposure in CP-A, CP-B, and CP-C populations was ~ 3–10 fold greater as compared to the healthy population (Figure 5A). The concentration of unbound fraction of propranolol is ~ 5–27 folds more than the healthy population (Figure 5B). It is evident from the box plots (Figure 5C) that oral administration of 8 mg, 4 mg, and 2 mg propranolol among CP-A, CP-B, and CP-C populations have a similar AUCtotal as in healthy population after the oral administration of 40 mg of propranolol. At the same time on these optimized doses, AUCunbound of propranolol is still 1.5 folds greater in CP-B and CP-C as compared to the healthy population (Figure 5D). We may have to optimize the unbound concentration of the drug by a further, 8 mg to 6 mg, 4 mg to 2 mg, and 2 mg to 1.5 mg, reduction in the oral dose of propranolol in CP-A, CP-B, and CP-C populations respectively (Figure 5F). These model informed drug dosing predictions can serve as a tool to prevent PVT in moderate to severe cirrhosis patients.
Limitations
Observed data, which was used for the development and evaluation of this model, was extracted from published plasm concentration-time curves by using GetData Graph Digitizer® V.2.26.0. Although this data was not obtained directly from the researchers but calculated PK parameters based upon these extracted data points were similar to reported PK parameters. All other PK parameters were calculated by NCA and for convenience in calculations of AUC time points of observed data were rounded off. There was no mechanism reported to avoid these minor adjustments.
This model has extensively explained the PK of propranolol in different oral and IV doses in both genders, but only immediate released formulations of propranolol were considered for the development and evaluation PBPK model. Further appraisal of this model can be done with sustained-release formulations.
Specific intestinal permeability in the program is calculated from the molecular weight and lipophilicity of the drug64 and for the development of this model, absorption of propranolol was calculated by using this global feature of the modeling program.37 For the successful development and accurate prediction of the PBPK model, further parameter identifications were carried out and an optimized value of intestinal permeability was used. This value was different from the reported literature values of intestinal permeability of propranolol calculated by other methods.64
To explain the clearance of propranolol, the contribution of CYP enzymes was considered which was 82.4%. The contribution of UDP glucuronosyltransferases was 17.6% and a very minor amount of the drug was eliminated by renal excretion. The exact contribution of UDP glucuronosyltransferase was uncertain. Therefore, we assigned this additional 17.6% drug clearance to whole hepatic clearance in the modeling program for the development of the model. The exact method of this additional clearance may affect the predictability of this developed model. In addition to this intrinsic clearance by CYP2D6, CYP1A2 and CYP2C19 were calculated by using back-calculation of the well-stirred model (see methodology). Average values of different anatomical and physiological input parameters were used to get accurate predictions of the model.
Conclusion
The presented propranolol PBPK model successfully explained the pharmacokinetics of propranolol after IV (0.05–0.2 mg/kg. 1–10 mg) and oral (5–160 mg) administration of propranolol in a healthy population of both genders and different ethnicities. The predictive ability of the drug-disease model was well evaluated by the incorporation of human liver cirrhosis related pathophysiological changes in the developed drug-disease PBPK model. This propranolol-cirrhosis PBPK model has successfully applied in drug dosing predictions of propranolol in different stages of disease severity (CP-A–C) which could have significant clinical application in the prevention of PVT among cirrhosis patients who were taking propranolol for the treatment of variceal bleeding and portal hypertension.
Acknowledgment
The authors extended their appreciation to the Distinguished Scientist Fellowship program at King Saud University, Riyadh, Saudi Arabia for funding this work through Research Supporting Project Number (RSP-2020/131).
Funding
This work was funded by the Distinguished Scientist Fellowship program at King Saud University, Riyadh, Saudi Arabia through research supporting project Number (RSP-2020/131).
Disclosure
The authors indicate that they have no conflicts of interest in this work.
References
1. Akbar S, Alorainy MS. The current status of beta blockers’ use in the management of hypertension. Saudi Med J. 2014;35(11):1307–1317.
2. Kalam MN, Rasool MF, Rehman AU, Ahmed N. Clinical pharmacokinetics of propranolol hydrochloride: a review. Curr Drug Metab. 2020;21(2):89–105. doi:10.2174/1389200221666200414094644
3. de Franchis R. Revising consensus in portal hypertension: report of the Baveno V consensus workshop on methodology of diagnosis and therapy in portal hypertension. J Hepatol. 2010;53(4):762–768. doi:10.1016/j.jhep.2010.06.004
4. Lebrec D, Poynard T, Hillon P, Benhamou J-P. Propranolol for prevention of recurrent gastrointestinal bleeding in patients with cirrhosis: a controlled study. N Engl J Med. 1981;305(23):1371–1374. doi:10.1056/NEJM198112033052302
5. Xu X, Guo X, De Stefano V, et al. Nonselective beta-blockers and development of portal vein thrombosis in liver cirrhosis: a systematic review and meta-analysis. Hepatol Int. 2019:1–14. doi:10.1007/s12072-018-09923-2
6. Nies AS, Shand DG. Clinical pharmacology of propranolol. Circulation. 1975;52(1):6–15. doi:10.1161/01.CIR.52.1.6
7. Sten T, Qvisen S, Uutela P, Luukkanen L, Kostiainen R, Finel M. Prominent but reverse stereoselectivity in propranolol glucuronidation by human UDP-glucuronosyltransferases 1A9 and 1A10. Drug Metab Dispos. 2006;34(9):1488–1494. doi:10.1124/dmd.106.010371
8. Paterson J, Conolly M, Dollery C, Hayes A, Cooper R. The pharmacodynamics and metabolism of propranolol in man. Pharmacologia Clinica. 1970;2(3):127–133. doi:10.1007/BF00420338
9. Kornhauser D, Wood A, Vestal R, Wilkinson G, Branch R, Shand D. Biological determinants of propranolol disposition in man. Clin Pharmacol Ther. 1978;23(2):165–174. doi:10.1002/cpt1978232165
10. Avram MJ, Krejcie TC, Henthorn TK, Niemann CU. Beta-adrenergic blockade affects initial drug distribution due to decreased cardiac output and altered blood flow distribution. J Pharmacol Exp Ther. 2004;311(2):617–624. doi:10.1124/jpet.104.070094
11. Rasool MF, Khalil F, Laer S. A physiologically based pharmacokinetic drug-disease model to predict carvedilol exposure in adult and paediatric heart failure patients by incorporating pathophysiological changes in hepatic and renal blood flows. Clin Pharmacokinet. 2015;54(9):943–962. doi:10.1007/s40262-015-0253-7
12. Rasool MF, Khalid R, Imran I, et al. Investigating the role of altered systemic albumin concentration on the disposition of theophylline in adult and pediatric patients with asthma by using the physiologically based pharmacokinetic approach. Drug Metab Dispos. 2020;48(7):570–579. doi:10.1124/dmd.120.090969
13. Kovar L, Schräpel C, Selzer D, et al. Physiologically-based pharmacokinetic (PBPK) modeling of buprenorphine in adults, children and preterm neonates. Pharmaceutics. 2020;12(6):578. doi:10.3390/pharmaceutics12060578
14. Rasool MF, Khalid S, Majeed A. Development and evaluation of physiologically based pharmacokinetic drug-disease models for predicting rifampicin exposure in tuberculosis and cirrhosis populations. Pharmaceutics. 2019;11(11):578. doi:10.3390/pharmaceutics11110578
15. Cui C, Sia Jie En V, Tu S, et al. Development of a physiologically based pharmacokinetic (PBPK) population model for Chinese elderly subjects. Br J Clin Pharmacol. 2020. doi:10.1111/bcp.14609
16. Srinivasan A. Propranolol: a 50-year historical perspective. Ann Indian Acad Neurol. 2019;22(1):21. doi:10.4103/aian.AIAN_201_18
17. Khalil F, Laer S. Physiologically based pharmacokinetic models in the prediction of oral drug exposure over the entire pediatric age range-sotalol as a model drug. AAPS J. 2014;16(2):226–239. doi:10.1208/s12248-013-9555-6
18. Johnson TN, Boussery K, Rowland-Yeo K, Tucker GT, Rostami-Hodjegan A. A semi-mechanistic model to predict the effects of liver cirrhosis on drug clearance. Clin Pharmacokinet. 2010;49(3):189–206. doi:10.2165/11318160-000000000-00000
19. Edginton AN, Willmann S. Physiology-based simulations of a pathological condition. Clin Pharmacokinet. 2008;47(11):743–752. doi:10.2165/00003088-200847110-00005
20. Levitt DG. PKQuest: a general physiologically based pharmacokinetic model. Introduction and application to propranolol. BMC Clin Pharmacol. 2002;2:5. doi:10.1186/1472-6904-2-5
21. Kiriyama A, Honbo A, Iga K. Analysis of hepatic metabolism affecting pharmacokinetics of propranolol in humans. Int J Pharm. 2008;349(1–2):53–60. doi:10.1016/j.ijpharm.2007.07.019
22. Rose RH, Turner DB, Neuhoff S, Jamei M. Incorporation of the time-varying postprandial increase in splanchnic blood flow into a PBPK model to predict the effect of food on the pharmacokinetics of orally administered high-extraction drugs. Aaps j. 2017;19(4):1205–1217. doi:10.1208/s12248-017-0099-z
23. Zhang M, You X, Ke M, et al. Prediction of ticagrelor and its active metabolite in liver cirrhosis populations using a physiologically based pharmacokinetic model involving pharmacodynamics. J Pharm Sci. 2019;108(8):2781–2790. doi:10.1016/j.xphs.2019.03.028
24. Rasool MF, Khalil F, Läer S. Optimizing the clinical use of carvedilol in liver cirrhosis using a physiologically based pharmacokinetic modeling approach. Eur J Drug Metab Pharmacokinet. 2017;42(3):383–396. doi:10.1007/s13318-016-0353-2
25. Li R, Barton HA, Maurer TS. A mechanistic pharmacokinetic model for liver transporter substrates under liver cirrhosis conditions. CPT Pharmacometrics Syst Pharmacol. 2015;4(6):338–349.
26. Cid E, Mella F, Lucchini L, Carcamo M, Monasterio J. Plasma concentrations and bioavailability of propranolol by oral, rectal, and intravenous administration in man. Biopharm Drug Dispos. 1986;7(6):559–566. doi:10.1002/bdd.2510070605
27. Wilson TW, Firor WB, Johnson GE, et al. Timolol and propranolol: bioavailability, plasma concentrations, and beta blockade. Clin Pharmacol Ther. 1982;32(6):676–685. doi:10.1038/clpt.1982.223
28. Regardh CG, Johnsson G, Jordo L, Lungborg P, Persson BA, Ronn O. Plasma concentrations and beta-blocking effects in normal volunteers after intravenous doses of metoprolol and propranolol. J Cardiovasc Pharmacol. 1980;2(6):715–723. doi:10.1097/00005344-198011000-00002
29. Mould GP, Clough J, Morris BA, Stout G, Marks V. A propranolol radioimmunoassay and its use in the study of its pharmacokinetics following low doses. Biopharm Drug Dispos. 1981;2(1):49–57. doi:10.1002/bdd.2510020106
30. Greenblatt DJ, Scavone JM, Harmatz JS, Engelhardt N, Shader RI. Cognitive effects of beta-adrenergic antagonists after single doses: pharmacokinetics and pharmacodynamics of propranolol, atenolol, lorazepam, and placebo. Clin Pharmacol Ther. 1993;53(5):577–584. doi:10.1038/clpt.1993.73
31. Roscoe R, Cooper J, Wilson TW, Joshi NN, Midha KK. The relative bioavailability of a commercial propranolol hydrochloride tablet in man. Biopharm Drug Dispos. 1982;3(2):105–114. doi:10.1002/bdd.2510030204
32. Giudicelli JF, Richer C, Chauvin M, Idrissi N, Berdeaux A. Comparative beta-adrenoceptor blocking effects and pharmacokinetics of penbutolol and propranolol in man. Br J Clin Pharmacol. 1977;4(2):135–140. doi:10.1111/j.1365-2125.1977.tb00684.x
33. Huang SM, Weintraub HS, Marriott TB, Marinan B, Abels R. Etintidine-propranolol interaction study in humans. J Pharmacokinet Biopharm. 1987;15(6):557–568. doi:10.1007/BF01068412
34. Angermayr B, Cejna M, Karnel F, et al. Child-pugh versus MELD score in predicting survival in patients undergoing transjugular intrahepatic portosystemic shunt. Gut. 2003;52(6):879–885. doi:10.1136/gut.52.6.879
35. Pessayre D, Lebrec D, Descatoire V, Peignoux M, Benhamou JP. Mechanism for reduced drug clearance in patients with cirrhosis. Gastroenterology. 1978;74(3):566–571. doi:10.1016/0016-5085(78)90297-4
36. Kostewicz ES, Aarons L, Bergstrand M, et al. PBPK models for the prediction of in vivo performance of oral dosage forms. Eur J Pharm Sci. 2014;57:300–321.
37. Schlender J-F, Teutonico D, Coboeken K, et al. A physiologically-based pharmacokinetic model to describe ciprofloxacin pharmacokinetics over the entire span of life. Clin Pharmacokinet. 2018;57(12):1613–1634. doi:10.1007/s40262-018-0661-6
38. Vogelpoel H, Welink J, Amidon G, et al. Biowaiver monographs for immediate release solid oral dosage forms based on biopharmaceutics classification system (BCS) literature data: verapamil hydrochloride, propranolol hydrochloride, and atenolol. J Pharm Sci. 2004;93(8):1945–1956. doi:10.1002/jps.20131
39. Takamatsu N, Welage LS, Idkaidek NM, et al. Human intestinal permeability of piroxicam, propranolol, phenylalanine, and PEG 400 determined by jejunal perfusion. Pharm Res. 1997;14(9):1127–1132. doi:10.1023/A:1012134219095
40. Wilkinson GR, Shand DG. Commentary: a physiological approach to hepatic drug clearance. Clin Pharmacol Ther. 1975;18(4):377–390. doi:10.1002/cpt1975184377
41. Emoto C, Murase S, Iwasaki K. Approach to the prediction of the contribution of major cytochrome P450 enzymes to drug metabolism in the early drug-discovery stage. Xenobiotica. 2006;36(8):671–683. doi:10.1080/00498250600709778
42. Zhang Y, Huo M, Zhou J, Xie S. PKSolver: an add-in program for pharmacokinetic and pharmacodynamic data analysis in microsoft excel. Comput Methods Programs Biomed. 2010;99(3):306–314. doi:10.1016/j.cmpb.2010.01.007
43. T’jollyn H, Vermeulen A, Van Bocxlaer J. Pbpk and its virtual populations: the impact of physiology on pediatric pharmacokinetic predictions of tramadol. AAPS J. 2019;21(1):8. doi:10.1208/s12248-018-0277-7
44. Pierrillas PB, Henin E, Ball K, et al. Prediction of human nonlinear pharmacokinetics of a new Bcl-2 inhibitor using PBPK modeling and interspecies extrapolation strategy. Drug Metab Dispos. 2019;47(6):648–656. doi:10.1124/dmd.118.085605
45. Minami H, Kawada K, Sasaki Y, et al. Pharmacokinetics and pharmacodynamics of protein‐unbound docetaxel in cancer patients. Cancer Sci. 2006;97(3):235–241. doi:10.1111/j.1349-7006.2006.00166.x
46. Taegtmeyer AB, Haschke M, Tchambaz L, et al. A study of the relationship between serum bile acids and propranolol pharmacokinetics and pharmacodynamics in patients with liver cirrhosis and in healthy controls. PLoS One. 2014;9(6):e97885. doi:10.1371/journal.pone.0097885
47. Sandle GI, Ward A, Rawlins MD, Record CO. Propranolol absorption in untreated coeliac disease. Clin Sci. 1982;63(1):81–85. doi:10.1042/cs0630081
48. Levine MA, Ogilvie RI, Leenen FH. Pharmacokinetic and pharmacodynamic interactions between nisoldipine and propranolol. Clin Pharmacol Ther. 1988;43(1):39–48. doi:10.1038/clpt.1988.9
49. Williams FM, Leeser JE, Rawlins MD. Pharmacodynamics and pharmacokinetics of single doses of ketanserin and propranolol alone and in combination in healthy volunteers. Br J Clin Pharmacol. 1986;22(3):301–308. doi:10.1111/j.1365-2125.1986.tb02891.x
50. Shaw-Stiffel TA, Walker SE, Ogilvie RI, Leenen FH. Pharmacokinetic and pharmacodynamic interactions during multiple-dose administration of nisoldipine and propranolol. Clin Pharmacol Ther. 1994;55(6):661–669. doi:10.1038/clpt.1994.83
51. Schoors DF, Vercruysse I, Musch G, Massart DL, Dupont AG. Influence of nicardipine on the pharmacokinetics and pharmacodynamics of propranolol in healthy volunteers. Br J Clin Pharmacol. 1990;29(5):497–501. doi:10.1111/j.1365-2125.1990.tb03671.x
52. Salazar DE, Marathe PH, Fulmor IE, Lee JS, Raymond RH, Uderman HD. Pharmacokinetic and pharmacodynamic evaluation during coadministration of nefazodone and propranolol in healthy men. J Clin Pharmacol. 1995;35(11):1109–1118. doi:10.1002/j.1552-4604.1995.tb04035.x
53. Schuppan D, Afdhal NH. Liver cirrhosis. Lancet. 2008;371(9615):838–851. doi:10.1016/S0140-6736(08)60383-9
54. Zhao P. Report from the EMA workshop on qualification and reporting of physiologically based pharmacokinetic (PBPK) modeling and simulation. CPT Pharmacometrics Syst Pharmacol. 2017;6(2):71–72.
55. Wagner C, Zhao P, Pan Y, et al. Application of physiologically based pharmacokinetic (PBPK) modeling to support dose selection: report of an FDA public workshop on PBPK. CPT Pharmacometrics Syst Pharmacol. 2015;4(4):226–230.
56. Routledge P. The plasma protein binding of basic drugs. Br J Clin Pharmacol. 1986;22(5):499–506. doi:10.1111/j.1365-2125.1986.tb02927.x
57. Piafsky KM. Disease-induced changes in the plasma binding of basic drugs. Clin Pharmacokinet. 1980;5(3):246–262. doi:10.2165/00003088-198005030-00004
58. Arthur M, Tanner A, Patel C, Wright R, Renwick A, George C. Pharmacology of propranolol in patients with cirrhosis and portal hypertension. Gut. 1985;26(1):14–19. doi:10.1136/gut.26.1.14
59. Sharma S, Agarwal S, Gunjan D, et al. Long-term outcomes with carvedilol versus propranolol in patients with index variceal bleed: 6-year follow-up study. J Clin Exp Hepatol. 2020. doi:10.1016/j.jceh.2020.08.009
60. Mohammed BS, Aidoo M. Drug treatment of patients with liver cirrhosis in a tertiary hospital in Northern Ghana: does it comply with recommended guidelines? Int J Hepatol. 2020;2020:1–7. doi:10.1155/2020/9750194
61. Pascal J-P, Cales P; Group* AMS. Propranolol in the prevention of first upper gastrointestinal tract hemorrhage in patients with cirrhosis of the liver and esophageal varices. N Engl J Med. 1987;317(14):856–861. doi:10.1056/NEJM198710013171403
62. Cales P, Grasset D, Ravaud A, et al. Pharmacodynamic and pharmacokinetic study of propranolol in patients with cirrhosis and portal hypertension. Br J Clin Pharmacol. 1989;27(6):763–770. doi:10.1111/j.1365-2125.1989.tb03438.x
63. Watson RG, Bastain W, Larkin KA, Hayes JR, McAinsh JA, Shanks RG. A comparative pharmacokinetic study of conventional propranolol and long acting preparation of propranolol in patients with cirrhosis and normal controls. Br J Clin Pharmacol. 1987;24(4):527–535. doi:10.1111/j.1365-2125.1987.tb03207.x
64. Kuepfer L, Niederalt C, Wendl T, et al. Applied concepts in PBPK modeling: how to build a PBPK/PD model. CPT Pharmacometrics Syst Pharmacol. 2016;5(10):516–531.
65. Fagan TC, Walle T, Walle UK, Conradi EC, Harmon G, Gaffney TE. Early kinetics of intravenous propranolol. Br J Clin Pharmacol. 1982;13(4):571–574. doi:10.1111/j.1365-2125.1982.tb01424.x
66. Olanoff LS, Walle T, Cowart TD, Walle UK, Oexmann MJ, Conradi EC. Food effects on propranolol systemic and oral clearance: support for a blood flow hypothesis. Clin Pharmacol Ther. 1986;40(4):408–414. doi:10.1038/clpt.1986.198
67. McAinsh J, Baber N, Smith R. Pharmacokinetic and pharmacodynamic studies with long‐acting propranolol. Br J Clin Pharmacol. 1978;6(2):115–121. doi:10.1111/j.1365-2125.1978.tb00835.x
68. Zaky S, Fouad EA, Kotb HI. The effect of rectal ozone on the portal vein oxygenation and pharmacokinetics of propranolol in liver cirrhosis (a preliminary human study). Br J Clin Pharmacol. 2011;71(3):411–415. doi:10.1111/j.1365-2125.2010.03851.x
69. McFarland JW, Avdeef A, Berger CM, Raevsky OA. Estimating the water solubilities of crystalline compounds from their chemical structures alone. J Chem Inf Comput Sci. 2001;41(5):1355–1359. doi:10.1021/ci0102822
70. Poulin P, Theil FP. Prediction of pharmacokinetics prior to in vivo studies. 1. Mechanism-based prediction of volume of distribution. J Pharm Sci. 2002;91(1):129–156. doi:10.1002/jps.10005
71. Kokate A, Li X, Jasti B. Effect of drug lipophilicity and ionization on permeability across the buccal mucosa: a technical note. AAPS PharmSciTech. 2008;9(2):501–504. doi:10.1208/s12249-008-9071-7
72. Taylor E, Turner P. The distribution of propranolol, pindolol and atenolol between human erythrocytes and plasma. Br J Clin Pharmacol. 1981;12(4):543–548. doi:10.1111/j.1365-2125.1981.tb01263.x
73. Choi G-W, Lee Y-B, Cho H-Y. Interpretation of non-clinical data for prediction of human pharmacokinetic parameters: in vitro-in vivo extrapolation and allometric scaling. Pharmaceutics. 2019;11(4):168. doi:10.3390/pharmaceutics11040168
74. McAinsh J, Baber NS, Holmes BF, Young J, Ellis SH. Bioavailability of sustained release propranolol formulations. Biopharm Drug Dispos. 1981;2(1):39–48. doi:10.1002/bdd.2510020105
 © 2021 The Author(s). This work is published and licensed by Dove Medical Press Limited. The
full terms of this license are available at https://www.dovepress.com/terms
and incorporate the Creative Commons Attribution
- Non Commercial (unported, 3.0) License.
By accessing the work you hereby accept the Terms. Non-commercial uses of the work are permitted
without any further permission from Dove Medical Press Limited, provided the work is properly
attributed. For permission for commercial use of this work, please see paragraphs 4.2 and 5 of our Terms.
© 2021 The Author(s). This work is published and licensed by Dove Medical Press Limited. The
full terms of this license are available at https://www.dovepress.com/terms
and incorporate the Creative Commons Attribution
- Non Commercial (unported, 3.0) License.
By accessing the work you hereby accept the Terms. Non-commercial uses of the work are permitted
without any further permission from Dove Medical Press Limited, provided the work is properly
attributed. For permission for commercial use of this work, please see paragraphs 4.2 and 5 of our Terms.