Back to Journals » Clinical Interventions in Aging » Volume 13
Developing sarcopenia criteria and cutoffs for an older Caucasian cohort – a strictly biometrical approach
Authors Kemmler W ![]() , von Stengel S, Kohl M
, von Stengel S, Kohl M ![]()
Received 11 March 2018
Accepted for publication 9 May 2018
Published 2 August 2018 Volume 2018:13 Pages 1365—1373
DOI https://doi.org/10.2147/CIA.S167899
Checked for plagiarism Yes
Review by Single anonymous peer review
Peer reviewer comments 2
Editor who approved publication: Dr Richard Walker
Wolfgang Kemmler,1 Simon von Stengel,1 Matthias Kohl2
1Institute of Medical Physics, University of Erlangen-Nürnberg, Erlangen, Germany; 2Department of Medical and Life Sciences, University of Furtwangen, Villingen-Schwenningen, Germany
Background: The aim of this strictly statistical approach was to provide a figure discrimination in a homogeneous cohort that is based on a main component, which includes disability, physical performance, and autonomy parameters.
Methods: We used data of 939 community-dwelling men aged ≥70 years, living in the area of Erlangen-Nürnberg, Germany. Briefly, we conducted a scaled principal component analysis based on criteria related to “physical function”, “disability”, “weakness”, and “autonomy” to identify men who are likely to have sarcopenia as per the recognized sarcopenia criteria. Next, we applied fast-and-frugal decision trees, logistic regression, and classification and regression decision trees to classify men with and without sarcopenia, applying the 5% prevalence rate identified for this cohort by recent studies.
Results: In summary, the best fast-and-frugal decision trees included gait velocity, handgrip strength, and two skeletal muscle mass indices (SMI) – appendicular skeletal muscle mass (ASMM)/body mass index (BMI) and ASMM/height2. Briefly, men below the cutoff point of 1.012 m/s for gait velocity were directly classified as sarcopenic. Faster men with a handgrip strength of >34.5 kg were excluded from further screening, while their weaker peers were assessed for SMI. Firstly, an ASMM/BMI-based exclusion criterion of >0.886 indicates no sarcopenia; while in men with a lower BMI-based SMI, an ASMM/height2 of <7.25 kg/m2 indicates sarcopenia. Of importance, about 72% of the participants can be classified without an SMI assessment.
Conclusion: The present approach that applied recognized sarcopenia criteria and was based on a predominately functional understanding of sarcopenia provided a simple and feasible decision rule for sarcopenia discrimination. In summary, we consider our approach as a strictly biometrical contribution within the development of sarcopenia screening methods. However, our tool needs to be further evaluated to validate its appropriateness to discriminate sarcopenia in this relevant cohort.
Keywords: sarcopenia screening, sarcopenia cutoff points, classification and regression tree, fast-and-frugal decision trees, Caucasian men aged 70+
Introduction
Assessing the prevalence of sarcopenia is a daunting task. Although there is at least a consensus that sarcopenia should be defined by morphometric and functional parameters,1–4 neither the procedure (eg, algorithm or “killer criterion”) nor the components and the corresponding cutoff points are consistent or have a mandatory specification. Most of the present sarcopenia definitions (Asian Working Group for Sarcopenia;1 European Working Group on Sarcopenia in Older People [EWGSOP];2 and International Working Group on Sarcopenia [IWGS]3) refer to consensus conferences and expert panels. More recently, the Foundation of National Institute of Health (FNIH)4 suggested a new approach in that criteria and cutpoints should be calculated by classification and regression tree (CART) analyses that focus on the key criteria “clinically relevant5 or significant6 weakness”. Hereby, the FNIH approach4 focuses on muscle mass as assessed by dual-energy X-ray absorptiometry (DXA)6 and handgrip strength5 predominately assessed by Jamar hand dynamometer. Briefly, CART analysis for grip strength (n=20.847) was applied to identify a cutoff point for mobility impairment (ie, gait speed <0.8 m/s), while CART analysis for low skeletal muscle mass (n=11.270) was based on the corresponding grip strength results. In summary, the analysis suggests two cutoff points for handgrip strength (men: 31.82 and 25.99 kg; women: 19.99 and 15.92 kg). Further, appendicular skeletal muscle mass (ASMM, kg) and ASMM/body mass index (BMI; kg/[kg/m2]) were considered the best discriminators of weakness, each with one cutoff point in men (ASMM: 19.75 kg or ASMM/BMI: 0.789) and one to two (15.02 and 12.09 kg or 0.512) in women. In summary, the FNIH4 recommended applying a cutoff for handgrip strength of 26 kg in men and 16 kg in women and to proceed with the assessment of ASMM with cutoff points of 0.789 in men and 0.512 in women. Although the FNIH approach of sarcopenia is the most scientific one, some limitations might confound its proper application in cohorts of community-dwelling (cdw) Caucasian men. First, there is considerable heterogeneity among the studies cumulatively used for the CART analysis of handgrip strength and ASMM. However, these differences in average BMI (mean value [MV]: 26.0–31.0 kg/m2), Caucasian race (66%–100%), diabetes (9%–23%), cancer (1.0%–29%), and congestive heart failure prevalence (3%–37.4%) as well as gait velocity (MV: 0.7–1.3 m/s), grip strength (MV: 27.6–41.6 kg), and ASMM (MV: 21.6–24.8 kg) cannot be explained by age differences between the corresponding studies. Nevertheless, apart from limitations that might impair the proper transferability of the calculated cutoff points to more homogeneous cohorts, the more pressing need for another sarcopenia approach might be that the FNIH recommendation is based on DXA assessment, which conflicts with the increased application of radiation-free, mobile, and economic segmental multifrequency bio-impedance analysis (DSM-BIA).7
Thus, the aim of the present study was to provide a simple decision rule for sarcopenia discrimination in a homogeneous cohort of Caucasian males that is based on one factor (“main component”) which includes disability, physical performance, and autonomy parameters. Of importance, we used radiation-free DSM-BIA as this enables a valid, reliable, readily easily applicable, and fast assessment of (appendicular) muscle mass8 and is thus being increasingly used in sarcopenia screening.7
Methods
The present project is based on screening data from the Franconian Sarcopenic Obesity (FRANSO) study, a randomized controlled trial that (1) aimed to determine the sarcopenia and Sarcopenic Obesity (SO) prevalence in Northern Bavaria (Franconia) and (2) focused on the effect of whole-body electromyostimulation on SO in cdw males aged 70+ years with SO. The study project was initiated by the Institute of Medical Physics and supported by the Institute of Biomedicine of Aging, University of Erlangen-Nürnberg (FAU), Germany. The study was approved by the Ethics Committee of the FAU (Ethikantrag 67_15b) and the University Data Protection Office. After detailed information, all study participants gave written informed consent. The RCT part of the FRANSO project is registered under ClinicalTrials.gov: NCT2857660.
Participants
The screening period was conducted between February and May 2016 and concentrated on the area of Erlangen-Nürnberg, Northern Bavaria, Germany. The recruitment and eligibility process were reported in detail elsewhere.9 Briefly, using the provided citizen registers, in total 6,800 men aged ≥70 years were contacted by personal letters that already contained the most important eligibility criteria. One thousand forty-five men replied to the letter and were further assessed for eligibility by phone calls. Application of our eligibility criteria 1) male ≥70 years, 2) living independently at home, and 3) no limitation or contraindication for DSM-BIA assessment (eg, missing limbs) led to 987 men being screened.9 Twenty-two non-Caucasian men were assessed but not included in the present analysis, a further 26 men were excluded due to severe and painful osteoarthritis of the knees and hip, thus finally data on 939 cdw males aged 70+ years were included in the analysis.
As reported and discussed in detail in a recent article,9 anthropometric data, family status, lifestyle including physical activity and exercise, number and distribution of diseases, and medication of our cohort reflect corresponding data given for the male German population aged 70+ years.10–12 Handgrip strength13 and gait velocity14 were slightly higher but still consistent with normative data given for comparable male cohorts 70–79 and 80–95 years old. Socioeconomic15 and educational status,16 on the other hand, were slightly more favorable than the average Bavarian and German data.
Measurements
All tests were performed by qualified research assistants using calibrated devices.
Assessment of anthropometric characteristics
Height was measured with a Harpenden stadiometer (Holtain, Crymych, United Kingdom), weight, total and appendicular lean body mass were determined using DSM-BIA (Inbody 770, Biospace Ltd, Seoul, Korea). Using a tetrapolar eight-point tactile electrode system that applied six frequencies (1, 5, 50, 250, 500, and 1,000 kHz), this type of BIA device can determine the impedance of the arms, legs, and trunk separately. Skeletal Muscle Mass Index (SMI) was calculated using two different approaches: 1) ASMM/body height2 (kg/m2)17 and 2) ASMM/BMI.6 Intra Class Correlation (ICC, test–retest) of ASMM was assessed by the Inbody 770 DSM-BIA and was found to be 0.86 in the present male cohort aged 70+ years.
Gait speed
Habitual gait velocity was tested using the 10 m protocol recommended for research.18 Using photo sensors (HL 2–31, Tag Heuer, La Chaux-de-Fonds, Switzerland) for a precise assessment of the time needed, participants had to start in an upright position 3 m before the first sensor, start walking, and stop 2 m after the second sensor. This approach ensures a steady-state speed for at least 10 m. Tests were performed twice with regular shoes without any specific walking aids. The standardized instruction to the participants was “walk at a speed just as if you were walking along the street to go to the shops”. The MV of the two trials was included in the analysis.
Handgrip strength
After adjusting the grip width to the hand size of the participant, handgrip strength was tested three times each for the dominant and nondominant hands using a Jamar dynamometer (Sammons Preston Inc., Bolingbrook, IL, USA). Tests were performed in an upright standing position with arms extended down by the side.19 The standardized instruction to the participants was consistently “squeeze as strongly as possible”. The MV of the three trials for the dominant hand was used for further calculations.
Questionnaires and interviews
Prior to the tests, participants were requested to list their medication and diseases in order to generate completeness and accuracy of the questionnaire. Subsequently, records were checked by research assistants together with the participants after conducting the tests described above. General characteristics, medication, diseases, and lifestyle (including physical activity and exercise)20,21 were determined using a standardized questionnaire completed by the participants during the visit to our lab.
Of specific importance for this contribution, we also assessed “disability”, “self-rated physical fitness”, and “ability of independent living”.
To determine disability, we used the abridged version of the Late Life Function and Disability Instrument (LLFDI).22 All three dimensions of the LLFDI, ie, basic and advanced lower extremity function and upper extremity function, were included to calculate the main component. Additionally, participants rated their “limitations by diseases”, “physical performance”, and “ability of independent living” using a questionnaire. In detail, the question “do one or more diseases affect your general physical activity” addressed “limitation by diseases”. Physical performance was requested by “how would you rate your physical condition and fitness at the moment”.9,20,23 Of importance, although all the participants were cdw men, “independent living” was specifically addressed by the questionnaire. The question “Do your relatives or other persons significantly support your independent living; ie, how far are you dependent on other people’s help” was used to rate the real degree of autonomy in this male cohort 70–95 years old.9 In order to avoid misunderstandings and ensure completeness and consistency, the questionnaires were checked by research assistants together with the participants.
Statistical analysis
General characteristics, anthropometry, and key parameters of the study cohort were described using mean values with standard deviation (MV± SD) and proportions (%).
We applied a scaled principal component analysis (PCA) to identify males who are likely to have sarcopenia. Next, we applied fast-and-frugal decision trees (FFTrees),24 logistic regression (LR), and CART25 to classify males with and without sarcopenia. We determined the performance of the classifiers using a stratified bootstrap in combination with synthetic minority over-sampling technique (SMOTE)26 due to a strong class imbalance and computed percentile bootstrap confidence intervals. The analysis was performed using the statistical software R.27 Positive and negative predictive values were calculated by the Bayes’ formula using specificity, sensitivity, and a prevalence rate of 5%.9
Results
Principal component analysis
For finding a reliable decision rule for sarcopenia based on gait velocity, handgrip strength, SMI (ASMM/height2), and SMI (ASMM/BMI), we first needed an independent (reference) definition for sarcopenia. For this purpose, we proceeded as follows: First, we assigned between 0 and 4 sarcopenia criteria to each subject where we used gait velocity <1.0 m/s, handgrip strength <30 kg, SMI (ASMM/height2) <7.18 kg/m2, and SMI (ASMM/BMI) <0.789. Next, we applied a scaled PCA to the variables “limitations by diseases” (Var1), “advanced lower extremity function index” (Var2), “basic lower extremity function index” (Var3), “upper extremity function” (Var4), “self-rated physical performance” (Var5), and “ability of independent living” (Var6). We reordered the variables such that for all variables (Var1–Var6) higher values indicate worse conditions. We found that the first principal component (PC1) explained 66.3% of the variance, where all the six variables had very similar negative loadings (Var1=−0.381, Var2=−0.436, Var3=−0.445, Var4=−0.365, Var5=−0.372, Var6=−0.442) and PC1 showed a clear association with the number of sarcopenia criteria (Figure 1), although we did not use this information in the computations. Hence, we decided to use only the first principal component as an independent (reference) definition to identify males with sarcopenia.
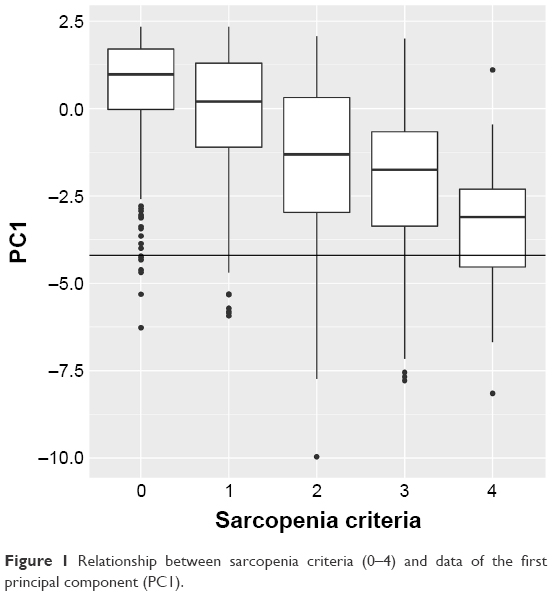 | Figure 1 Relationship between sarcopenia criteria (0–4) and data of the first principal component (PC1). |
Classification
We assumed a prevalence of about 5% for sarcopenia in the analyzed cohort of cdw German men aged 70+ years, an estimation that was based on our own data9 and findings in neighborhood European countries (eg, we computed the 5% quantile of PC1 leading to a cutoff of −4.2; that is, males with values <−4.2 were considered as having sarcopenia28–30). This led to two groups with 892 (no sarcopenia) and 47 (sarcopenia) members, respectively. Table 1 gives the characteristics of both groups.
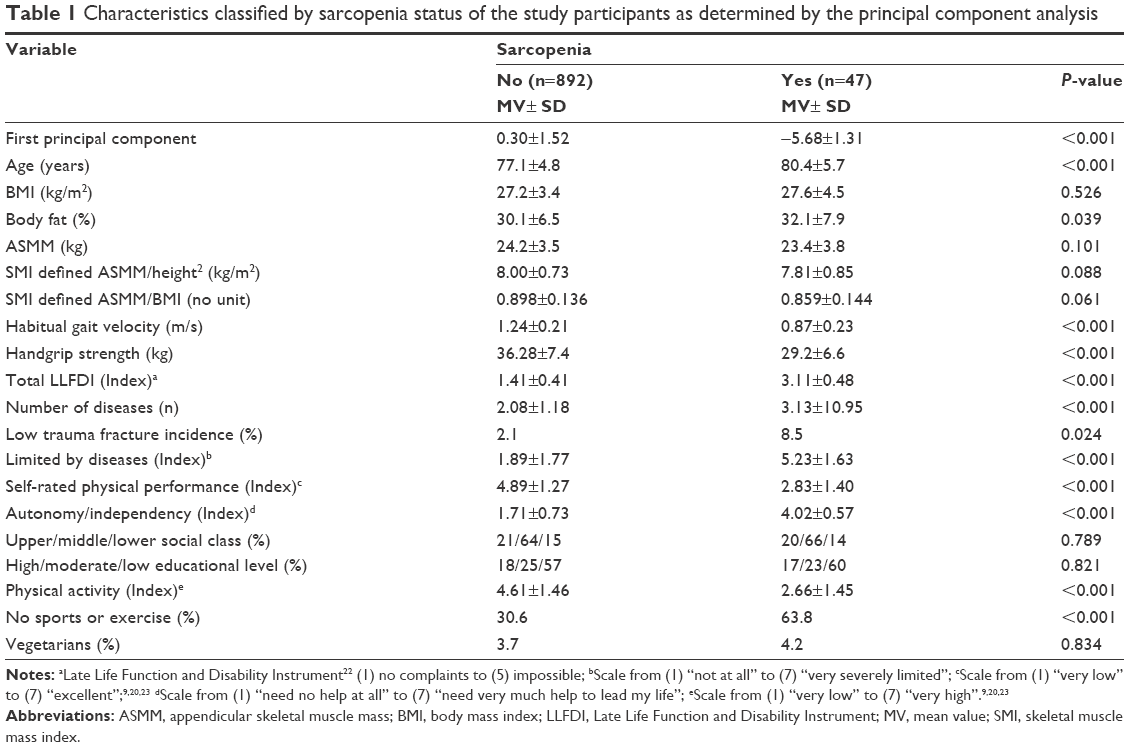 | Table 1 Characteristics classified by sarcopenia status of the study participants as determined by the principal component analysis |
When comparing men with and without sarcopenia according to the PCA applied (Table 1), as could be expected, both groups differ significantly in particular for functional parameters and parameters related to physical function, fitness/disability, and autonomy. Vice versa, muscle mass parameters did not significantly diverge between groups. This underrepresentation of muscle mass can be due to our approach of including only functional parameters in the PCA. Of interest, apart from the number of diseases, the incidence of fragility fractures varies significantly between the groups. Further, physical activity and participation in exercise is significantly lower in men classified as sarcopenic, which may be either a result of or a reason for the lower functional parameters and higher disease incidence.
Next, we wanted to find a classifier based on the variables gait velocity, handgrip strength, SMI (ASMM/height2), and SMI (ASMM/BMI). Since our goal was to derive a simple decision rule that can be applied in practice, we applied FFTrees using the FFTrees31 package in R to find the best tree. In the multivariate analysis, we benchmarked the results of FFTrees with LR as well as CART, where we used the R rpart package for CART.32 We applied a stratified bootstrap to compute the performance of the different classifiers (1,000 replications) where we used two-thirds of the data for training and one-third for testing. As the performance of LR and CART is negatively impacted by class imbalance, we also performed SMOTE under- and oversampling to balance the groups (105% undersampling and 1,800% oversampling) using the R unbalanced package.33 Due to the class imbalance, we used balanced accuracy (mean of sensitivity and specificity) as the performance measure.34 All classifiers performed similarly and we obtained the following balanced accuracies: FFTree =0.807 (95% CI 0.71–0.90), LR =0.832 (95% CI 0.74–0.90), and CART =0.806 (95% CI 0.69–0.90). The sensitivities were FFTree =0.773 (95% CI 0.56–1.00), LR =0.815 (95% CI 0.63–1.00), and CART =0.741 (95% CI 0.50–0.94), and the specificities were FFTree =0.842 (95% CI 0.66–0.94), LR =0.849 (95% CI 0.80–0.90), and CART =0.871 (95% CI 0.80, 0.93). In the case of LR, where one would need a measurement of all variables in any case, the most important variable was gait velocity followed by handgrip strength, SMI (ASMM/height2), and SMI (ASMM/BMI). The mean of the coefficients and respective 95% percentile confidence intervals of the 1,000 bootstrap samples are given in Table 2.
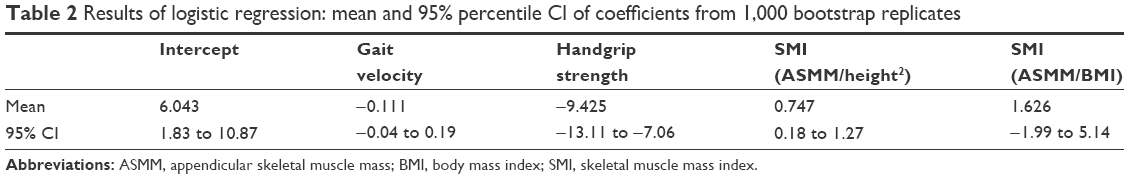 | Table 2 Results of logistic regression: mean and 95% percentile CI of coefficients from 1,000 bootstrap replicates |
In the case of CART, the most important variable was gait velocity followed by SMI (ASMM/height2), handgrip strength, and SMI (ASMM/BMI). As the best trees generated by CART were quite complex, with most of them having five or more nodes, and the cutoffs depend on the node, we only give the cutoff for gait velocity, which in all bootstrap replications was selected for the first node. The mean cutoff for gait velocity in the first node was 1.021 m/s (95% CI 0.95–1.08 m/s). In the case of FFTree, the most important variable was gait velocity followed by handgrip strength, SMI (ASMM/BMI), and SMI (ASMM/height2). In all cases, handgrip strength was selected as the second node and in almost one-half of the bootstrap replications (443 out of 1,000) the best FFTree consisted of gait velocity and handgrip strength only. The mean cutoffs for the best FFTree (Figure 2) including all four variables from the 1,000 bootstrap samples were gait velocity =1.012 m/s (95% CI 0.97–1.07 m/s), handgrip strength =34.5 kg (95% CI 33.0–35.9 kg), SMI (ASMM/BMI) =0.886 (95% CI 0.85–0.92), and SMI (ASMM/height2) =7.25 kg/m2 (95% CI 6.87–8.15). The respective FFTree is depicted in Figure 2. Summarized, gait velocity <1.012 m/s is a “killer criterion” for sarcopenia; ie, men with lower gait velocity were classified sarcopenic without further assessments. Subjects with higher gait speed, however, were assessed for handgrip strength. Men with handgrip strength ≥34.5 kg were excluded from the further sarcopenia screening. Weaker persons were assessed for SMI. However, overall, only 28% of the participants in our dataset have to be assessed further for SMI. SMI (ASMM/BMI) ≥0.886 (kg/[kg/m2]) were excluded, while subjects with lower SMI were further assessed for muscle mass using the ASMM/height2 (kg/m2) approach. Finally, a cutoff point of <7.25 kg/m2 for the latter component indicates sarcopenia. Thus, a gait velocity of <1.012 m/s and an ASMM/height2 (kg/m2) <7.25 kg/m2 can be considered as inclusion and a grip strength ≥34.5 kg and an ASMM/BMI ≥0.886 as exclusion criteria within our approach.
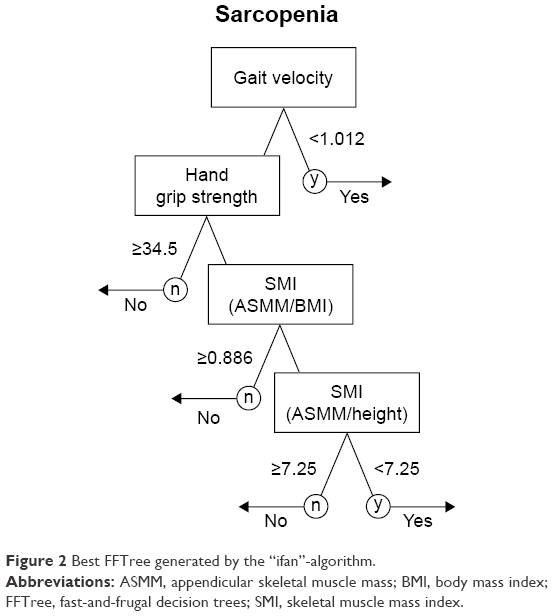 | Figure 2 Best FFTree generated by the “ifan”-algorithm. |
Comparing the performance of this decision tree (Figure 2) with recognized sarcopenia approaches2–4 resulted in comparable data. Briefly, negative predictive values averaged 95.6% for the EWGSOP,2 96.1% for the IWGS,3 95.8% for the FNIH,4 and 98.6% for our FFTree approach. Predominately, due to the low sarcopenia prevalence in this cohort, positive predictive values (PPVs) ranged between 17.9% (EWGSOP) and 32.4% (IWGS).
Discussion
In the present contribution, we set out to provide a simple decision rule for identifying sarcopenia in cdw German men aged 70+ years. Relying on the recognized functional (gait velocity and handgrip strength) and morphometric (SMI) sarcopenia components, our calculation was based on the ≈ 5% sarcopenia prevalence determined for this cohort by applying different definitions.9 In summary, a notable result is the unique feature of gait velocity within our approach. Simplified and briefly, our calculation indicates that a gait velocity <1.012 m/s (already) indicates sarcopenia whereas a gait velocity >1.012 m/s and a handgrip strength >34.5 kg indicates no sarcopenia. One may argue that an approach that indicates sarcopenia without any assessment of muscle mass is not adequate and hence “true” sarcopenia was not identified. However, when using a strictly biometrical approach with a main component that is based ultimately on “physical function”, the contribution of muscle mass, with its low to at-best moderate relation to physical performance and function at higher age35,36 necessarily and inherently remained low within this equation. This aspect was confirmed by the finding that in 443 out of 1,000 bootstrap replications, the best FFTree consisted only of gait velocity and handgrip strength. Again, one has to consider that we and other researchers4 based our arithmetical sarcopenia approach on functional aspects (“physical function”, “disability”, “weakness”, and “autonomy”) largely related to (lower limb) functional parameters, thereby ignoring muscle mass-dependent metabolic aspects (eg, thermoregulation and resting metabolic rate [RMR]).37–39 This situation is related to the common view that sarcopenia is predominately a risk factor for physical functioning. However, one should be aware that morphometric consequences of sarcopenia, such as increased fat accumulation by decreased RMR, might not only affect cardiometabolic health of the older person but also further aggravate the discrepancy between the motor (ie, muscle) and the mass to be moved (ie, fat).40 However, from a pragmatic point of view, our result that 72% of the participants can be classified without a further SMI assessment facilitates sarcopenia screening for the practitioner.
Comparing our results with other sarcopenia approaches, our results confirmed the economical approach of testing the easily assessable functional components first and then applying the more elaborate and cost-intensive assessments of muscle mass only in the case of inclusion. Furthermore, cutoff values provided by the best FFTree lay within a reasonable range. With respect to gait velocity, our results were close to present sarcopenia approaches that focus on Caucasian men2,3 (Table 3), at least when bearing in mind that we excluded men with severe lower limb osteoarthritis and corresponding walking limitations. In contrast, the cutoff point for handgrip strength (34.5 kg) is considerably higher than the present approaches (30 kg;2 26 kg;4 Table 3). However, Alley et al,5 who set out to identify handgrip cutoff points by CART analysis, reported a first cutoff point at 31.83 kg, which was not adopted in the FNIH4 sarcopenia approach, however. The use of BIA assessment made it difficult to compare the SMI (ASMM/BMI) cutoff point (0. 886) of the present study with the DXA-based suggestion of the FNIH (0.789). However, the ASMM/height2 cutpoint applied as the last decision limb (Figure 2) within this concerted approach was close to our T-Score-based cutoff point (<7.25 vs 7.18 kg/m;29 but much lower than the BIA-based SMI cutpoints suggested by the EWGSOP [<8.50 or <8.87 kg/m2]). This discrepancy is caused by the different BIA techniques (using different equations) applied in the two approaches of Janssen et al41,42 compared with our study. Concerning the performance of the methods, the present contribution provided the highest negative predictive values; however, for reasons given above, the PPVs are quite low. Consequently, positive test results should be confirmed by a second independent test to increase the PPV, which does not seem to be necessary in the case of negative test results.
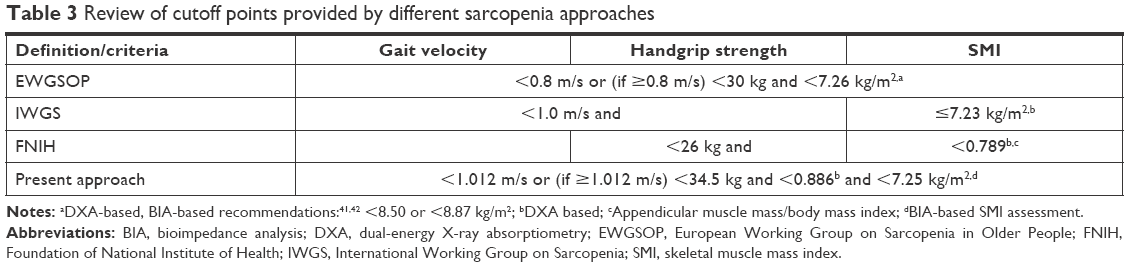 | Table 3 Review of cutoff points provided by different sarcopenia approaches |
One important aspect of our approach was the application of modern, high-end DSM-BIA. To our best knowledge, this is the first comprehensive sarcopenia approach to focus on BIA. As listed above, the EWGSOP2 supplied two cutoff points for SMI (kg/m2) provided by two older studies of Janssen et al;41,42 however, this BIA technology is scarcely comparable with the quite user-friendly and highly standardized modern DSM-BIA devices.
Some features and study limitations should be discussed to allow the reader to comprehend and appraise our approach. Apart from the application of DSM-BIA, we rely on recognized assessment tools in order to simplify this already complex analysis. With respect to the present assessment of lean body mass assessment, we are aware that there are some general concerns related to the application of DSM-BIA. However, the crucial point is whether the BIA equation applied refers to the population assessed. Although there is no real gold standard assessment tool in this area,43 DXA can be considered at least as a reference standard against which alternative techniques (DSM-BIA) can be evaluated.43 Comparing lean body mass results between our DSM-BIA (Inbody 770) and our DXA Scanner (Hologic 4,500a, Bedford, MA, USA) for the present cohort9 and a male cohort of 30–50 years old44 resulted in a good agreement for lean body mass (ICC: 91 and 89) with a narrow limit of agreement on Blande–Altman plots.
Based on our result that sarcopenia prevalence, which averaged around 5%,9 was largely independent of the approach that was adopted,2–4 we applied this threshold as a starting point for the analysis. Of importance for the generation of the (functional) cutoff points, gait velocity and, to a lesser degree, grip strength data of our cohort of cdw men aged 70+ years (Table 1) fell within the upper range of the corresponding findings.4 To a small degree, this can be due to the 10 m walking distance applied in this project. Indeed, others18 and we45 determined a slower gait speed when applying shorter distances (ie, 4 m: 1.20±0.19 vs 10 m: 1.22±0.20 m/s).45
Of course, there are many more unsupervised and supervised statistical machine learning methods that could have been applied in the multivariate analysis. However, our goal was to find a simple, easily interpretable, and practically applicable decision rule with a good overall performance. Hence, from a statistical-methodological point of view, our analysis confirms24 that FFTrees constitute an interesting alternative to CART leading to practically well-applicable decision trees.
Conclusion
We consider our approach as a strictly biometrical contribution within the development of sarcopenia screening methods that might be particularly helpful when applying the DSM-BIA technique to determine muscle mass. However, due to the focus on features of physical functioning, disability, and autonomy, the impact of muscle mass parameters within these decision tools was clearly underrepresented. However, given the lack of a watertight consensus on the meaning and definition of sarcopenia,46 it is difficult to provide a comprehensive biometrical approach for sarcopenia screening. So far, however, our decision tool has confirmed the present sarcopenia approaches4 at least for the order of application and – to a lesser extent – for sarcopenia cutoff values. Nevertheless, we think there is no “one-fits-all” sarcopenia diagnosis approach that meaningfully includes different populations, age groups, and groups with independence status where different assessment tools/methods are applied. In actual fact, we think there is a need for more dedicated decision tools that diagnose sarcopenia much more distinctly in a given population. However, our tool needs to be further evaluated and refined on different datasets to determine its appropriateness to discriminate sarcopenia in cdw men aged 70+ years.
Acknowledgment
The FRANSO project was exclusively funded by own resources of the Institute of Medical Physics, Friedrich Alexander University (FAU), Erlangen-Nürnberg.
Author contributions
All authors provided substantial contributions to conception and design, acquisition of data, or analysis and interpretation of data; drafted the article or revised it critically for important intellectual content; gave final approval of the version to be published; and agreed to be accountable for all aspects of the work in ensuring that questions related to the accuracy or integrity of any part of the work are appropriately investigated and resolved.
Disclosure
The authors report no conflicts of interest in this work.
References
Chen LK, Liu LK, Woo J, et al. Sarcopenia in Asia: consensus report of the Asian Working Group for Sarcopenia. J Am Med Dir Assoc. 2014;15(2):95–101. | ||
Cruz-Jentoft AJ, Baeyens JP, Bauer JM, et al. Sarcopenia: European consensus on definition and diagnosis: Report of the European Working Group on Sarcopenia in Older People. Age Ageing. 2010;39(4):412–423. | ||
Fielding RA, Vellas B, Evans WJ, et al. Sarcopenia: an undiagnosed condition in older adults. Current consensus definition: prevalence, etiology, and consequences. International working group on sarcopenia. J Am Med Dir Assoc. 2011;12(4):249–256. | ||
Studenski SA, Peters KW, Alley DE, et al. The FNIH sarcopenia project: rationale, study description, conference recommendations, and final estimates. J Gerontol A Biol Sci Med Sci. 2014;69(5):547–558. | ||
Alley DE, Shardell MD, Peters KW, et al. Grip strength cutpoints for the identification of clinically relevant weakness. J Gerontol A Biol Sci Med Sci. 2014;69(5):559–566. | ||
Cawthon PM, Peters KW, Shardell MD, et al. Cutpoints for low appendicular lean mass that identify older adults with clinically significant weakness. J Gerontol A Biol Sci Med Sci. 2014;69(5):567–575. | ||
Shafiee G, Keshtkar A, Soltani A, et al. Prevalence of sarcopenia in the world: a systematic review and meta-analysis of general population studies. J Diabetes Metab Disord. 2017;16:21. | ||
Ling CH, de Craen AJ, Slagboom PE, et al. Accuracy of direct segmental multi-frequency bioimpedance analysis in the assessment of total body and segmental body composition in middle-aged adult population. Clin Nutr. 2011;30(5):610–615. | ||
Kemmler W, Teschler M, Weißenfels A, et al. Prevalence of sarcopenia and sarcopenic obesity in older German men using recognized definitions: high accordance but low overlap! Osteoporos Int. 2017;28(6):1881–1891. | ||
DESTATIS. Verteilung der Bevölkerung auf Body-Mass-Index-Gruppen in Prozent [Distribution of the German population on body mass index classes by percentage]. Wiesbaden, Germany: Statistisches-Bundesamt; 2012. | ||
Jahrbuch DS. [Statistical yearbook 2015]. Vol. 2015. Wiesbaden, Germany: Statistisches Bundesamt; 2015. | ||
Rütten A, Abu-Omar K, Lampert T. Körperliche Aktivität [Physical Activity]. Report. Robert-Koch-Institut Bundes Gesundheitsberichterstattungdes, editor. Vol. Heft 26. Berlin, Germany: Statistisches Bundesamt; 2005. | ||
Günther CM, Bürger A, Rickert M, Crispin A, Schulz CU. Grip strength in healthy Caucasian adults: reference values. J Hand Surg Am. 2008;33(4):558–565. | ||
Bohannon RW, Williams Andrews A. Normal walking speed: a descriptive meta-analysis. Physiotherapy. 2011;97(3):182–189. | ||
Lampert T, Kroll L, Müters S, Stolzenberg H, et al. Messung des sozioökonomischen Status in der Studie zur Gesundheit Erwachsener in Deutschland (DEGS1) [Measurement of socioeconomic status in the German health interview and examination survey for adults (DEGS1)]. Bundesgesundheitsblatt Gesundheitsforschung Gesundheitsschutz. 2013;56(5):631–636. German. | ||
DESTATIS. Bildungsstand der Bevölkerung [Educational background of the German poulation]. Wiesbaden, Germany: Statistisches Bundesamt; 2015. | ||
Baumgartner RN, Koehler KM, Gallagher D, et al. Epidemiology of sarcopenia among the elderly in New Mexico. Am J Epidemiol. 1998;147(8):755–763. | ||
Peters DM, Fritz SL, Krotish DE. Assessing the reliability and validity of a shorter walk test compared with the 10-Meter Walk Test for measurements of gait speed in healthy, older adults. J Geriatr Phys Ther. 2013;36(1):24–30. | ||
Mathiowetz V, Weber K, Volland G, Kashman N. Reliability and validity of grip and pinch strength evaluations. J Hand Surg Am. 1984;9(2):222–226. | ||
Kemmler W, Weineck J, Kalender WA, Engelke K. The effect of habitual physical activity, non-athletic exercise, muscle strength, and VO2max on bone mineral density is rather low in early postmenopausal osteopenic women. J Musculoskelet Neuronal Interact. 2004;4(3):325–334. | ||
Kemmler W, Bebenek M, Kohl M, von Stengel S. Exercise and fractures in postmenopausal women. Final results of the controlled Erlangen Fitness and Osteoporosis Prevention Study (EFOPS). Osteoporos Int. 2015;26(10):2491–2499. | ||
Mcauley E, Konopack JF, Motl RW, Rosengren K, Morris KS. Measuring disability and function in older women: psychometric properties of the late-life function and disability instrument. J Gerontol A Biol Sci Med Sci. 2005;60(7):901–909. | ||
Kemmler W, von Stengel S, Engelke K, Sieber C, Freiberger E. Prevalence of sarcopenic obesity in Germany using established definitions: Baseline data of the FORMOsA study. Osteoporos Int. 2016;27(1):275–281. | ||
Martignon L, Katsikopoulos KV, Woike JK. Categorization with limited resources: A family of simple heuristics. J Math Psychol. 2008;52(6):352–361. | ||
Breiman L, Friedman JH, Olshen RA, et al. CART: Classification and Regression Trees. Belmont, CA, USA: Wadsworth; 1983. | ||
Chawla NV, Bowyer KW, Hall LO, et al. Smote: Synthetic minority over-sampling technique. J Artif Intell Res. 2002;16:321–357. | ||
R Core Team. R: A language and environment for statistical computing. R Foundation for Statistical Computing, ed. Vienna, Austria; 2017. https://www.R-project.org/. Accessed January 27, 2018. | ||
Clynes MA, Edwards MH, Buehring B, et al. Definitions of Sarcopenia: Associations with Previous Falls and Fracture in a Population Sample. Calcif Tissue Int. 2015;97(5):445–452. | ||
Reijnierse EM, Trappenburg MC, Leter MJ, et al. The Impact of Different Diagnostic Criteria on the Prevalence of Sarcopenia in Healthy Elderly Participants and Geriatric Outpatients. Gerontology. 2015;61(6):491–496. | ||
Volpato S, Bianchi L, Cherubini A, et al. Prevalence and clinical correlates of sarcopenia in community-dwelling older people: application of the EWGSOP definition and diagnostic algorithm. J Gerontol A Biol Sci Med Sci. 2014;69(4):438–446. | ||
Philipps ND, Neth H, Woike JK, et al. FFTrees: A toolbox to create, visualize, and evaluate fast-and-frugal decision trees. Judgm Decis Mak. 2017;12(4):344–368. | ||
Therneau T, Atkinson B, Ripley B. rpart: Recursive Partitioning and Regression Trees. R package version 4.1-11. 2017. Available from: https://CRAN.R-project.org/package=rpart. Accessed January 28, 2018. | ||
Dal Pozzolo A, Caelen O, Bontempi G. unbalanced: Racing for Unbalanced Methods Selection.; 2015. Available from: R package version 2.0. https://CRAN.R-project.org/package=unbalanced. Accessed January 29, 2018. | ||
Brodersen KH, Ong CS, Stephan KE. The balanced accuracy and its posterior distribution. In: Ercil A, ed, editor 20th International Conference on Pattern Recognition (ICPR) 2010. Istanbul, Turkey: IEEE Computer Society; 2010:3121–3124. | ||
Kim KE, Jang SN, Lim S, et al. Relationship between muscle mass and physical performance: is it the same in older adults with weak muscle strength? Age Ageing. 2012;41(6):799–803. | ||
Lauretani F, Russo CR, Bandinelli S, et al. Age-associated changes in skeletal muscles and their effect on mobility: an operational diagnosis of sarcopenia. J Appl Physiol. 2003;95(5):1851–1860. | ||
Karakelides H, Nair KS. Sarcopenia of aging and its metabolic impact. Curr Top Dev Biol. 2005;68:123–148. | ||
Kenney WL, Buskirk ER. Functional consequences of sarcopenia: effects on thermoregulation. J Gerontol A Biol Sci Med Sci. 1995;50 Spec No:78–85. | ||
St-Onge MP, Perumean-Chaney S, Desmond R, et al. Gender Differences in the Association between Sleep Duration and Body Composition: The Cardia Study. Int J Endocrinol. 2010;726071. | ||
Stenholm S, Harris TB, Rantanen T, et al. Sarcopenic obesity: definition, cause and consequences. Curr Opin Clin Nutr Metab Care. 2008;11(6):693–700. | ||
Janssen I, Baumgartner RN, Ross R, Rosenberg IH, Roubenoff R. Skeletal muscle cutpoints associated with elevated physical disability risk in older men and women. Am J Epidemiol. 2004;159(4):413–421. | ||
Janssen I, Heymsfield SB, Ross R. Low relative skeletal muscle mass (sarcopenia) in older persons is associated with functional impairment and physical disability. J Am Geriatr Soc. 2002;50(5):889–896. | ||
Buckinx F, Landi F, Cesari M, et al. Pitfalls in the measurement of muscle mass: a need for a reference standard. J Cachexia Sarcopenia Muscle. 2018;9(2):269–278. | ||
Kemmler W, Wittke A, Bebenek M, Fröhlich M, von Stengel S. High Intensity Resistance Training Methods with and without Protein Supplementation to Fight Cardiometabolic Risk in Middle-Aged Males: A Randomized Controlled Trial. Biomed Res Int. 2016;2016:1–9. | ||
Kemmler W, von Stengel S. Sarkopenie und “Sarcopenic Obesity” in Nordbayern. Einfluss unterschiedlicher Vorgaben und Messprotokolle auf die Prävalenzrate Osteologie. 2017;26(3):164–170. | ||
Fuggle N, Shaw S, Dennison E, Cooper C. Sarcopenia. Best Pract Res Clin Rheumatol. 2017;31(2):218–242. |
 © 2018 The Author(s). This work is published and licensed by Dove Medical Press Limited. The
full terms of this license are available at https://www.dovepress.com/terms
and incorporate the Creative Commons Attribution
- Non Commercial (unported, 3.0) License.
By accessing the work you hereby accept the Terms. Non-commercial uses of the work are permitted
without any further permission from Dove Medical Press Limited, provided the work is properly
attributed. For permission for commercial use of this work, please see paragraphs 4.2 and 5 of our Terms.
© 2018 The Author(s). This work is published and licensed by Dove Medical Press Limited. The
full terms of this license are available at https://www.dovepress.com/terms
and incorporate the Creative Commons Attribution
- Non Commercial (unported, 3.0) License.
By accessing the work you hereby accept the Terms. Non-commercial uses of the work are permitted
without any further permission from Dove Medical Press Limited, provided the work is properly
attributed. For permission for commercial use of this work, please see paragraphs 4.2 and 5 of our Terms.