Back to Journals » Nutrition and Dietary Supplements » Volume 12
Determinants of Undernutrition Among Adult People on Antiretroviral Therapy in Goba Hospital, Southeast Ethiopia: A Case–Control Study
Authors Kalil FS ![]() , Kabeta T
, Kabeta T ![]() , Jarso H
, Jarso H ![]() , Hasen M
, Hasen M ![]() , Ahmed J
, Ahmed J ![]() , Kabeta S
, Kabeta S
Received 10 August 2020
Accepted for publication 30 September 2020
Published 28 October 2020 Volume 2020:12 Pages 223—236
DOI https://doi.org/10.2147/NDS.S276311
Checked for plagiarism Yes
Review by Single anonymous peer review
Peer reviewer comments 2
Editor who approved publication: Dr Chandrika Piyathilake
Falaho Sani Kalil,1 Teshome Kabeta,2 Habtemu Jarso,2 Mohammed Hasen,3 Jemal Ahmed,4 Shukuri Kabeta3
1Negelle Borena Health Science College, Oromia, Negelle Borena, Ethiopia; 2Jimma University, Institute of Health, Faculty of Public Health, Department of Epidemiology, Jimma, Ethiopia; 3Public Health Emergency Management Coordination Office, East Bale Zonal Health Department, Ginnir, Ethiopia; 4Department of Nutrition, College of Health and Medical Sciences, Haramaya University, Harar, Ethiopia
Correspondence: Teshome Kabeta
Jimma University, Institute of Health, Faculty of Public Health, Department of Epidemiology, Jimma, Ethiopia
Tel +251911794169
Email [email protected]
Background: Nutritional status affects effectiveness and adherence to antiretroviral therapy, survival status, and quality-of-life in people living with human immunodeficiency virus. Prevalence of undernutrition among HIV infected people in Ethiopia ranges from 12.3% to 55.6%.
Objective: To identify determinants of undernutrition among adult people on antiretroviral therapy in Goba Hospital, Southeast Ethiopia.
Methods: A facility-based case–control study was conducted on 276 study participants from March 16 to May 26, 2019. Nutritional status was determined by body mass index (BMI), where BMI< 18.5 kg/m2 was defined as malnutrition. A pretested structured questionnaire was used to collect data by face-to-face interview. Data were entered into Epi-data version 4.4 and then exported to SPSS version 23 for analyses. Bivariable and multiple binary logistic regression were fitted. Multicollinearity was checked among candidate variables using variance inflation factor. P-value< 0.05 was considered statistically significant and AORs at 95% CIs was used to assess the strength of association.
Results: The response rate of participants was 97% among cases and 95% among controls. Nearly two-thirds (65%) of cases and 54.3% of controls were females. Factors significantly associated with undernutrition were household food insecurity (AOR=3.24, 95% CI=1.72– 6.08), depression (AOR=2.07, 95% CI=1.16– 3.72), current alcohol consumption (AOR=3.80, 95% CI=1.71– 8.43), and non-adherence to antiretroviral therapy (AOR=2.61, 95% CI=1.28– 5.30).
Conclusion: Household food insecurity, depression, current alcohol consumption, and non-adherence to ART were associated with undernutrition. Strengthening the strategies and programs that target food assistance besides therapeutic interventions, addressing problems related to adherence of ART, incorporating psychosocial information about depression and substance use during counseling provided by healthcare providers for PLHIV and further longitudinal study were recommended.
Keywords: undernutrition, HIV, antiretroviral therapy, case control, Ethiopia
Background
For Human Immunodeficiency Virus (HIV) infections, low body weight, weight loss, micronutrient deficiencies, and deficiencies of other nutrients that affect the immune system are referred to as malnutrition.1
Worldwide, 795 million people are undernourished and approximately 462 million adults were underweight and these mostly occur in low- and middle-income countries.2,3 Sub-Saharan Africa in particular has the highest prevalence estimates of undernutrition in the world, with 23.2% of its population affected.2 A meta-analysis conducted in sub-Saharan Africa (SSA) countries reported the pooled prevalence of HIV-related malnutrition was 10.3%.4 Studies done in developing countries reported that the prevalence of malnutrition among HIV-infected adults ranges from 19.4% in Tanzania to 43% in Brazil.5–8 SSA is the most affected part of the world among the 37.9 million people living with HIV globally, the majority are from low- and middle-income countries with an estimate of 68%.9
Studies in different parts of Ethiopia reported high prevalence of malnutrition among people living with HIV enrolled on Anti-Retroviral Therapy (ART). For instance, a study in East Hararghe zone reported a total prevalence of 30%,10 a study in Jimma town reported 43%,11 a study in an Amhara region referral hospital reported 55.6%,12 a study in Dilla University Referral Hospital reported 12.3%,13 in Wolaita Sodo University teaching Hospital was 26.6%,14 a study in West Shewa Zone reported 22.6%,15 and a study in Butajira Hospital reported 25.2%.16 According to HIV-related estimates and projections, the prevalence of HIV among adults in Ethiopia is 1.16% and 1.15% in 2017 and 2018, respectively; while in Oromia region it was 0.79 and 0.78 in 2017 and 2018, respectively.17
Malnutrition and HIV have common biological, immunological, and socio-economic consequences. These two conditions interact and create a vicious circle.1,2,18 Malnutrition increases susceptibility to infection, morbidity, and mortality through opportunistic infections.19,20 The immune system is weakened and resistance to infection is reduced.18 Malnutrition leads to immune impairment, worsens the effect of HIV, and contributes to more rapid progression to acquired immune deficiency syndrome (AIDS), and that’s why malnutrition is considered as both a contributor and resulting from the progression of HIV.1,19 Moreover, nutrients act as cofactors of the immune system metabolic pathways, and vitamins and minerals deficiencies (for example vitamin A, C, E, selenium, and zinc) contribute to the oxidative stress, which accelerates the death of immune cells and increases viral replication.18
HIV infection increases the risk of malnutrition. HIV-infected patients have an enhanced activity of pro-inflammatory cytokines (TNF-α, IL-1 β, IL-6), which can cause a decrease of body mass and growth retardation in children.18 HIV affects the nutritional status by increasing energy requirements, reducing food intake, and adversely affecting nutrient absorption and metabolism inefficiencies due to cytokine activity and diarrhea.1,2,7,19 Opportunistic infections associated with HIV can also alter the nutritional status.18 For example, oral and esophageal candidiasis make food intake difficult. Undernourished PLHIV are less likely to adhere to ART treatment because many of the antiretroviral drugs must be taken with food, and poor treatment adherence is associated with worse disease outcomes.2,20
Thus, the relationships between malnutrition and HIV are complex. A nutritional deficiency can accelerate the progression of HIV infection, affect the immune system, and lead to opportunistic infections. HIV infection, in turn, worsens the nutritional status after altering immune functions, due to HIV-related co-infections and its socioeconomic negative impact.
According to the 2016 Global Nutrition Report, the economic consequences of malnutrition represent losses of 11% of Gross Domestic Product (GDP) every year in Africa and Asia.21
Evidence on malnutrition among PLHIV has shown that factors such as gender, employment, educational level, and income were closely related determinants of undernutrition. Additionally, gastrointestinal complications, opportunistic infections, duration of ART, food insecurity, poor dietary diversity, depression, and living condition were reported to be risk factors for malnutrition among PLHIV.5–7,11–15
The rapidly expanding access to ART is changing the global HIV epidemic in momentous ways, and AIDS-related mortality rates have been declining rapidly.22 However, the effectiveness of ART in achieving the intended goals can be affected by various factors. Nutritional status is one of the factors that significantly affect the effectiveness of ART, survival status, and quality-of-life among people living with HIV.2,23
Nutrition assessment, counseling, and supports improves the quality of care and aims to decrease morbidity and mortality associated with HIV.20,23 The World Health Organization (WHO) recommends the integration of nutrition support as part of a comprehensive response to HIV/AIDS.23,24 Though many advances in the fight against HIV have been made in Ethiopia, sufficient efforts have not been put into promoting adequate nutrition for people living with HIV.19 Thus, the Ministry of Health of Ethiopia has launched the National Nutrition Program (NNP) in 2006 to address nutrition problems in a comprehensive manner by including nutrition and HIV/AIDS as part of its complete service delivery, and emphasizes the importance of linking the nutrition and HIV/AIDS program with other livelihood programs.19 Despite the effort made by government, undernutrition in PLHIV is still a public health problem in Ethiopia.10–16,19
Despite advancements in the treatment modality, undernutrition in PLHIV significantly affects effectiveness and adherence to antiretroviral therapy and survival status.25,26 Only a few case–control studies were conducted on this topic and they are also limited to the Northern part of Ethiopia, and important factors like psychosocial and nutritional determinants of undernutrition were not comprehensively studied. Therefore, this study aimed to identify the determinants of undernutrition among adult people on antiretroviral therapy in Goba Hospital, Southeast Ethiopia.
Methods
Study Setting
The study was conducted in Meda-Welabu University, Goba Referral Hospital, from March 16 to May 26, 2019. The hospital is found in Goba town of Bale zone, Oromia National Region State, and located at 445 km Southeast from the capital city, Addis Ababa, Ethiopia. Goba Referral Hospital is one of the five hospitals in Bale zone which provides general health services and serves as a teaching and referral hospital for Meda-Welabu University. The ART clinic was established in 2005/6 and, at the time of the study, there were 2,127 total registered patients at ART clinic.
Study Design and Population
This is facility-based case–control study conducted among adult people on antiretroviral therapy. The study population is all adult people on antiretroviral therapy at ART clinic of Goba Hospital during the study period. Cases were undernourished (BMI<18.5 kg/m2) adult people (≥18 years) living with HIV who were enrolled on ART. Controls were adult people living with HIV who were enrolled on ART and well-nourished (BMI=18.5–24.9 kg/m2). PLHIV who were on ART for at least 1 month were included in the study. Critically sick patients who were not able to respond during data collection, pregnant women, and postpartum within 6 weeks were excluded from the study.19,20
Sample Size and Sampling Procedures
The sample size was computed by Epi-Info using a formula for unmatched case control study. The calculation was made for several predictors of undernutrition identified from previous studies by consideration of 95% confidence level, 80% power, a case-to-control ratio of 1:2. The largest sample size was obtained using the proportion of well-nourished PLHIV who had depression (32.9%) and Adjusted Odds Ratio (AOR) of 2.14.27 After considering non-response of 10%, finally, a total of 276 samples (92 cases and 184 controls) were included in the study. Cases were selected consecutively as they occur, and then two subsequent controls visited the ART clinic after the case were included.
Data Collection Tools and Methods
A structured questionnaire, which was adapted from different literatures, was used to collect the data.28–35 Data were collected by three trained health professionals under the supervision of two senior clinical nurses from ART clinic. Prior to data collection, the study subjects were identified as cases and controls based on anthropometric measurements by supervisor, then they were sent to two separate rooms; one for cases and the other for controls. The data collectors were blinded to the status of the respondent and they were unable to identify the study subject as case and control.
Data of socio-demographic, nutritional, and psychosocial characteristics were collected from the patients by face-to-face interview. A data abstraction checklist was used to collect clinical characteristics such as clinical stage, CD4 count, ART regimen, opportunistic infections, duration of ART, and recent hemoglobin level from patient’s ART follow-up medical record. ART adherence status of the last 1 month was collected from medical records and combined with self-reported adherence measurement techniques by asking participants about the number of times he/she has missed taking pills. Depression was assessed using Patient Health Questionnaire (PHQ-9) score for depression, which is a reliable and valid instrument that was used to diagnose major depressive disorders among Ethiopian adults.28,29
Measurements
Anthropometries were measured following standardized techniques.19 The weight of the study participant was measured to the nearest 0.1 kg using standing beam balance. Each participant was asked to remove heavy clothes and shoes. The scale was calibrated to zero before each measurement. Height of the participant was measured using a portable Stadiometer vertical height measuring scale. During height measurement, the participants were asked to remove shoes, pins and braids from the hair that could affect the measurement. Participant stood upright in the middle of a board and height measurement was done with the head of the participant at the Frankfurt plane, looking straight in the horizontal plain, knees straight and the occiput, heels, buttocks, and the shoulders blades touching the measuring board. The measurement was recorded to the nearest 0.5 cm. Body mass index was calculated as weight in kilograms divided by the square of height in meters (kg/m2).
The household food insecurity status of participant was assessed using a short version of the Household Food Insecurity Access Scale (HFIAS), the tool developed by Food and Nutrition Technical Assistance (FANTA) project and adapted to individual level.30,31 Each question is within a recall period of 30 days. The respondents were first asked an occurrence question that is, whether the condition in the question happened at all in the past 4 weeks (yes/no). If the respondent answer was “yes” to an occurrence question, a frequency-of-occurrence was asked to determine whether the condition happened rarely (once or twice), sometimes (3–10 times), or often (more than 10 times).31
A tool for measuring the dietary diversity was adopted from the Food and Agricultural Organization (FAO) guideline for measuring individual dietary diversity.32,33 Dietary Diversity Score (DDS) was determined by asking the respondents to list all the food items consumed in the previous 24 hours preceding the assessment date, starting with the first food consumed the previous morning. If a mixed dish was eaten, participants were asked about all the ingredients of the dish. Once the recall was finished, participant was probed for food groups to ask for food that was not mentioned. The reported food items were categorized into nine food groups: Starchy staples, Dark green leafy vegetables, Other vitamin A rich fruits and vegetables, Other fruits and vegetables, Organ meat, Meat and fish, Eggs, Legumes, nuts, and seeds, and Milk and milk products. The DDS was calculated as the sum of the food groups consumed over 24 hours, and the score ranged from 1–9.33 Locally available food items were identified from agricultural research center experts of the study area.
Cigarette smoking, khat chewing, and alcohol consumption were assessed using a structured questionnaire adopted from a STEPS survey on Non-Communicable Diseases (NCDs) risk factors in Ethiopia and WHO STEPwise approach to chronic disease risk factor surveillance.34,35 Alcohol use problem was considered as consuming >30 g of pure alcohol (>3 standard drinks) on average per day for men, and >20 g for women.34,35 Locally, different receptacles, including “Melekiya”, “Tassa”, and “Berille” are used when drinking “Areke”, “Tella”, and “Tej”, respectively. Local alcohol drinks, for example, “Tella” has about 4%, “Tej” has about 10%, and “Areke” has 40–45%, a bottle of regular Beer (330 mL) has 4.5%, and a glass of Wine (120 mL) has 12% alcohol content.36–38 All alcoholic beverages were converted into a standard drink, for example, one “Melekiya” of “Areke” (30 mL) contain 40% volume by volume of alcohol, to calculate the content of alcohol in a drink, 30 mL*42.5%*0.79=10.1 g of alcohol in one Melekiya of Areke.36
Operational Definitions
Undernutrition
The body mass index is less than 18.5 kg/m2.19,20
Dietary Diversity
A DDS of 4 or above is considered as adequate dietary diversity and a DDS of less than 4 is inadequate dietary diversity.32,33
Food Security
Food insecurity is considered when the individual HFIAS score is >1.31
Alcohol Consumption
An individual was considered as a “current drinker” if they consumed more than 21 standard drinks/week for men and more than 14 standard drinks/week for women in the past 30 days. “Alcohol consumption in the past 12 months“ is defined as if they consume more than 21 standard drinks/week for men and more than 14 standard drinks/week for women in the past 12 months.34,35
One standard drink of alcohol = “Tella” (one glass “borde” or “cheka” or “korefe”) or “Tej” (1/2 “Berele”) or “Areke” (one “melkiya”) or regular Beer (330 mL beer or one bottle) or Draft (one “single“), or Spirits (30 mL of Whisky or Gin or Uzo or Vodka), or one glass of wine (120 mL), which is generally defined as the net alcohol content of a standard drink is approximately 10 g of ethanol.36–38
Depression
An individual was considered to have depression if they had a PHQ-9 score above 4. Based on scores, the patient was classified as no depression (0–4), Mild depression (5–9), Moderate depression (10–14), Moderately severe depression (15–19), and Severe depression (20–27).29
Cigarette Smoking
An individual was considered as a “current cigarette smoker” if s/he had smoked a minimum of one cigarette (manufactured type like Nyala, Rothman, etc.) per week within the last 30 days preceding the study and an “ever cigarette smoking after starting ART” is defined as if s/he had smoked a minimum of one cigarette per week since starting ART.
Khat Chewer
An individual was considered as “current khat chewer” if he/she had chewed at least one bundle of khat per week within the last 30 days and an “ever chat chewer after starting ART” is defined if s/he had chewed at least one bundle of khat per week since starting ART.
Meal Frequency
Daily eating occasions reported by individual within a 24-hour period.
Eating Difficulty
Experiencing one of the following conditions: loss of appetite, nausea, vomiting, or swallowing difficulty in the past 6 months.
ART Adherence Status
The adherence to ART was assessed using the number of missed doses for the last 1 month. Adherence status was classified as “Good” if a person took ≥95% (missed ≤2 dose) of prescribed drug, “Fair” if adherence is 85–94% (missed 3–5 doses), and “poor” if a person took below 85% (missed ≥6 doses) of prescribed drug for 1 month.39 Adherence to ART was considered if a person took ≥95% (missed ≤2 dose) of prescribed drug for 1 month.
Altitude Adjusted Hemoglobin Level
The adjustment was made for altitude and smoking. The adjustment was subtracted from each individual’s observed hemoglobin level to calculate the adjusted hemoglobin. The altitude of Goba town is 2,540 meters above sea level, which was adjusted for by subtracting 1.3 g/dL from the observed hemoglobin and 0.03 g/dL for smokers. Anemia is defined as a hemoglobin level of <12.0 gm/dL for females and <13.0 gm/dL for males.40
Data Analysis Procedures
Data were checked for completeness and consistencies, and then coded and entered using Epi-data and then exported to SPSS version 23 for analysis. The entered data were cleaned, edited, and recoded before analysis. Normal distribution of continuous variables was checked statistically using the Kolmogorov–Smirnov test. Descriptive statistics were computed and the characteristics of the study participants were described in terms of median and interquartile range for continuous data, and all categorical variables were cross-tabulated with outcome variable, and described by their frequencies and proportion for cases and control groups. The reliability (internal consistency) of items of the scale used in this study (HFIAS, Dietary diversity score, and PHQ-9 score of depression) were assessed using Cronbach’s alpha.
Bivariable logistic regression was computed between all explanatory variables and outcome variables to identify candidate variables for the final model. Interaction between candidate variables were checked using Breslow-Day test of homogeneity. The absence of multicollinearity between different explanatory variables was checked using variance inflation factor (VIF) and tolerance.41 Accordingly, the VIFs of all candidate variables were below 5 and the tolerances was above 0.2. All explanatory variables that were significantly associated with the outcome variable in the bivariable logistic regression at P≤0.20 were entered into a multivariable logistic regression model using a backward elimination stepwise method.42 The model adequacy was checked using Hosmer and Lemeshow goodness-of-fit test (P=0.607). Adjusted odds ratios (AORs) with their corresponding confidence intervals (CIs) were used to assess the strength of associations between the outcome and predictor variables at P<0.05.
Data Quality Management
Th questionnaire was prepared in English initially and translated to the local language Afan Oromo and Amharic, then back translated to English to check for consistency by two different language experts. A 2 days training was given to the supervisors and data collectors. The questionnaire was pre-tested on 5% of the sample size at Bale Robe Hospital prior to the actual data collection and revised based on the feedback obtained from the pre-test. The scale was calibrated to zero every five measurement of weight. The data were strictly checked for completeness, accuracy, clarity, and consistency by a supervisor on daily bases. Furthermore, the data were checked for completeness, coded, and carefully entered into the computer using Epi-data, and intensive data cleaning was done before analysis.
Results
Socio-Demographic and Economic Characteristics of the Respondent
Totally, 89 cases and 175 controls participated in the study, making the response rate 97% among cases and 95% among controls. The non-response was due to refusals to participate in the study. Of the total participants included in this study, 58 (65.2%) of cases and 95 (54.3%) of controls were females. The median (interquantile range) age of the participants was 38 years (IQR=30–44.5) for the cases, and 35 years (IQR=30–45) for the controls. Nearly two-thirds of cases (57, 64%) and more than two-thirds of control (122, 69.7%) respondents were urban dwellers. Regarding education, one-third of cases (30, 33.7%) and one-fifth of controls (37, 21.1%) had no formal education. Most of the cases (57.3%) and the controls (61.7%) were married. Near to one-third of the cases (28, 31.5%) and about one-fourth of the controls (42, 24%) were housewives by occupation. Regarding income of the participants, the median (IQR) monthly income for cases and controls was 1,000 Ethiopian Birr (IQR=725–1500) and 1,200 Ethiopian Birr (IQR=800–1,600), respectively (Table 1).
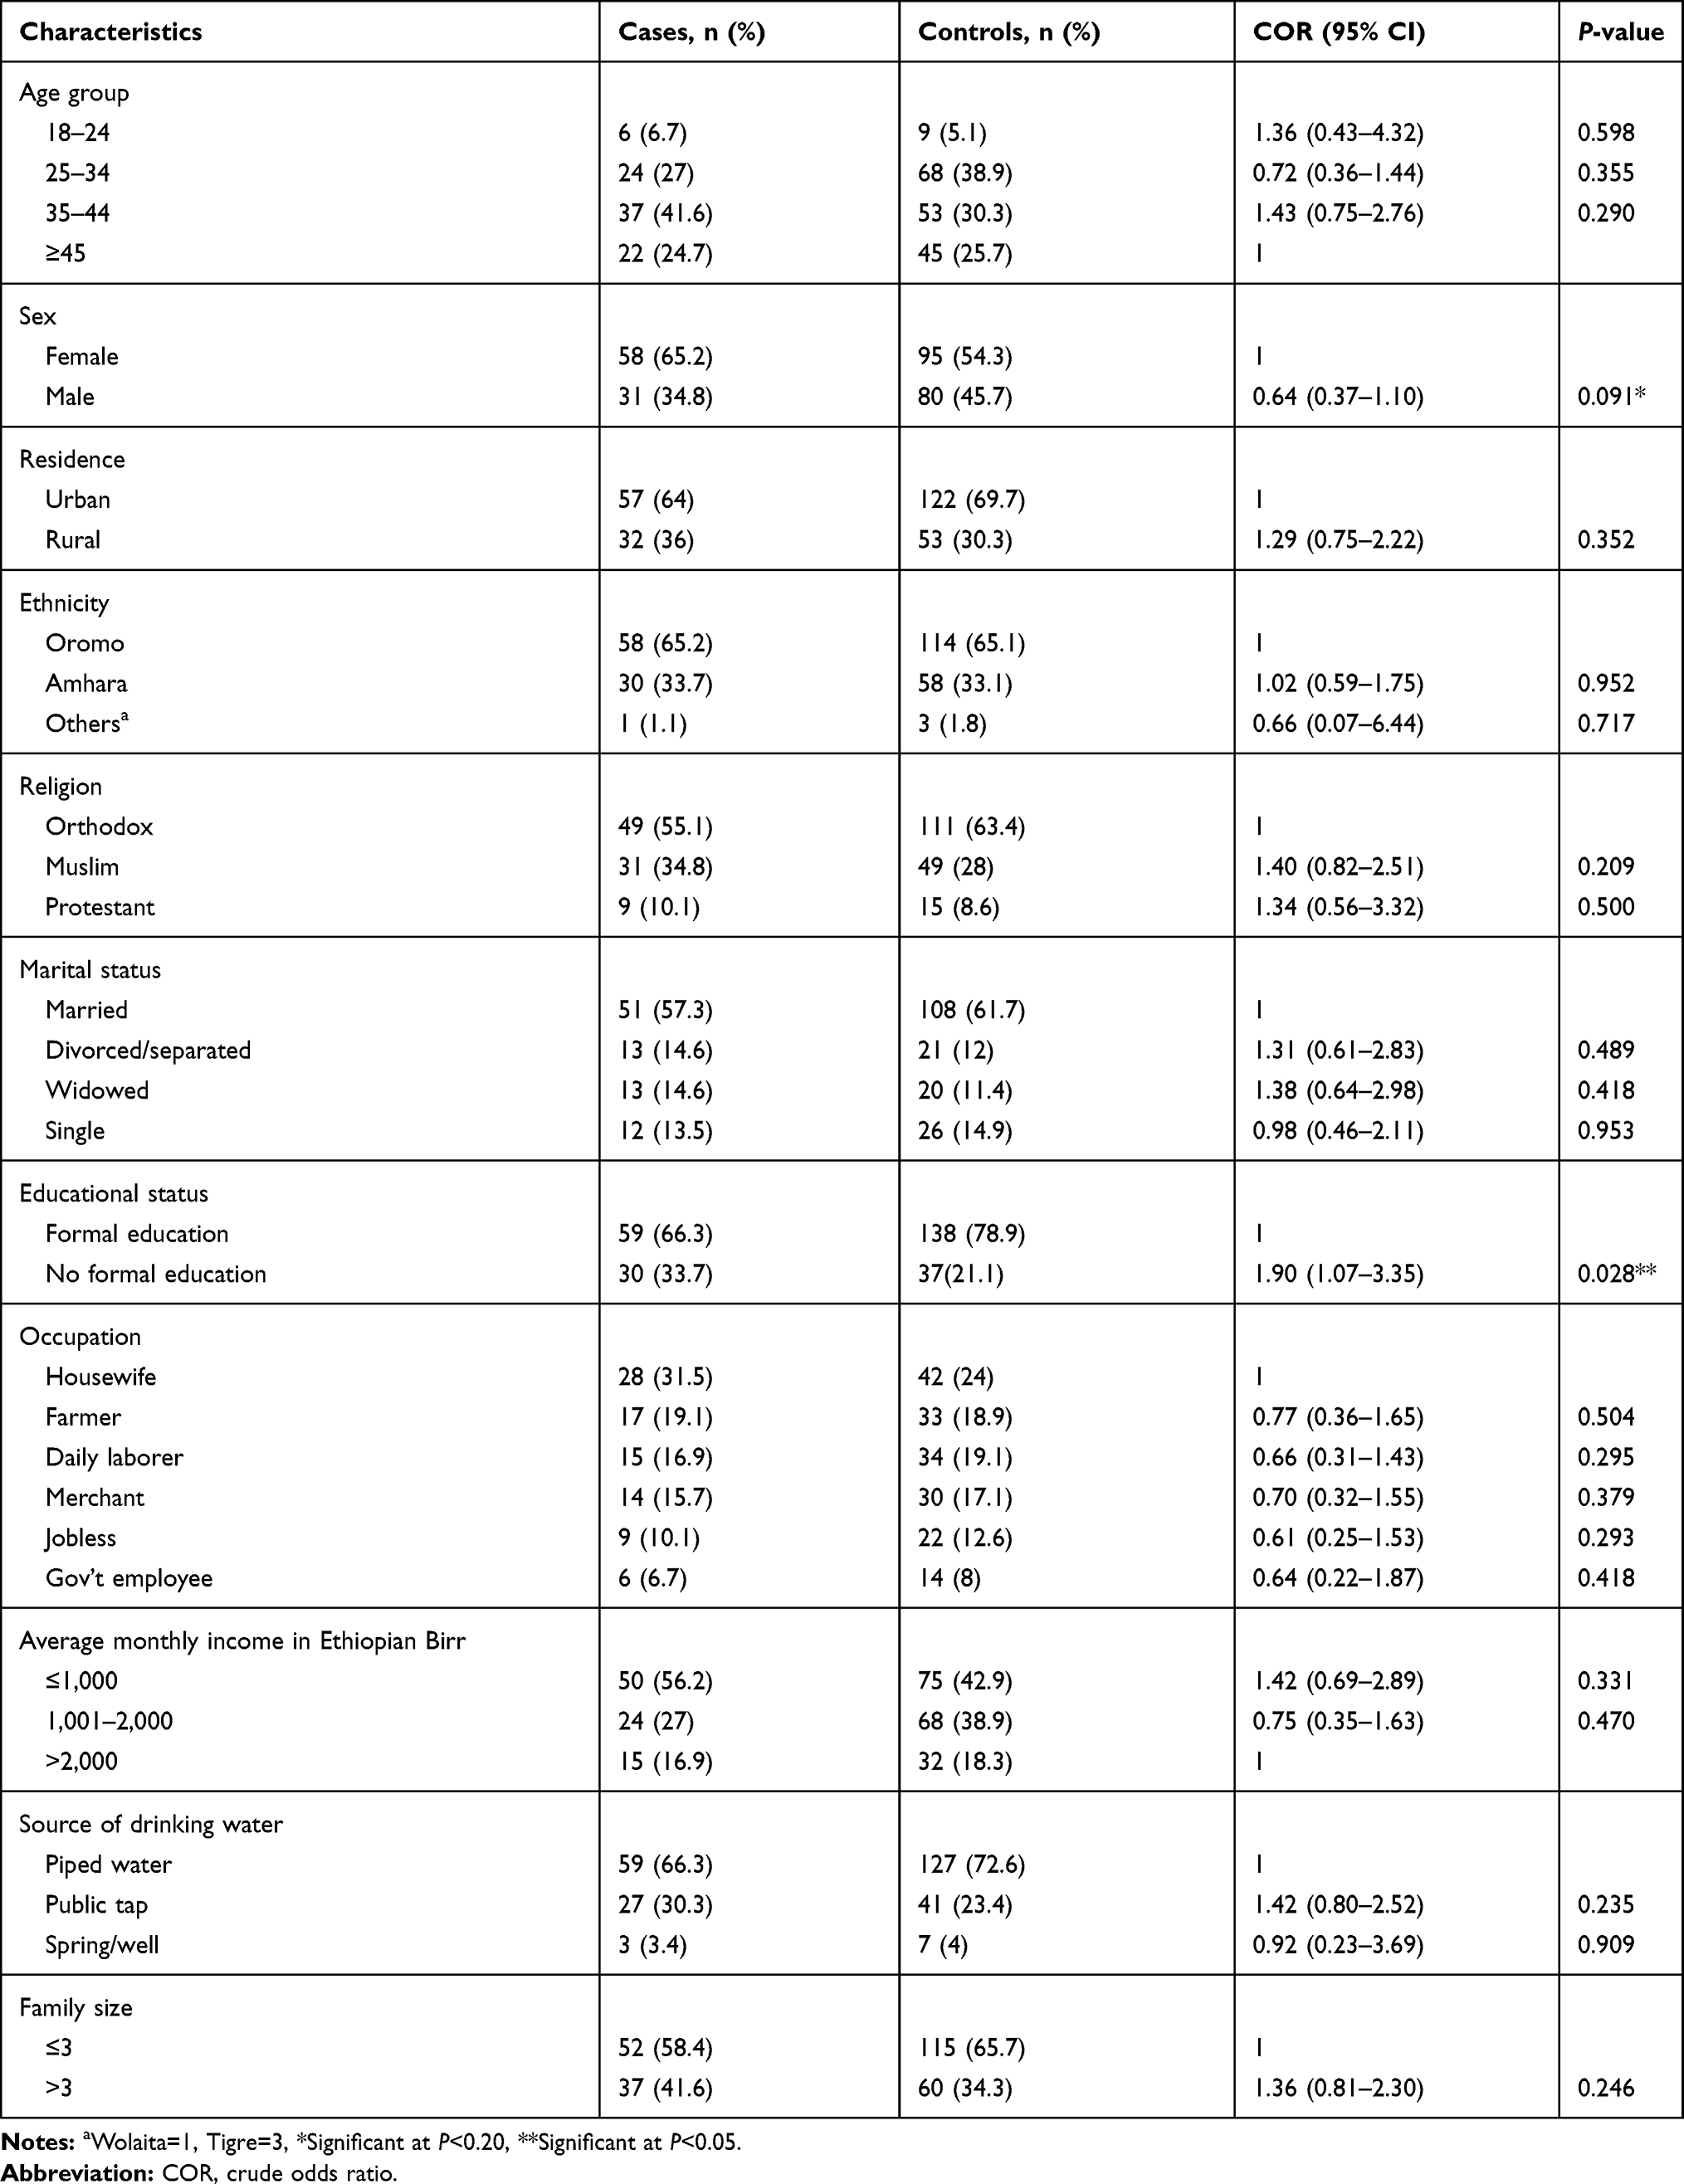 |
Table 1 Bivariable Logistic Regression of Socio-Demographic and Economic Factors Among Adult PLHIV and Attending ART at Goba Hospital, Bale Zone, Southeast Ethiopia, March 16 to May 26, 2019 |
Bivariable Analysis
Socio-Demographic and Economic Characteristics
Bivariable logistic regression was employed for each variable to select candidate variables for multivariable logistic regression. From socio-demographic and economic variables, sex and educational level were significant at P≤0.2 and selected as candidates for multivariable logistic regression (Table 1).
Nutrition-Related Characteristics
Among nutrition-related factors, household food insecurity (Cronbach’s Alpha=0.907) was significantly associated with undernutrition in PLHIV in bivariable logistic regression at a P-value less than 0.05. Moreover, dietary diversity (Cronbach’s Alpha=0.515), dietary counseling, and eating difficulty were other variables significantly associated with undernutrition in PLHIV in bivariable analysis stage at P≤0.2 (Table 2).
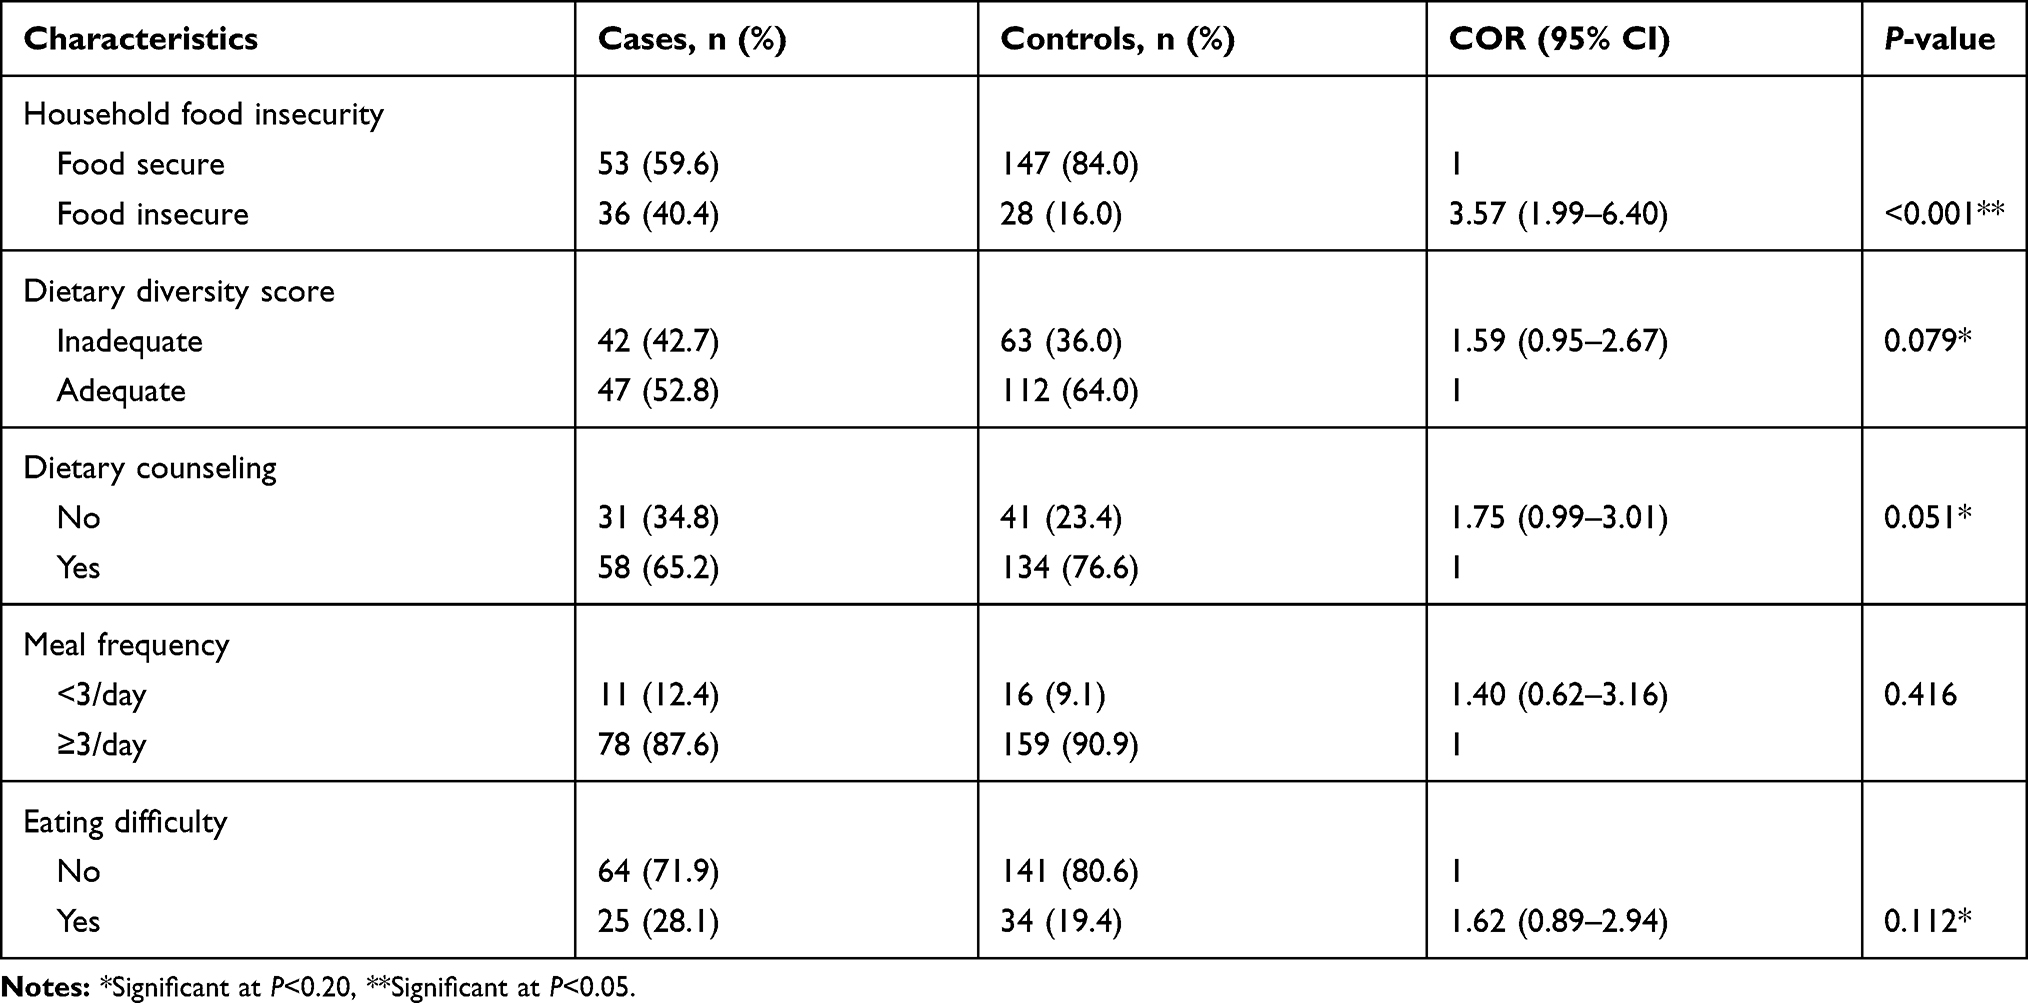 |
Table 2 Bivariable Logistic Regression of Nutrition-Related Characteristics Among Adult PLHIV and Attending ART at Goba Hospital, Bale Zone, Southeast Ethiopia, March 16 to May 26, 2019 |
Psychosocial and Substance Use Characteristics
Under this category, three variables were significantly associated with undernutrition among PLHIV in bivariable logistic regression at a P-value less than 0.05. These are depression (Cronbach’s Alpha=0.866), current alcohol consumption, and alcohol consumption in the last 12 months (Table 3).
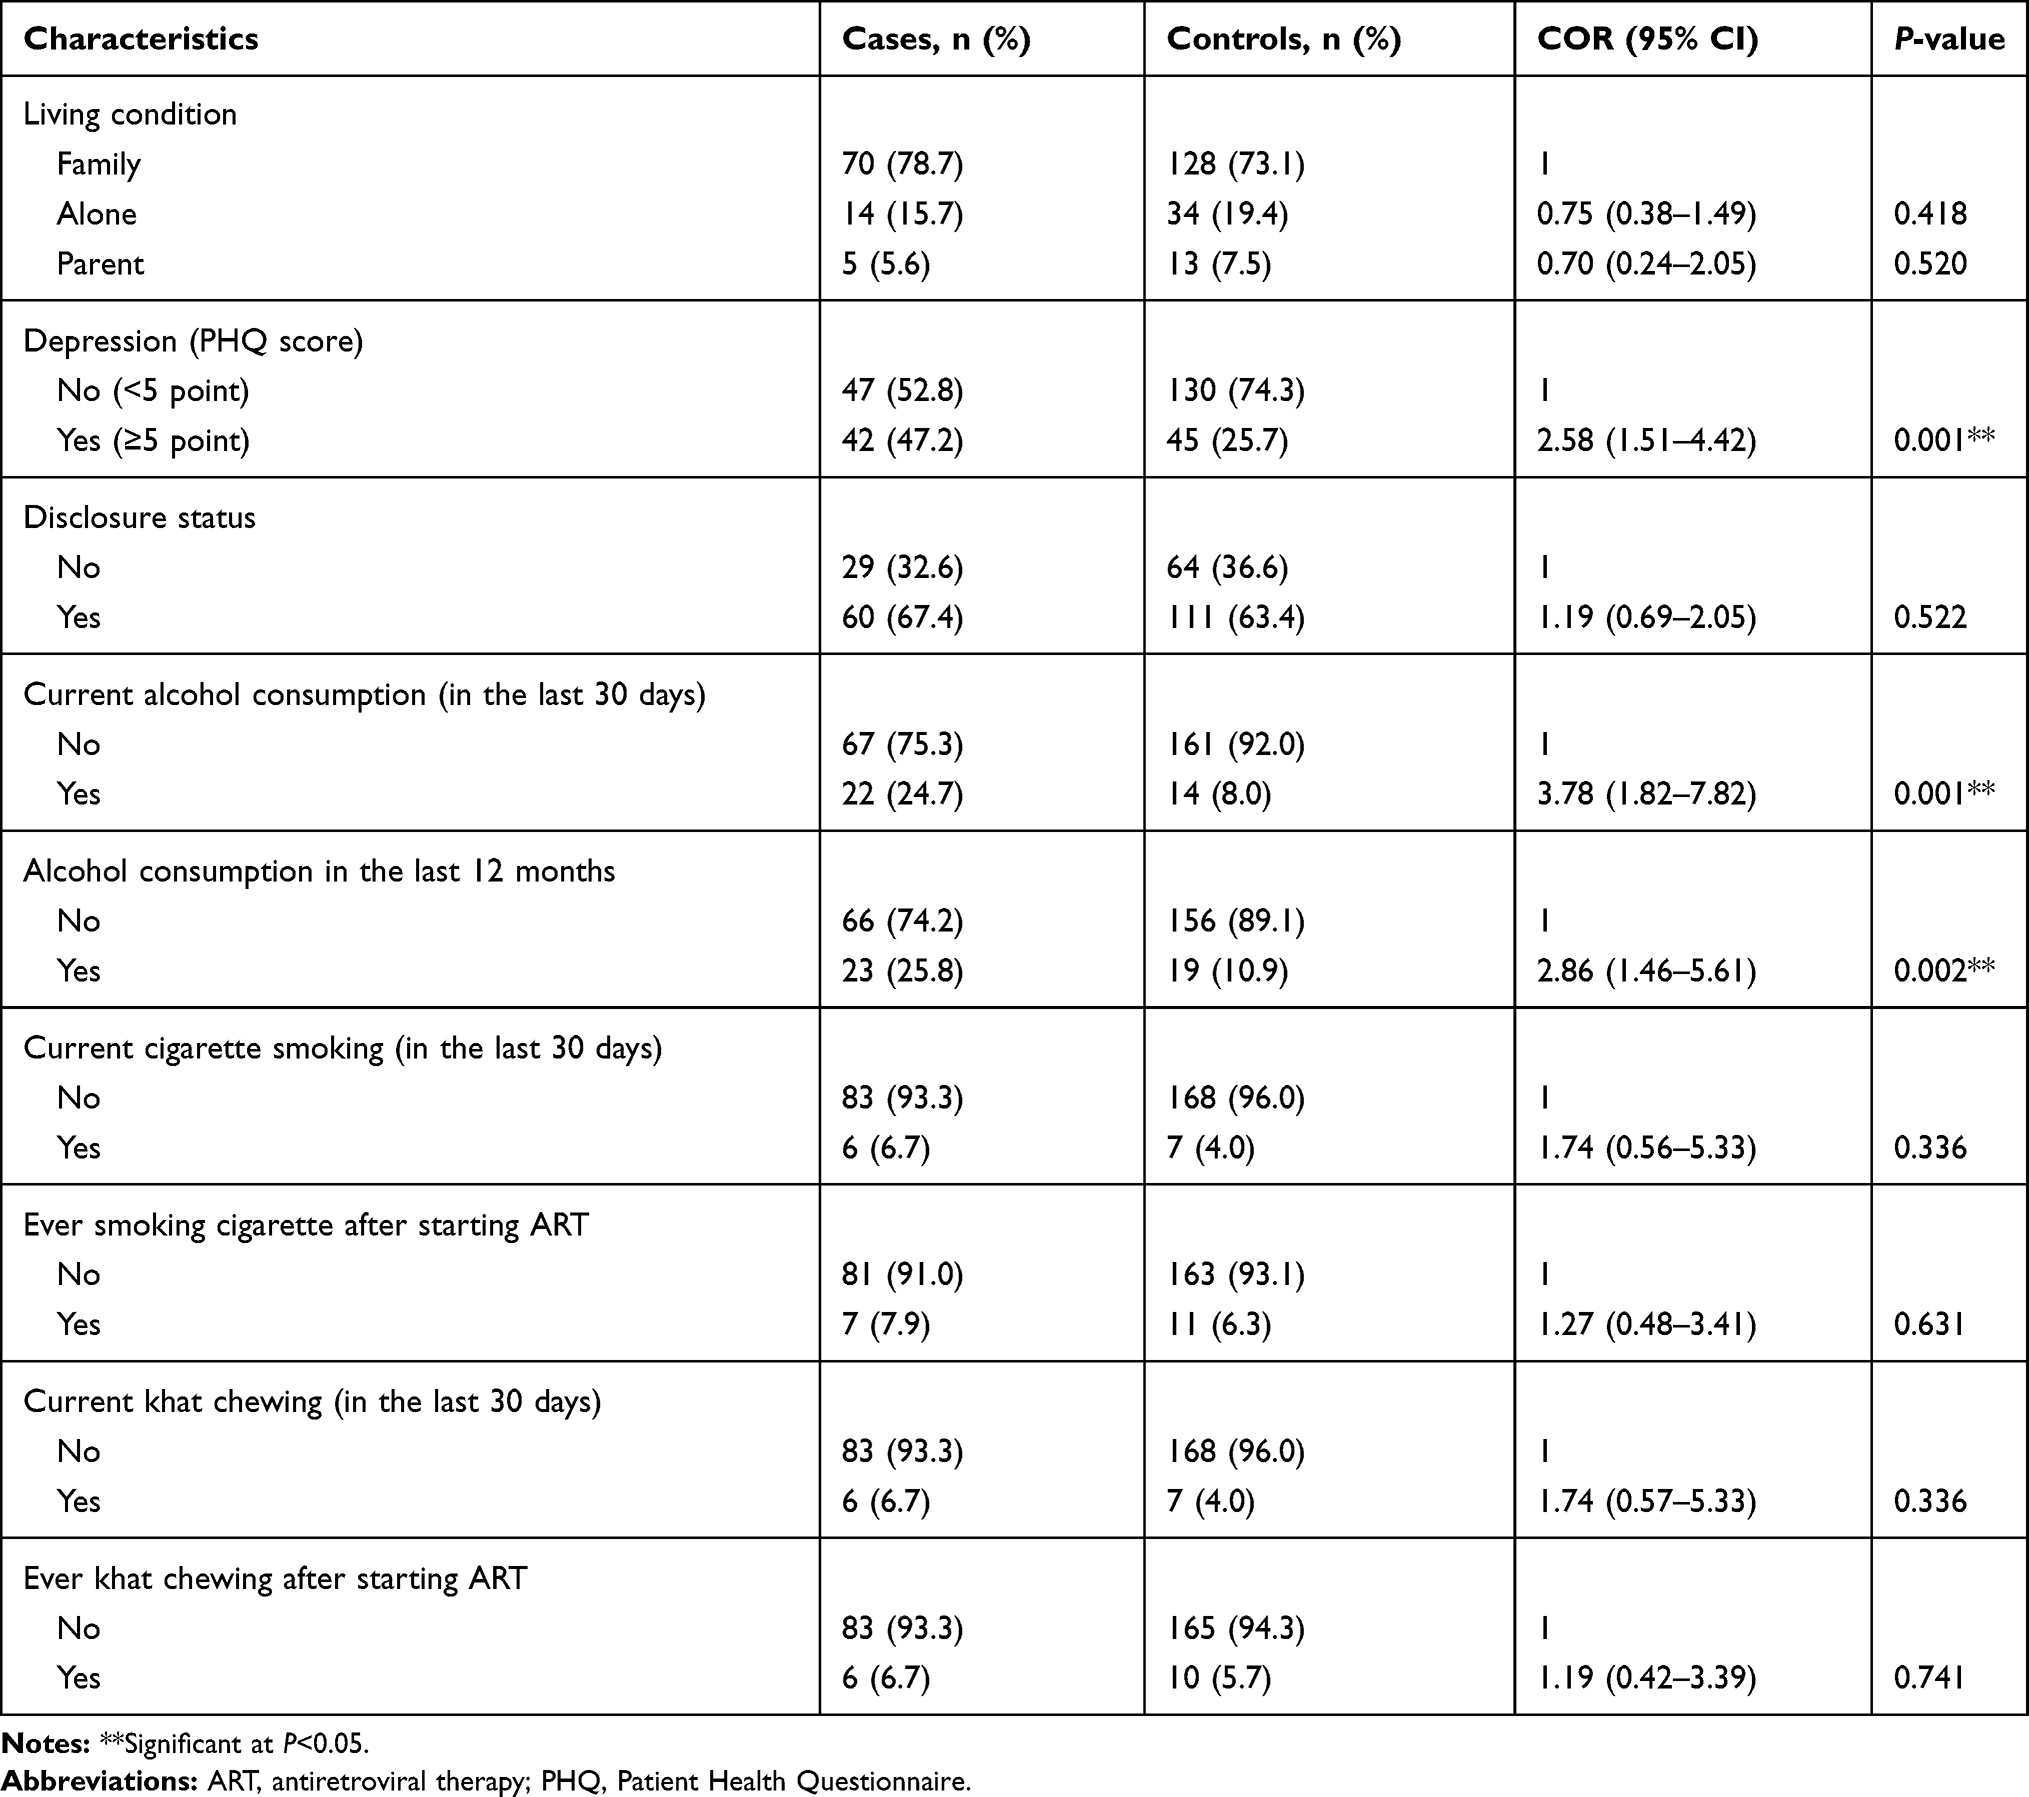 |
Table 3 Bivariable Logistic Regression of Psychosocial and Substance Use Characteristics Among Adult PLHIV and Attending ART at Goba Hospital, Bale Zone, Southeast Ethiopia, March 16 to May 26, 2019 |
Disease and Treatment-Related Factors
Under this category, four variables were significantly associated with undernutrition in PLHIV in bivariable logistic regression and selected for the final model. These include; non-adherence to ART and tuberculosis which is significantly associated with undernutrition in PLHIV at a P-value<0.05. In addition, CD4 cell count and anemia were other variables selected for multivariable logistic regression at a P-value<0.20 (Table 4).
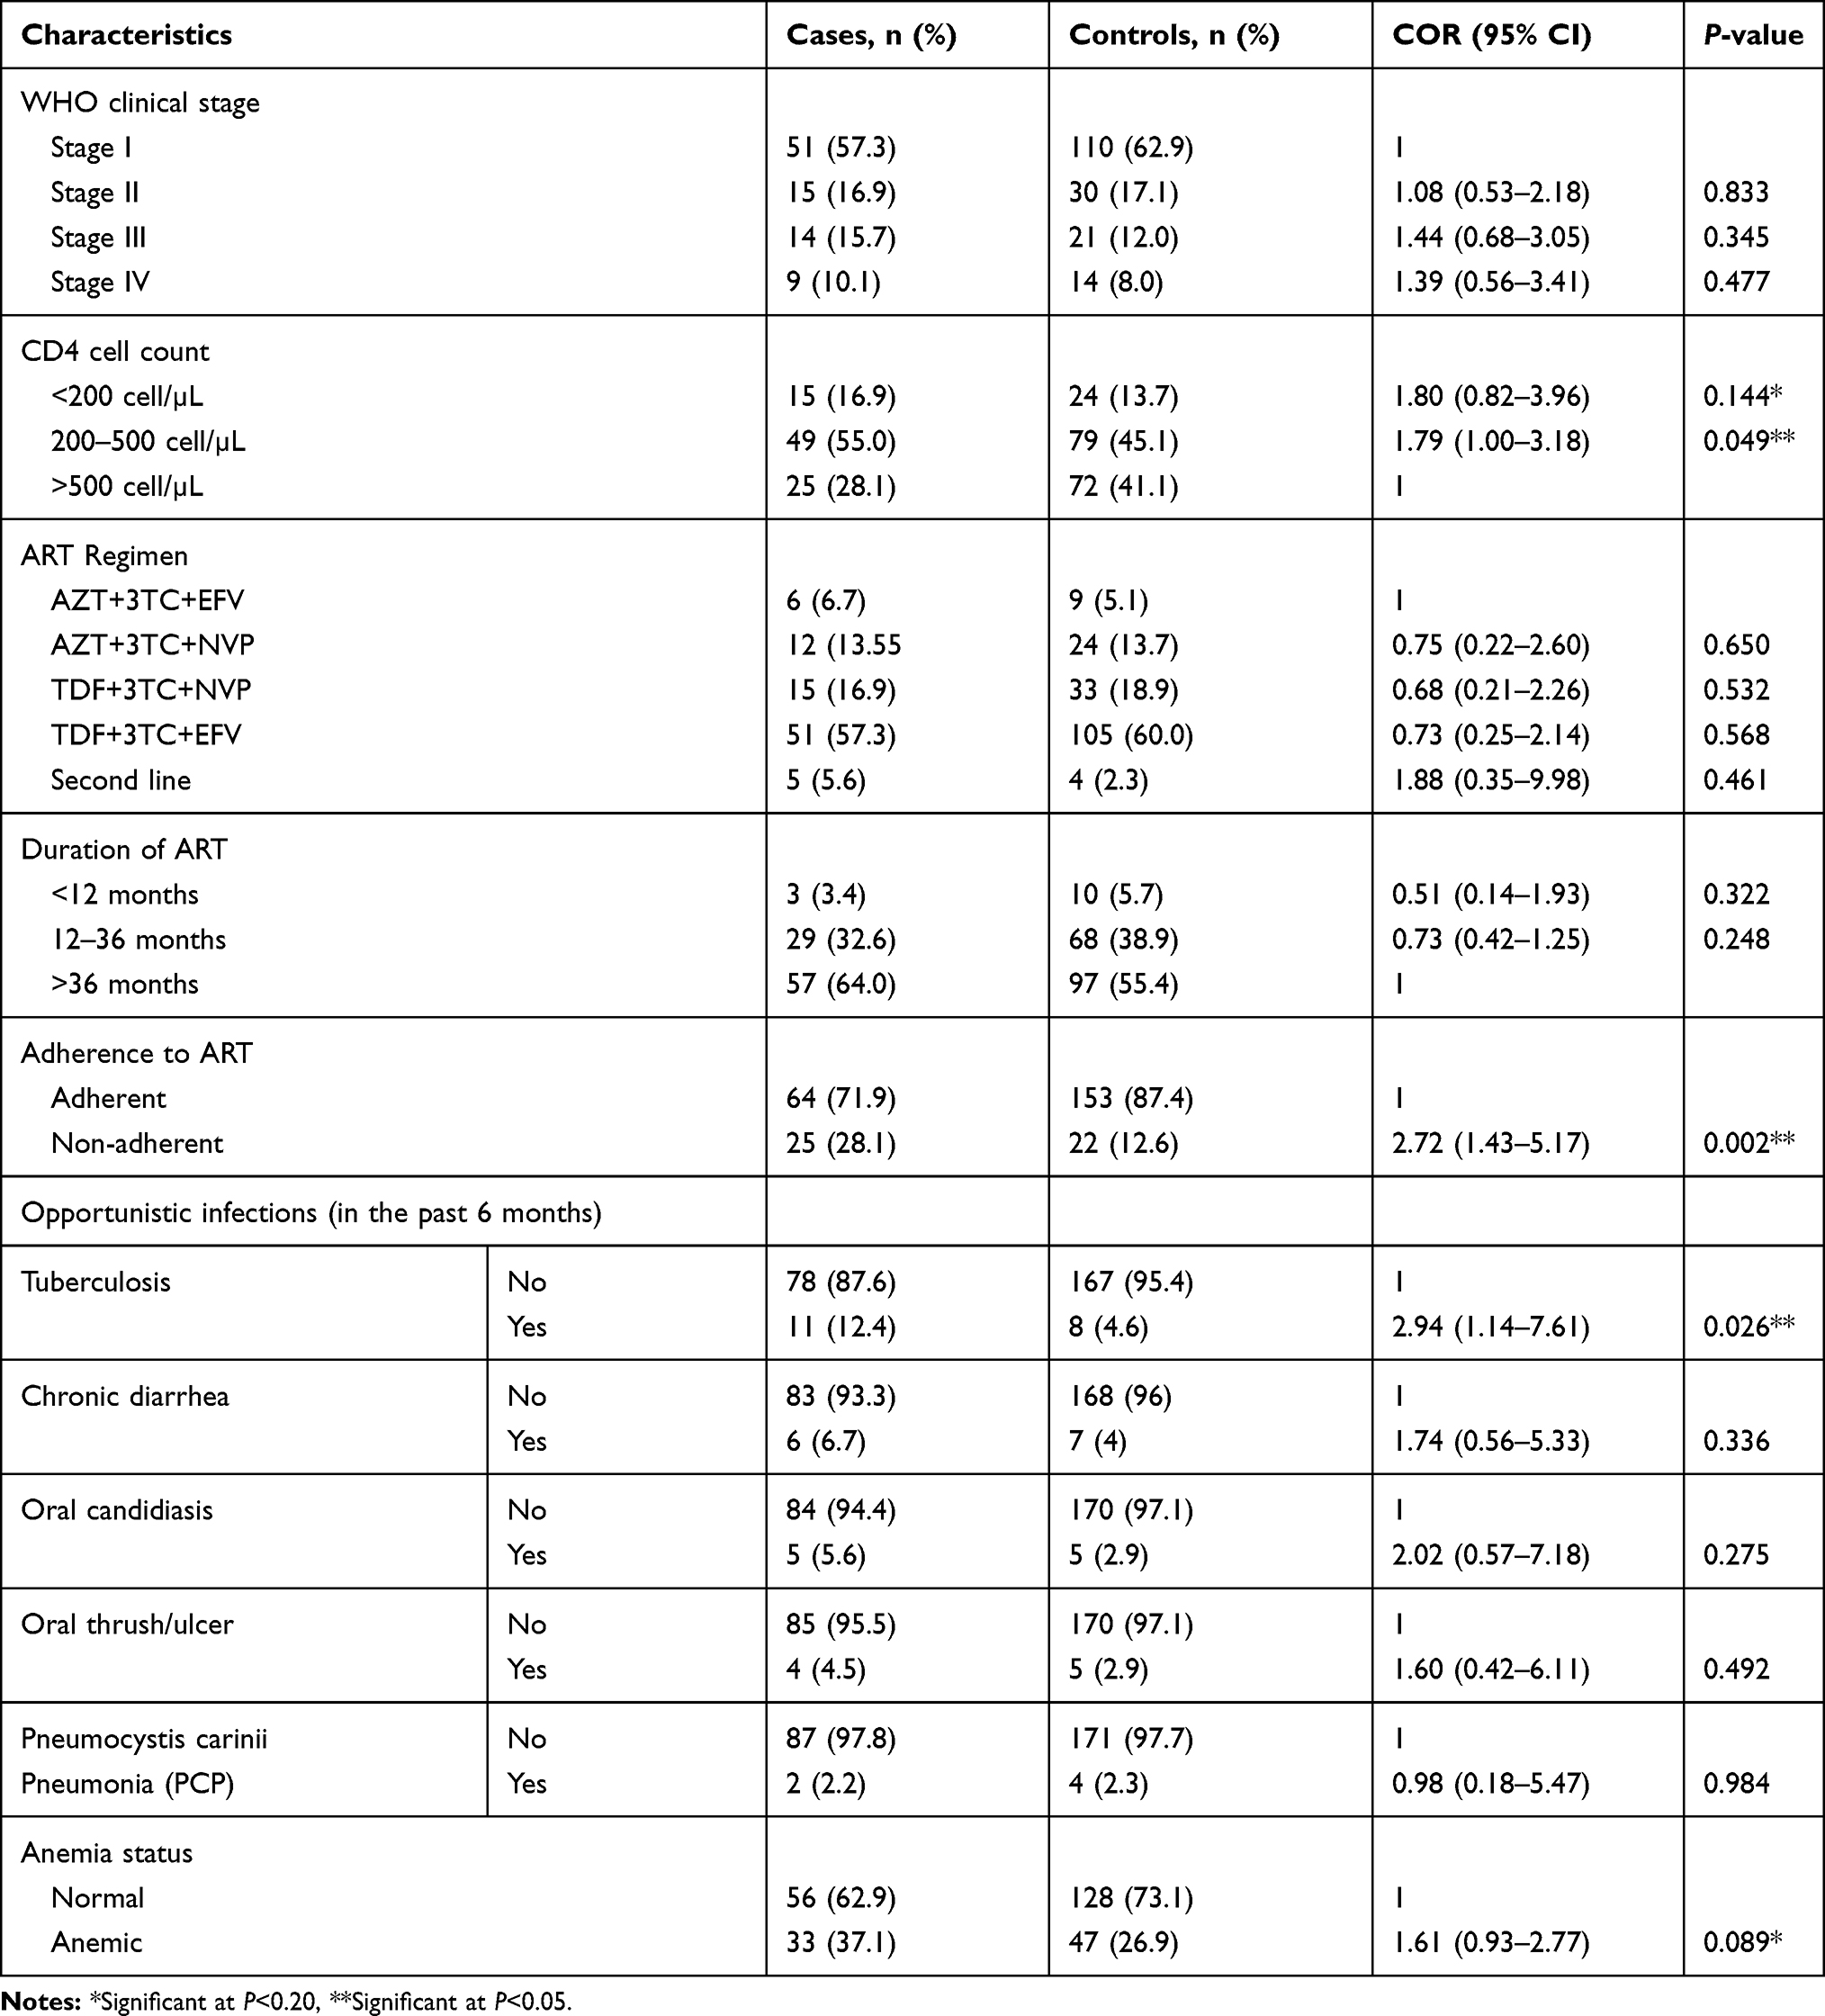 |
Table 4 Bivariable Logistic Regression of Disease and Treatment Relate Factors Among Adult PLHIV and Attending ART at Goba Hospital, Bale Zone, Southeast Ethiopia, March 16 to May 26, 2019 |
Factors Associated with Undernutrition in PLHIV
In multivariable logistic regression, four variables (household food insecurity, depression, current alcohol consumption and non-adherence to ART) were significantly associated with undernutrition in PLHIV. People living with HIV and enrolled on ART who were food insecure were 3-times more likely to be undernourished as compared to food secure (AOR=3.24, 95% CI=1.72–6.08). Similarly, people living with HIV and enrolled on ART who were depressed were 2-times higher at risk of being undernourished compared to the people without depression (AOR=2.07, 95% CI=1.16–3.72). The odds of being malnourished among PLHIV and enrolled in ART who currently consume alcohol were almost 4-times higher as compared to the non-alcohol consumers (AOR=3.80, 95% CI=1.71–8.43). In addition, people living with HIV who were non-adherent to ART were almost 3-fold at higher odds of being undernourished as compared to adherent individuals (AOR=2.61, 95% CI=1.28–5.30) (Table 5).
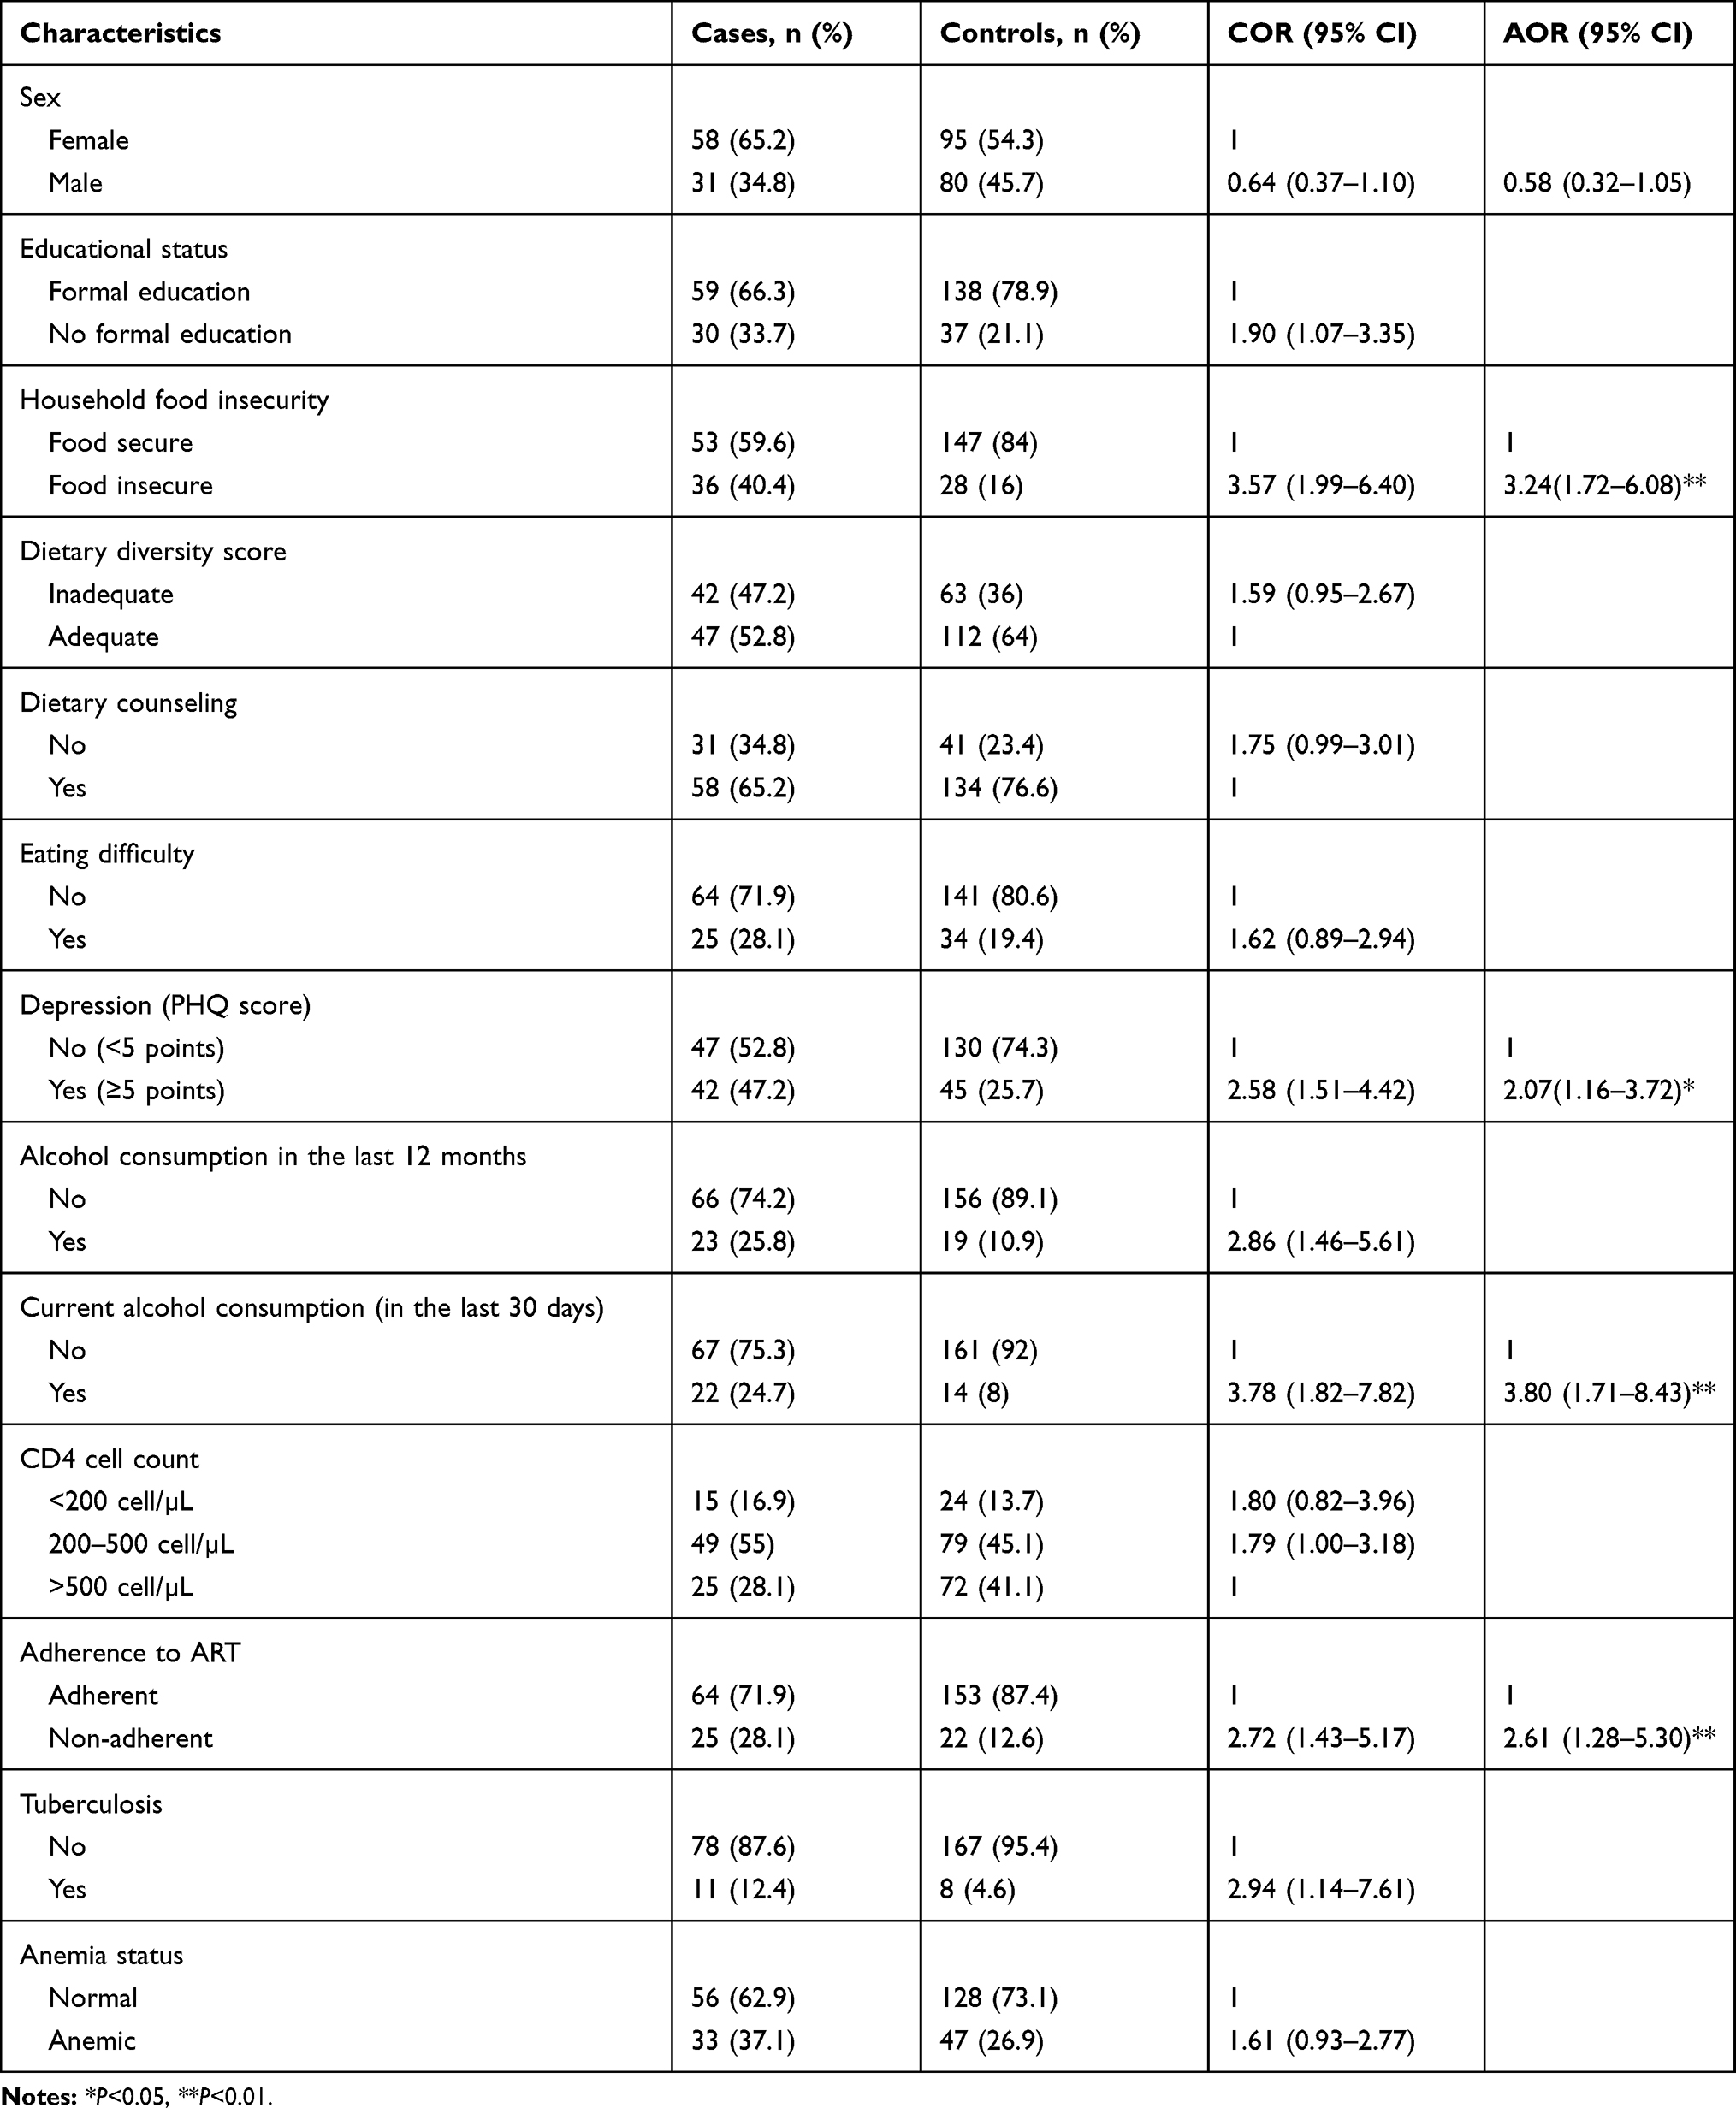 |
Table 5 Factors Associated with Undernutrition in Adult PLHIV Attending ART at Goba Hospital, Bale, Southeast Ethiopia, March 16 to May 26, 2019 |
Discussion
Malnutrition and HIV independently cause immune suppression, and one exacerbates the other by a vicious cycle and increases susceptibility to infection. This study focused on identifying the determinants of undernutrition among adult people living with HIV attending antiretroviral therapy in Goba Hospital. Results from this study showed that household food insecurity, depression, current alcohol consumption, and non-adherence to antiretroviral therapy were significantly associated with undernutrition among people living with HIV enrolled in ART.
There was a statistically significant positive association between undernutrition and household food insecurity in this study. People living with HIV and enrolled on ART who were food insecure were three times more likely to be undernourished as compared to food secure. This finding is consistent with a study conducted in East Harerghe,10 and West Shewa zone of Oromia region,15 Ethiopia, indicating that PLHIV who were food insecure have the highest odds of being undernourished. Similarly, our finding is supported by the study conducted in Hossana town of Ethiopia which showed the odds of undernutrition among PLHIV who were food insecure were more than 2-times higher as compared to food secure.43 Likewise, the study conducted in Nepal,6 and Zimbabwe,44 showed a positive association between household food insecurity and undernutrition. This could be due to the fact that lack of access to sufficient food to meet dietary needs for productive and healthy life, and it leads to deficiency of macro and micronutrients.1 Moreover, food insecure individuals are more vulnerable to poor quality and less nutritious foods.20 Evidences also suggested that food assistance was associated with improved food security, increased BMI, and improved adherence to ART.45,46 The implication of this finding is a need to establish and strengthen programs that target food assistance and nutritional support among PLHIV enrolled on ART.
Depression was significantly associated with undernutrition among PLHIV enrolled on ART. The odds of being undernourished among adults living with HIV and enrolled on ART who were depressed were 2-times higher for those without depression. This is in line with the finding of case control study conducted in the Central zone of Tigray, Northern Ethiopia, which shows the risk of malnutrition among PLHIV enrolled on ART who were depressed was almost 3-fold higher compared to their matched counterparts.27 Depression accelerates disease progression among people living with HIV, which can affect their appetite, food security status, and eventually results in malnutrition in particular and lower quality-of-life in general.47 It may also be due to the association of depression and substance use such as alcohol, khat, and cigarette smoking.46,48 Moreover, the finding of study conducted in Congo in 2016 revealed a positive association between depression and loss of appetite.8 This result implies the need to establish intervention and strengthen programs that target psychosocial problems and nutritional status in PLHIV.
Moreover, alcohol consumption which is a psychosocial substance was significantly associated with undernutrition among PLHIV. The odds of undernutrition among people living with HIV who currently consume alcohol were almost 4-times higher as compared to the non-alcohol consumers currently. This finding is consistent with the studies conducted in the Central zone of Tigray,27 and Jimma University Specialized Hospital,49 Ethiopia, which shows a positive association between alcohol consumption and undernutrition in PLHIV. Similarly, a study done in Rwanda reported that the consumption of alcohol associated with higher rates of food insufficiency.50 This could be due to the fact that alcohol use alters the metabolism of vitamins and minerals leading to poor nutritional outcomes.51 Besides this, it may also be due to the negative effect of alcohol on dietary intake due to reducing the effects of appetite.52 Moreover, it could also be due to the negative effect of alcohol consumption on ART adherence, which in turn results in bad diseases prognosis and malnutrition.52,53 This result implies the need to address substance use information that is psychosocial, like alcohol consumption during provision of counseling for adult PLHIV to prevent undernutrition.
Furthermore, non-adherent to antiretroviral therapy was positively associated with undernutrition in PLHIV. People living with HIV who were non-adherent to ART were almost 3-folds at higher odds of being undernourished as compared to adherent individuals. This is consistent with the finding of a case control study conducted in the central zone of Tigray, Northern Ethiopia, which shows PLHIV who were non-adherent to ART were about 6.8-times at higher odds of developing malnutrition.27 This could be due to the negative impact of poor ART adherence on viral suppression and disease progression which may eventually result in undernutrition.54 On the other hand, a case–control study conducted in Northern Ethiopia showed that people living with HIV enrolled on ART who were malnourished were by far more likely to be non-adherent to ART compared to their counterparts.53 This is further supported by the findings of a study conducted in Zambia which indicated that clinic-based food assistance is associated with increased medication adherence among adult PLHIV.55 Hence, both malnutrition and poor adherence can affect one another and their synergetic effect may result in poor viral suppression.55 The implication of this finding is adherence to ART and nutritional status of people living with HIV enrolled on ART should be considered in the HIV care and support programs.
The finding of this study implies the need to strengthen the strategies that target food assistance among undernourished adult PLHIV as per national guidelines and strengthening of counseling services on avoidance of psychosocial substances like alcohol consumption to prevent undernutrition by local government partners working on nutrition interventions. Healthcare providers are required to incorporate mechanisms of improving adherence to ART, sharing of psychosocial related pieces of information about depression and substance use during counselling, and growing support provided for adults attending the ART clinic. PLHIV should also avoid alcohol consumption and strictly adhere to antiretroviral therapy to prevent undernutrition.
Limitations of the Study
The findings of this study should be interpreted with some limitations. As a result of the case control study nature, the temporal relationships of events between explanatory variables and undernutrition cannot be determined. Recall bias and social desirability bias are also potential limitations that might have affected the accuracy of information, especially related to substance use, household food security scale, and 24 hours dietary recall. Some individuals might not accurately know their age and income. In addition, data on dietary intake may be affected by seasonal variation. Moreover, the findings of the current research cannot be generalized to the whole community, because of its institution-based nature.
Conclusions
Different factors were studied to identify the determinants of undernutrition among people living with HIV enrolled on ART. This study revealed that household food insecurity, depression, current alcohol consumption, and non-adherence to ART were the factors associated with undernutrition among people living with HIV enrolled in ART.
Therefore, strategies and programs that target food assistance besides nutritional supplementation need to be designed. Moreover, strategies and programs targeting PLHIV should consider psychosocial factors like depression and alcohol consumption. The nutrition assessment, counseling, and support provided for PLHIV should be further strengthened by Goba Referral Hospital, and efforts should be made to increase awareness of PLHIV regarding adherence to ART and no or minimal alcohol consumption. Finally, further longitudinal studies which determine the cause and effect relationship are recommended.
Data Sharing Statement
Data will be available upon reasonable request.
Ethics Approval
Ethical clearance was obtained from the Institutional Review Board (IRB) of Institute of Health, Jimma University (Ref.No./IHRPGD/596/2019) in accordance with Helsinki declarations for studies involving human subjects. Permission to conduct the study was taken from Bale Zone Health Bureau and Goba Referral Hospital. Written informed consent was obtained from each participant after explaining the purpose of the study. Participants were told that they had the full right to participate or not, discontinue the interview or measurement at any time, and they were also informed that all the data obtained from them would be kept confidential using codes instead of any personal identifiers.
Acknowledgments
We are thankful to Jimma University Institute of Health for their support. We are grateful to all the participants of the study for kindly giving their time to participate in this study. Additionally, we would like to acknowledge the Goba Hospital Medical Director, ART clinic staff, data collectors, and supervisor who devoted their valuable time and cooperate for the successful completion of this study.
Author Contributions
All authors made substantial contributions to the conception and design, acquisition of data, or analyses and interpretation of data; took part in drafting the article or revising it critically for important intellectual content; agreed on the journal to which the article will be submitted; gave final approval of the version to be published; and agree to be accountable for all aspects of the work.
Funding
This research received no specific finance from any funding agency.
Disclosure
The authors declare that they have no competing interests.
References
1. Pee SD, Semba RD. Role of nutrition in HIV infection: review of evidence for more effective programming in resource-limited settings, the United Nations University. Food Nutr Bull. 2010;31(4):S313–44. doi:10.1177/15648265100314S403
2. World Hunger Education Service. HIV/AIDS, Under-Nutrition and Food Insecurity. Washington DC; 2017.
3. World Health Organization. 2018 Malnutrition Fact Sheet. Geneva: WHO; 2018.
4. Uthman OA. Prevalence and pattern of HIV-related malnutrition among women in sub-Saharan Africa: a meta-analysis of demographic health. Int J Heal Sci. 2008;8(226):1–8.
5. Jesus P, Andrade TB, Oliveira NS, et al. Prevalence and Characteristics Associated with Malnutrition at Hospitalization among Patients with Acquired Immunodeficiency Syndrome in Brazil. PLoS One. 2012;7:11.
6. Thapa R, Amatya A, Pahari DP, et al. Nutritional status and its association with quality of life among people living with HIV attending public anti-retroviral therapy sites of KathmanduValley, Nepal. AIDS Res Ther. 2015;12:14.
7. Kabalimu TK, Sungwa E, Lwabukuna WC. Malnutrition and associated factors among adults starting on antiretroviral therapy at PASADA Hospital in Temeke District, Tanzania. Tanzan J Health Res. 2018;20:2.
8. Akilimali PZ, Musumari PM, et al. Depressive Symptoms, Loss of Appetite and Under Nutrition among Treated HIV Patients: A Cross Sectional Study in Goma, the Democratic Republic of Congo. J Nutr Heal Food Sci. 2017;4(2):1–10.
9. World Health Organization. HIV/AIDS: Global Health Observatory (GHO) Data. Geneva: WHO; 2018.
10. Dedha M, Damena M, Egata G, et al. Undernutrition and associated factors among adults human immunodeficiency virus positive on ART in hospitals, East Hararge Zone, Oromia, Ethiopia: A cross-sectional study. Int J Heal Sci. 2017;11(5):35–42.
11. Gizaw AB, Akililu E, Birhanu D. Malnutrition and Associated Factors among Adult People Living with HIV/AIDS Receiving Antiretroviral Therapy at Organization for Social Service Health Development in Jimma Town, Oromia Region, South West Ethiopia. Gen Med. 2018;6(2):4–11.
12. Haile A, Hailu M, Tesfaye E. Prevalence and associated factors of malnutrition among adult hospitalized patients at Amhara National Regional State Referral Hospitals, Ethiopia. Integr Obes Diabetes. 2015;1(3):80–83.
13. Hailemariam S, Bune GT, Ayele HT. Malnutrition: prevalence and its associated factors in People living with HIV/AIDS, in Dilla University Referral Hospital. Arch Public Heal. 2013;71(1):13. doi:10.1186/0778-7367-71-13
14. Tsegaye D, Yoseph H, et al. Under nutrition and associated factors among adult on highly active antiretroviral therapy in Wolaita Sodo teaching and referral hospital, southern nations nationalities peoples region, Ethiopia. Int J Nutr Metab. 2017;9(2):10–19. doi:10.5897/IJNAM2016.0208
15. Gebremichael DY, Hadush KT, et al. Food Insecurity, Nutritional Status, and Factors Associated with Malnutrition among PLHIV Attending ART therapy at Public Health Facilities in West Shewa Zone, Central Ethiopia. Biomed Res Int. 2018;5.
16. Gedle D, Gelaw B, Muluye D, Mesele M. Prevalence of malnutrition and its associated factors among adult people living with HIV/AIDS receiving anti-retroviral therapy at Butajira Hospital, southern Ethiopia. BMC Nutr. 2015;1(1):5. doi:10.1186/2055-0928-1-5
17. Ethiopian Public Health Institute. HIV Related Estimates and Projections for Ethiopia – 2017. Addis Ababa, Ethiopia: EPHI; 2017.
18. Jesson J, Leroy V. Challenges of malnutrition care among HIV-infected children on antiretroviral treatment in Africa. Med Mal Infect. 2015;45(5):149–156. doi:10.1016/j.medmal.2015.03.002
19. Ethiopian Federal Ministry of Health. National Guidelines for HIV/AIDS and Nutrition. Addis Ababa, Ethiopia: FMOH; 2008.
20. Joint United Nations Programme on HIV/AIDS (UNAIDS). Nutrition Assessment, Counselling and Support for Adolescents and Adults Living with HIV: A PROGRAMMING GUIDE. Geneva, Switzerland: UNAIDS; 2014.
21. International Food Policy Research Institute. Global Nutrition Report 2016: From Promise to Impact: Ending Malnutrition by 2030. Washington, DC: International Food Policy Research Institute; 2016.
22. World Health Organization. Global Update on HIV Treatment 2013: Results, Impact and Opportunities. Geneva, Switzerland: WHO; 2013.
23. Food and Nutrition Technical Assistance (FANTA). HIV/AIDS: A Guide for Nutrition, Care and Support. Washington DC; 2001.
24. World Health Organization. Nutrient Requirements for People Living with HIV/AIDS, Report of a Technical Consultation. Geneva, Switzerland: WHO; 2003.
25. Berhe N, Tegabu D, Alemayehu M. Effect of nutritional factors on adherence to antiretroviral therapy among HIV-infected adults: a case control study in Northern Ethiopia. BMC Infect Dis. 2013;13(1):233. doi:10.1186/1471-2334-13-233
26. Bitew BD, et al. Determinants of None-Adherence to Antiretroviral Therapy among HIV-Infected Adults in Arba Minch General Hospital, Gamo Gofa Zone, Southern Ethiopia: A Case Control Study. American Journal of Health Research. 2014;2(5):234–240. doi:10.11648/j.ajhr.20140205.13
27. Weldehaweria NB, Abreha EH, Weldu MG, et al. Psychosocial correlates of nutritional status among people living with HIV on antiretroviral therapy: A matched case-control study in Central zone of Tigray, Northern Ethiopia. PLoS One. 2017;112:3.
28. Gelaye B, William MA, et al. Validity of the Patient Health Questionnaire-9 for Depression Screening and Diagnosis in East Africa. Psychiatry Res. 2014;210:2.
29. Spitzer R, Kroenke K, Williams J. Patient Health Questionnaire (PHQ-9) Primary Care Study Group, Validation and utility of a self-report version of PRIME-MD: the PHQ primary care study. Int J Heal Sci. 2005;282:1737–1744.
30. Hussein FM, Ahmed AY, Muhammed OS. Household food insecurity access scale and dietary diversity score as a proxy indicator of nutritional status among people living with. PLoS One. 2018;13:6.
31. Coates J, Bilinsky P, Coates J. Household Food Insecurity Access Scale (HFIAS) for Measurement of Food Access: indicator Guide. Food Nutr Tech Assist III Proj. 2007;2:524.
32. Yohannis TH, Krawinkel M. Dietary Diversity Score: A Measure of Nutritional Adequacy or an Indicator of Healthy Diet? J Nutr Heal Sci. 2016;3(3):15–17.
33. Food and Agriculture Organizationand (FAO). Guidelines for Measuring Household and Individual Dietary Diversity. Rome, Italy; 2010.
34. World Health Organization. WHO STEPS Surveillance Manual: TheThe WHO STEPwise Approach to Chronic Disease Risk Factor Surveillance. Geneva: WHO; 2008.
35. Ethiopia Public Health Institute, FMOH. Ethiopia STEPS Report on Risk Factors for Non-Communicable Disease and Prevalence of Selected NCDs. Addis Ababa, Ethiopia; 2016.
36. Babor TF, Biddle-Higgins JC, Saunders JB, et al. The Alcohol Use Disorders Identification Test (AUDIT): Guidelines for Use in Primary Care. Geneva, Switzerland: World Health Organization; 2001.
37. Dagnaw WW, Yadeta D, et al. Guidelines on Clinical and Programmatic Management of Major Non Communicable Diseases. Addis Ababa, Ethiopia: FMOH; 2016.
38. Ethiopian Federal Ministry of Health. Ethiopia STEPS Survey 2015 Alcohol Consumption Fact Sheet. Addis Ababa, Ethiopia: FMOH; 2016.
39. Ethiopian Federal Ministry of Health. National Guidelines for Comprehensive HIV Prevention, Care and Treatment. Addis Ababa: FMOH; 2017.
40. World Health Organization. Haemoglobin Concentrations for the Diagnosis of Anaemia and Assessment of Severity. WHO.. 1–6. 2011.
41. Jamal ID. Multicollinearity and Regression Analysis. J Phys. 2071;949. doi:10.1088/1742-6596/949/1/012009
42. Bursac Z, Gauss CH, Williams DK, et al. Purposeful selection of variables in logistic regression. Source Code Biol Med. 2008;3(17). doi:10.1186/1751-0473-3-17.
43. Asnakew M, Hailu C, Malnutrition JH. Associated Factors among Adult Individuals Receiving Highly Active Antiretroviral Therapy in Health Facilities of Hosanna Town, Southern Ethiopia. Open Access Libr J. 2015;2:1289.
44. Takarinda KC, Mutasa-apollo T, et al. Malnutrition status and associated factors among HIV-positive patients enrolled in ART clinics in Zimbabwe. BMC Nutr. 2017;3:15.
45. Ivers L, Jerome G, Freedberg K. Food assistance is associated with improved body mass index, food security and attendance at clinic in an HIV program in central Haiti: a prospective observational cohort study. AIDS Res Ther. 2010;7(33):1–8.
46. De PS, Grede N, Mehra D, et al. The enabling effect of food assistance in improving adherence and/or treatment completion for antiretroviral therapy and tuberculosis treatment: a literature review. AIDS Behav. 2014;18(Suppl 5):531–541.
47. Riley ED, TB MK N, et al. Social, structural and behavioral determinants of overall health status in a cohort of homeless and unstably housed HIV-infected men. PLoS One. 2012;7:4.
48. Soboka M, Tesfaye M, Feyissa GT. Alcohol use disorders and associated factors among people living with HIV who are attending services in south west Ethiopia. BMC Res Notes. 2014;7:828.
49. Teshome MS, Gissa SB, Tefera BZ, et al. Undernutrition and its predictors among people living with HIV/AIDS attending antiretroviral therapy clinic in Jimma University Specialized Hospital. Int J Nutr Metab. 2017;9(9):67–74.
50. Sharma A, Hoover D. Relationship between body mass index and mortality in HIV-infected HAART users in the women’s interagency HIV study. PLoS One. 2015;10:12.
51. Agby G, Amedee A, Siggins R, et al. Alcohol and HIV Effects on the Immune System. Alcohol Res. 2015;37(2):287–297.
52. Molina P, Bagby G, Nelson S. Biomedical Consequences of Alcohol Use Disorders in the HIV Infected Host Invited Review. Curr HIV Res. 2014;12(4):265–275.
53. Demeke B, Chanie T. Adherence to antiretroviral therapy and associated factors among patients living with HIV/AIDS in Dessie Referral Hospital, Northern Ethiopia. Int J Pharma Sci Res. 2014;5(8):572–581.
54. Kalichman S, Washington C, Grebler T, et al. Medication Adherence and Health Outcomes of People Living with HIV Who Are Food Insecure and Prescribed Antiretrovirals That Should Be Taken with Food. Infect Dis Ther. 2015;4(1):79–91.
55. Tirivayi N, Koethe JR, Groot W, et al. Clinic-Based Food Assistance is Associated with Increased Medication Adherence among HIV-Infected Adults on Long-Term Antiretroviral Therapy in Zambia. J AIDS Clin Res. 2012;3(7):171.
 © 2020 The Author(s). This work is published and licensed by Dove Medical Press Limited. The
full terms of this license are available at https://www.dovepress.com/terms
and incorporate the Creative Commons Attribution
- Non Commercial (unported, 3.0) License.
By accessing the work you hereby accept the Terms. Non-commercial uses of the work are permitted
without any further permission from Dove Medical Press Limited, provided the work is properly
attributed. For permission for commercial use of this work, please see paragraphs 4.2 and 5 of our Terms.
© 2020 The Author(s). This work is published and licensed by Dove Medical Press Limited. The
full terms of this license are available at https://www.dovepress.com/terms
and incorporate the Creative Commons Attribution
- Non Commercial (unported, 3.0) License.
By accessing the work you hereby accept the Terms. Non-commercial uses of the work are permitted
without any further permission from Dove Medical Press Limited, provided the work is properly
attributed. For permission for commercial use of this work, please see paragraphs 4.2 and 5 of our Terms.