Back to Journals » Patient Preference and Adherence » Volume 9
Determinants of medication adherence among adults with type 2 diabetes mellitus in three Malaysian public health clinics: a cross-sectional study
Authors Chew B ![]() , Hassan N, Sherina M
, Hassan N, Sherina M
Received 26 January 2015
Accepted for publication 6 March 2015
Published 6 May 2015 Volume 2015:9 Pages 639—648
DOI https://doi.org/10.2147/PPA.S81612
Checked for plagiarism Yes
Review by Single anonymous peer review
Peer reviewer comments 5
Editor who approved publication: Dr Johnny Chen
Video abstract presented by Boon-How Chew
Views: 770
Boon-How Chew,1 Noor-Hasliza Hassan,2 Mohd-Sidik Sherina3
1Department of Family Medicine, Faculty of Medicine and Health Sciences, Universiti Putra Malaysia, 2Klinik Kesihatan Dengkil, Ministry of Health, 3Department of Psychiatry, Faculty of Medicine and Health Sciences, Universiti Putra Malaysia, Serdang, Malaysia
Abstract: Medication adherence (MA) in adults with type 2 diabetes mellitus (T2D) is associated with improved disease control (glycated hemoglobin, blood pressure, and lipid profile), lower rates of death and diabetes-related complications, increased quality of life, and decreased health care resource utilization. However, there is a paucity of data on the effect of diabetes-related distress, depression, and health-related quality of life on MA. This study examined factors associated with MA in adults with T2D at the primary care level. This was a cross-sectional study conducted in three Malaysian public health clinics, where adults with T2D were recruited consecutively in 2013. We used the 8-item Morisky Medication Adherence Scale (MMAS-8) to assess MA as the main dependent variable. In addition to sociodemographic data, we included diabetes-related distress, depressive symptoms, and health-related quality of life as independent variables. Independent association between the MMAS-8 score and its determinants was done using generalized linear models with a gamma distribution and log link function. The participant response rate was 93.1% (700/752). The majority were female (52.8%), Malay (52.9%), and married (79.1%). About 43% of patients were classified as showing low MA (MMAS-8 score <6). Higher income (adjusted odds ratio 0.90) and depressive symptoms (adjusted odds ratio 0.99) were significant independent determinants of medication non-adherence in young adults with T2D. Low MA in adults with T2D is a prevalent problem. Thus, primary health care providers in public health clinics should focus on MA counselling for adult T2D patients who are younger, have a higher income, and symptoms of depression.
Keywords: medication adherence, type 2 diabetes mellitus, quality of life, distress, depression, primary care
Introduction
The literature has shown that better medication adherence (MA) is associated with improved disease control (glycated hemoglobin [HbA1c], blood pressure, and lipid profile)1 and decreased health care resource utilization in patients with type 2 diabetes mellitus (T2D).2 This has translated into lower health care costs, lower hospitalization rates, fewer diabetes-related complications, increased quality of life, and a lower incidence of death.2–5 In patients with T2D in Denmark,6 a greater proportion of variance in HbA1c levels was related to medication (15.6%) when compared with patients’ sociodemographic characteristics, behavior, perceptions of care, and diabetes-related distress (DRD), which accounted for only 14% of the total variance. The data also show that for every 25% increase in MA, a patient’s HbA1c is reduced by 0.34%.7
However, adherence to medical therapy in general and adherence to medication in particular have posed significant challenges to both health care systems and patients. The prevalence of poor adherence to medication, appointments, screening, diet, exercise, and health behavior is reported to be 30%–40%.8,9 Common reasons for this include the complexity of the drug regimen, fear of side effects, and misperceptions about T2D as an illness.10 Other possible reasons include financial constraints and poor social support for refilling prescriptions,8,11 physical and psychological restrictions affecting daily adherence to prescribed medications, and in particular, increased comorbidity,12 such as complications of T2D,11 visual impairment, diabetic foot problems, health literacy,13 cognitive decline,14 DRD, and depression.15 Physician characteristics and health care settings are other potential factors that may affect patient participation in decision-making16,17 and MA.18,19
MA is usually defined as the extent to which patients follow the instructions given for prescribed medications.20 Methods used to assess MA include pill counts, pharmacy claims, or refill records, as well as subjective assessment of patient-reported adherence.3 However, there is no consensual standard as to what constitutes adequate adherence; many consider pill count or refill rates >80% to be acceptable.3 Nevertheless, self-reported measures of MA have been increasingly shown to be reliable and valid,21 so are being used increasingly in clinical trials.
Realizing the importance of MA as mentioned above, the opportunity for early disease control in patients with T2D, and the need to prioritize our limited health care resources in the face of the rising T2D epidemic, this study examined the determinants of medication non-adherence in adults with T2D attending public health clinics in Malaysia. We addressed the issue of MA taking into account the effects of DRD, depression, and health-related quality of life (HRQoL) in addition to other sociodemographic and clinical variables. To the best of our knowledge, there is a paucity of data on the association between these variables and MA,2 particularly in an Asian health care setting like Malaysia. Previous similar local studies have not included either DRD or MA,1,22 or used more general measures for stress or health status (eg, the Short Form-36) and not HRQoL measures.23,24 It is hoped that this diagnosable condition of medication non-adherence can become more treatable25 by health care providers based on the findings of this study.
Materials and methods
This study was part of EDDMQoL, a larger cross-sectional study on emotional burden and its effect on disease control, MA, and HRQoL in patients with T2D. The study was conducted from 2012 to 2013. In addition to a questionnaire on demography (age, sex, ethnicity, religion, marital status, educational level, occupation, monthly income), smoking status, and frequency of exercise, we used another structured case record form to capture comorbidity (hypertension and hyperlipidemia/dyslipidemia), diabetes-related complications, duration of diabetes, HbA1c, blood pressure, lipids, number and types of medications used, and MA. In addition to these, we used three additional questionnaires to measure DRD, depression, and HRQoL. These questionnaires were prepared in three languages, ie, English, Malay, and Mandarin.
Setting
Participants were recruited from three public health clinics (Seri Kembangan, Dengkil, and Salak) in Malaysia. These health clinics were specifically chosen because they differ in terms of the characteristics of the patients they serve and the geographical regions in which they are situated. The Seri Kembangan Health Clinic is in an urban area located in the vicinity of Chinese communities, so is visited mainly by Chinese patients. Dengkil Health Clinic is a rural center frequented by larger proportions of Malaysians of Indian origin than for a regular public health clinic. Salak Health Clinic is a rural center in a mainly Malay residential area. The variability of the sites provided a broad range of Asian patients with T2D.
Participants
We consecutively sampled all patients with T2D who came to the clinics for their routine care. The minimum patient age was 30 years and all patients had been diagnosed with T2D more than a year previously. Their records needed to show that they were on regular follow-up, with at least three visits in the past one year and blood tests done within the previous 3 months. We excluded patients who were pregnant or lactating, those who had psychiatric/psychological disorders that could impair judgment and memory, and patients who could not read or understand English, Malay, or Mandarin. Patients who fulfilled the inclusion criteria were approached and informed of the study. Written consent was secured before they answered the questionnaires in the language of their preference. Trained research assistants interviewed patients in their language of preference. Face validity testing in ten patients found the questionnaires to be acceptable and understood without difficulty. This study was approved by the medical research ethics committee at the Ministry of Health, Malaysia.
Medication adherence
The 8-item Morisky Medication Adherence Scale (MMAS-8) enquires about a patient’s experiences with medications during the 2 weeks prior to answering the questionnaire.26 This questionnaire has been translated into different languages so that it can be used with ease among patients in different settings. All the items except item 5 are reverse-coded (no, 0; yes, 1). Item 8 has five options scored in a negative direction from 1 (never) to 5 (always). Items 1–4 and 6–8 are reverse-coded, and item 8 is further divided by 4 when calculating a summated score. The total scale has a range of 0–8, including low adherence (<6), medium adherence (6–7), and high adherence (8). The MMAS-8 scale is reliable (Cronbach’s α=0.83), with a sensitivity of 93% and a specificity of 53%, and is available in the Malay and Chinese languages.26–28 The Malay version of the MMAS-8 showed moderate internal consistency (Cronbach’s α=0.675), and had a test–retest reliability of 0.82 (P<0.001). A significant relationship was found between MMAS-8 categories and HbA1c categories (χ2=20.261; P≤0.001). The Chinese version of the MMAS-8 was also reported to have satisfactory psychometric properties, ie, good internal consistency (Cronbach’s α=0.77) and test–retest reliability (r=0.88, P<0.001).28 Following face validity testing in ten patients, some modifications to the wording of items in the questionnaire were done to refine them and improve understanding.
Health-related quality of life
The World Health Organization Quality of Life-Brief (WHOQOL-BREF)29 produces four HRQoL domains and scores, ie, a physical domain, a psychological domain, a social relationships domain, and an environment domain.29 This four-domain structure, which has a comparative fit index of 0.901, demonstrates good internal consistency, with Cronbach’s α values for each of the four domain scores ranging from 0.66 (for social relationships domain) to 0.84 (for physical domain). There are also two items that are examined separately, ie, question 1, which asks about an individual’s overall perception of quality of life, and question 2, which asks about an individual’s overall perception of his or her health. Domain scores are scaled in a positive direction (ie, higher scores denote higher quality of life).30 Where more than 20% of the data are missing from an assessment, the assessment is discarded. Where up to two items are missing, the mean of the other items in the domain is substituted. Where more than two items are missing from the domain, the domain score is not calculated (with the exception of social relationships domain, where the domain should only be calculated if one or less item is missing). The mean score of items within each domain is used to calculate the domain score. Mean scores are then multiplied by 4 in order to make domain raw scores comparable with the scores used in the WHOQOL-100. The WHOQOL-BREF was shown to be comparable with the WHOQOL-100 in discriminating between ill and well groups. There are high correlations between domain scores based on the WHOQOL-100 and domain scores calculated using items included in the WHOQOL-BREF.29 These correlations ranged from 0.89 (for social relationships domain) to 0.95 (for physical domain). The Malay and Chinese versions of this questionnaire were previously validated and are reported to have satisfactory psychometric properties.31,32
Diabetes-related distress
DRD was measured using the validated 17-item Diabetes Distress Scale (DDS-17).33–35 This instrument assesses problems and difficulties related to diabetes during the past month on a Likert scale from 1 (not a problem) to 6 (a very serious problem).33 Internal reliability of the DDS-17 and the four subscales are adequate (Cronbach’s α>0.87), and validity coefficients yield significant linkages with the Center for Epidemiological Studies Depression Scale, meal planning, exercise, and total cholesterol.33 DDS-17 has been found to have adequate and better psychometric properties compared with other similar scales.34 A mean total score of less than 2.0 indicates little to no distress, a score between 2.0 and 2.9 indicates moderate distress, and 3.0 and greater is considered high distress worthy of clinical attention.36 Those in the moderate and high distress groups have been found to have poorer behavioral and clinical outcomes. A local translation and validation study of the Malay version of the DDS-17 showed high internal consistency (Cronbach’s α=0.94), and the test–retest reliability value was 0.33 (P=0.009). There was a significant relationship between the mean DDS-17 item score categories (<3 versus ≥3) and HbA1c categories (<7% versus ≥7%); χ2=4.20; P=0.048). The Chinese version of the DDS contains 15 items and was found to have good psychometric properties; the Cronbach’s α for internal consistency was 0.90 and the test–retest reliability coefficient was 0.74.35 However, we included all the 17 items in this study in accordance with the original author’s recommendation.
Depression
Depression was defined using the 9-item Patient Health Questionnaire (PHQ-9), which has been shown to have good construct and criterion validity in making the diagnosis and assessing the severity of depression.37–39 The PHQ-9 refers to symptoms experienced by patients during the last 2 weeks (eg, “thoughts that you would be better off dead or of hurting yourself in some way”). The PHQ-9 has nine items that are scored from 0 (not at all) to 3 (nearly every day), giving a total score that ranges from 0 to 27. The PHQ-9 has cut-off points at scores of 5, 10, 15, and 20, representing mild, moderate, moderately severe, and severe depression, respectively. A total score of ≥10 indicates a sensitivity of 88% and a specificity of 89% for major depression.37 The Malay version of the PHQ-9 had been locally validated and found to have a sensitivity of 87% (95% confidence interval [CI] 71–95), a specificity of 82% (95% CI 74–88), a positive likelihood ratio of 4.8 (3.2–7.2), and a negative likelihood ratio of 0.16 (0.06–0.40).38 The Chinese version of the PHQ-9 is reported to have good psychometric properties, with an internal consistency of 0.82 and test–retest reliability over a 2-week interval of 0.76.39
Clinical variables
T2D was defined as present when the patients’ case records showed the following criteria: documented diagnosis of diabetes mellitus according to the 1999 World Health Organization criteria,40 current treatment consisting of lifestyle modification, or on oral antihyperglycemic agents or insulin. Hypertension is diagnosed if systolic blood pressure is ≥130 mmHg or diastolic blood pressure is ≥80 mmHg on each of two successive readings obtained by the clinic physician.41 A blood pressure <130/80 mmHg was regarded as controlled, and this was the mean of two readings in the rested position with the arm at heart level, using a cuff of appropriate size. Hyperlipidemia refers to an increase in concentration of one or more plasma or serum lipids, usually cholesterol and triglycerides, and the term dyslipidemia is used for either an increase or decrease in concentration of one or more plasma or serum lipids (low-density lipoprotein cholesterol >2.6 mmol/L, triglycerides >1.7 mmol/L, and high-density lipoprotein cholesterol <1.1 mmol/L). Body mass index is calculated as weight divided by height squared. Low-density lipoprotein-cholesterol ≤2.6 mmol/L and HbA1c ≤6.5% are regarded as the other treatment targets.41,42 These clinical data were retrieved from the patient’s medical record using a case record form on the day that the patient completed the questionnaires.
Diabetes-related complications
There were five diabetes-related complications in this study; three were classified as microvascular complications, comprising retinopathy, nephropathy, and diabetic foot problems, and two were classified as macrovascular complications, ie, ischemic heart disease and cerebrovascular disease or stroke. These complications were retrieved from patient records. Diagnoses of these complications were made or confirmed by the attending physician at the clinic based on medical symptoms, laboratory results, radiological evidence, and treatment history at the clinic and other hospitals. Nephropathy was diagnosed as the persistent presence (on two or more occasions at least 3 months apart) of any of the following: microalbuminuria, proteinuria, serum creatinine >150 mmol/L, or estimated glomerular filtration rate <60 mL per minute (calculated using the Cockcroft-Gault formula). Diabetic foot problems comprised foot deformity that is related to the lower limbs muscle weakness and/or as a consequence of the other diabetic foot problems, current ulcer, amputation, peripheral neuropathy, or peripheral vascular disease.
Statistical analysis
The sample size was calculated using G*Power 3.1.2 software,43 with an estimated effect size of r=0.16 between DRD and HbA1c,44,45 a power of 0.95, and significance at 0.05; the estimated sample size was 500. Taking into consideration about 30% of data being incomplete/missing in patient medical records and 30% of questionnaires returned from patients being incomplete, the sample size needed was 650.
Quantitative data analyses were done using PASW version 21.0 (SPSS Inc, Chicago, IL, USA). Differences in the categorical variables were performed using the Chi-squared test. P<0.05 was considered to be significant at two tails. To analyze the association of the demographic and clinical variables and MA, generalized linear models were used with MMAS-8 total score as the outcome variable. Since the MMAS-8 total score was skewed to the left, a generalized linear model with a gamma distribution and log link function was used. The gamma distribution is a reasonable choice because its flexible distribution accommodates well for positive and continuous variables and it incorporates the assumption that the standard deviation is proportional to the mean. Univariable analyses were done for the independent variables and those that showed significant effects on the MMAS-8 total scores were included in the final multivariable generalized linear model analyses. In the final model, normality of residual was confirmed, as residual plots indicated fulfilment of linearity and homogeneity assumptions, and model fitting encountered no obvious problem as evidenced by the residual deviance being less than the residual degree of freedom.
Results
The participant response rate was 93.1% (700/752). From this number of participants, we had 668 completed MMAS-8 questionnaires. More than half were female (52.8%) and Malay (52.9%, Table 1). The majority were married or living with a partner (79.1%), had non-tertiary education (89.1%), and were earning <RM 3,000 per month (94.4%); most of the patients were non-smokers and undertook some exercise; about 80% reported having hypertension but antihypertensive usage was almost 90% (Table 1).
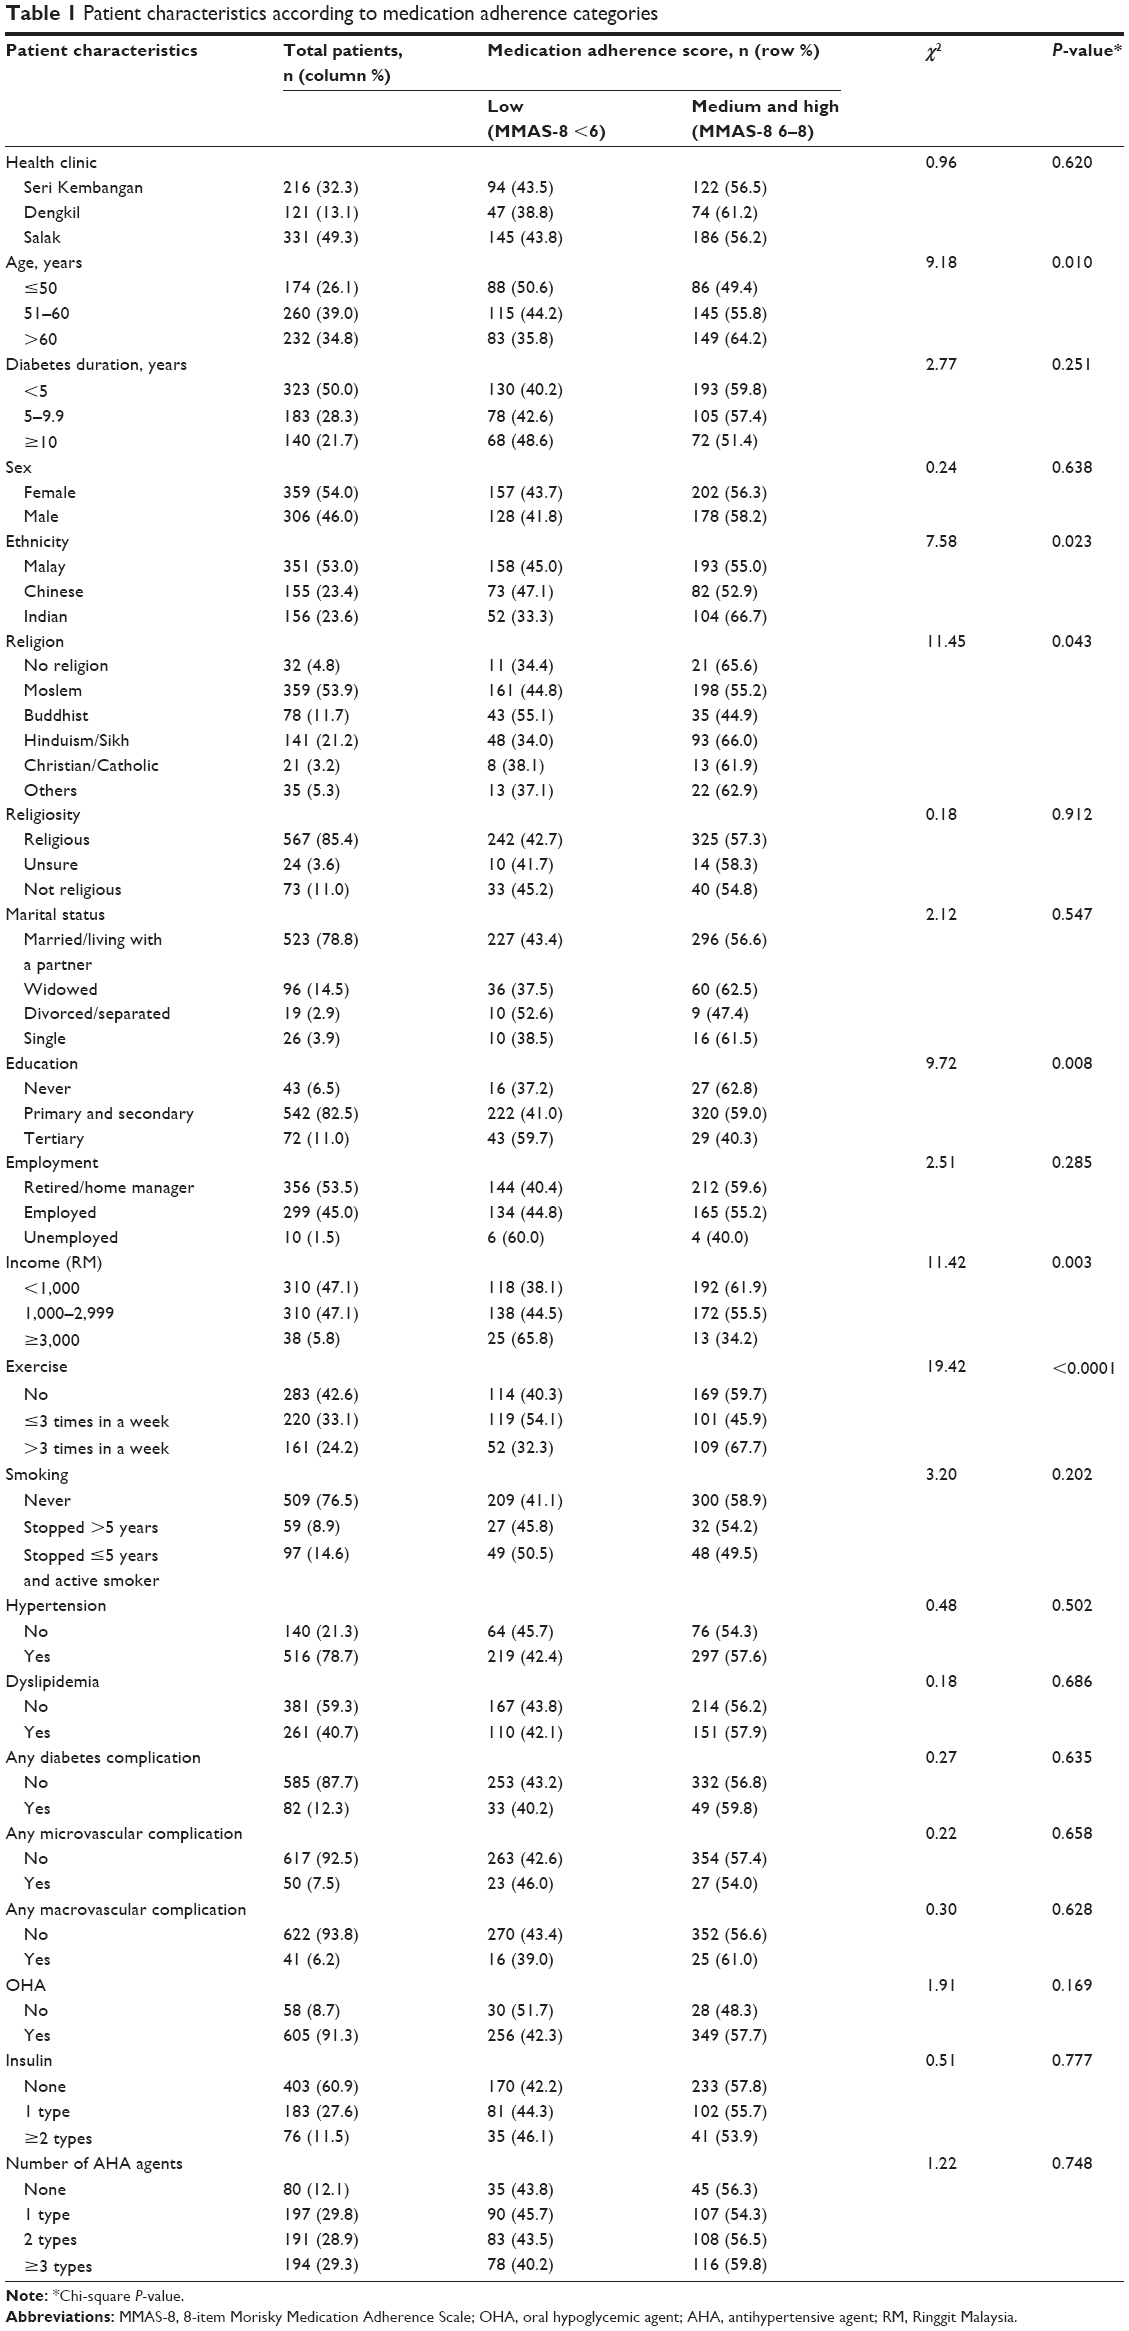 | Table 1 Patient characteristics according to medication adherence categories |
Figure 1 shows the distribution of the total MMAS-8 score. About 43% and 57% of the patients were classified as low (MMAS-8 score <6) and medium to high (MMAS-8 score 6–8) MA categories, respectively. The mean (± standard deviation) for age was 56.9±10.18 years. The median (interquartile range) scores for the DDS-17, PHQ-9, duration of diabetes, hypertension, and dyslipidemia were 33.0 (24.00 to 47.00), 4.0 (1.00 to 7.00), 4.0 (3.00 to 9.00), 5.0 (3.00 to 9.00) and 3.0 (2.00 to 6.00), respectively.
 | Figure 1 Distribution of MMAS-8 total score. |
Table 2 shows the univariable (crude odds ratio) and multivariable (adjusted odds ratio) analyses for the significant variables. It was observed that younger age, Malay ethnicity, higher income, higher education, exercise ≤3 times per week, lower overall HRQoL, higher DRD, and depressive symptoms were associated with poor MA. After adjustment for all these variables, being a younger adult with T2D, higher income, and depressive symptoms were significant independent determinants of non-adherence with medication.
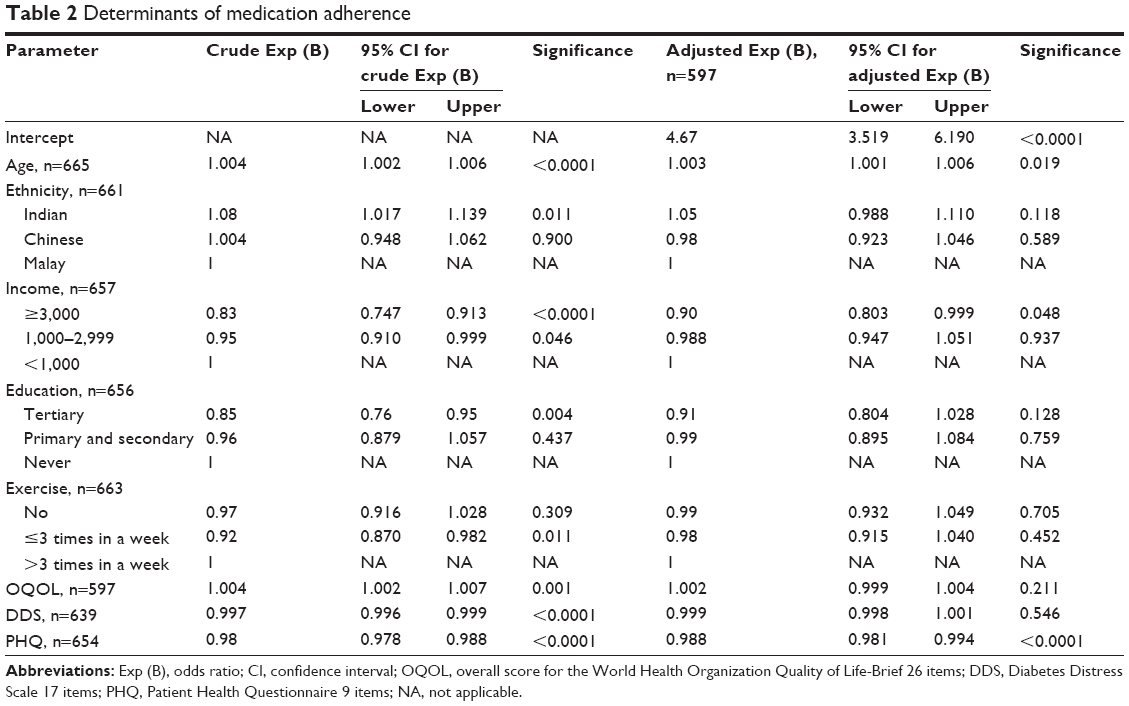 | Table 2 Determinants of medication adherence |
Discussion
This study reports on the determinants of MA in adult T2D patients taking into account DRD, depression, and quality of life, which were not investigated in previous studies.1,22–24 We noted a similar prevalence of low MA among adult T2D patients in this study, which is in line with earlier studies, ie, 40%–50% locally,1,22 and 40%–90% elsewhere, varied by whether the participants were on oral hypoglycemic or insulin medication.46,47
Strong determinants for medication non-adherence, such as younger age, higher income, higher education, less adherence to exercise recommendations, poorer HRQoL, having DRD, and depression were expected and have been reported previously.1,22 However, it was unexpected that those who did not exercise at all were as adherent to medication as those who exercised more than three times per week. Clustering of healthy behaviors has been reported before, and it would be expected that patients who adhered to exercise recommendations would also adhere to their prescribed medication.48 However, this finding might be limited by the brevity of this self-reported variable and the lack of simultaneous measurement of other healthy behaviors, such as dietary habits, self-monitoring of blood glucose, and adherence to blood testing.4
That adult T2D patients of Indian ethnicity were more adherent to their medication compared with the Malay and Chinese patients was unexpected.22 Chinese patients are believed to be more health conscious and adherent to health recommendations such as exercise.49 The Chinese are also often thought to be more adherent to their medication as prescribed by their physicians.48 However, being in a higher income group and having higher DRD might influence their adherence to prescribed medication. Having higher income possibly enables them to be more resourceful in health-seeking endeavors. In comparison with Indians, Malay patients were more likely to have tried other traditional therapies50 and the Chinese more often sought further private medical opinions51 for their T2D. These might have resulted in the observed higher non-adherence among Malay and Chinese patients to their medication when compared with Indians. However, this ethnic disparity in MA became statistically insignificant after adjustment for the stronger influence of income, age, and depression. Higher MA among Indians could also have been due to the lower prevalence of moderate to severe depression (7.5%) compared with the other two ethnic groups (12.0%; data not reported in the study).
Unlike many Western studies that have reported an association of medication non-adherence with DRD instead of depression,52–54 our results indicated a stronger adjusted effect of depression, rather than DRD, on medication non-adherence. This was probably due to the nature of DRD, which has milder symptomatology55 or because patients with DRD could manifest a psychological reaction of being successful in coping with MA rather than failing.56
The fact that medication use and insulin use did not affect MA is in line with a previous study that was also done in public health clinics,22 but in contrast with another study showing that patients on insulin and oral hypoglycemic agents were predisposed to medication non-adherence.1 However, this latter study was conducted in an urban academic hospital, a setting that is different from the studies at the primary care level.57 Nevertheless, a similar finding was noted with regard to unemployment status in association with medication non-adherence which reached statistical significance in that study, but not in this study. This could have been due to the higher drug cost required to refill prescriptions in the academic hospital, and thus the patients were predisposed to medication non-adherence.58 Having comorbidity such as hypertension, dyslipidemia,22 or diabetes-related complications also did not affect MA in adults with T2D attending public health clinics.22 On the contrary, after being diagnosed with these comorbidities and complications, there were greater proportions of patients who reported higher MA. This result confirms many primary care physicians’ experience and assumption that many of their patients become “better” patients in terms of adhering to therapeutic recommendations and their monitoring schedule after being diagnosed with an additional comorbidity or complication.
For T2D patients who are at risk of medication non-adherence, a poly-pill approach might be a helpful adjunct59 to other strategies, including reducing treatment complexity, decreasing pill burden, and addressing patient and socioeconomic issues that contribute to the problem.60,61 Future studies should look into adherence behavior over time and the ability of primary care physician to screen and respond to medication non-adherence.62
One of the limitations of this study lies in the use of a single measure for MA assessment, ie, the MMAS-8. This might predispose to recall bias or a biased response in the presence of significant others during the interview. However, since this was part of a larger study and used a locally validated MMAS-8 in a large sample size, we believe the design was able to produce a valid evaluation of determinants of MA. It would be desirable in a future study to have more than one measure for MA, such as pill count in addition to a self-report measure. The strength of the study was its representative sample of patients, in terms of their sociodemographic background being similar to the adult T2D patients in public health clinics throughout the whole country.63
Conclusion
Low MA is a serious problem in adult patients with T2D, and its downstream effects will be multiplied in increased complication rates, psychological burden, and health care costs if left unaddressed. Primary health care providers in public health clinics should focus on MA counselling for adult T2D patients of younger age, with a higher income, and who report more depressive symptoms. This study provides further evidence regarding the characteristics of patients who may be at risk for medication non-adherence. This behavior did not differ according to ethnic groups, number and types of medication prescribed, or duration of diabetes and comorbidities/complications.
Acknowledgments
This study was funded by the Research University Grants Scheme 2 (RUGS/04-02-2105RU). We acknowledge Al-Qazaz et al, Morisky et al, the World Health Organization, Polonsky et al, Sherina Mohd-Sidik, and Xiaonan Yu for the use of the different versions of the MMAS-8, WHOQOL-BREF, DDS-17, and PHQ-9 questionnaires. In addition, we are grateful to the Sepang and Petaling district health offices and officers for their support of this study, and the Director General of Health for permission to publish the findings. We thank Firdaus Mukhtar, Nor-Kasmawati Jamaludin, and Fuziah Paimin for their input during the planning of the study and their assistance with data collection. We would also like to thank the staff members of all the clinics for facilitating the data collection process.
Disclosure
The authors report no conflicts of interest in this work. The study sponsor had no role in the design or conduct of the study, the writing of this report, or the decision to submit it for publication.
References
Chua SS, Chan SP. Medication adherence and achievement of glycaemic targets in ambulatory type 2 diabetic patients. Journal of Applied Pharmaceutical Science. 2011;1:55–59. | ||
Asche C, LaFleur J, Conner C. A review of diabetes treatment adherence and the association with clinical and economic outcomes. Clin Ther. 2011;33:74–109. | ||
Osterberg L, Blaschke T. Adherence to medication. N Engl J Med. 2005;353:487–497. | ||
Lian J, Liang Y. Diabetes management in the real world and the impact of adherence to guideline recommendations. Curr Med Res Opin. 2014;30:2233–2240. | ||
Wild H. The economic rationale for adherence in the treatment of type 2 diabetes mellitus. Am J Manag Care. 2012;18:S43–S48. | ||
Rogvi S, Tapager I, Almdal TP, Schiotz ML, Willaing I. Patient factors and glycaemic control – associations and explanatory power. Diabet Med.2012;29:e382–e389. | ||
Rhee MK, Slocum W, Ziemer DC, et al. Patient adherence improves glycemic control. Diabetes Educ. 2005;31:240–250. | ||
DiMatteo MR. Variations in patients’ adherence to medical recommendations: a quantitative review of 50 years of research. Med Care. 2004;42:200–209. | ||
Cramer JA, Benedict A, Muszbek N, Keskinaslan A, Khan ZM. The significance of compliance and persistence in the treatment of diabetes, hypertension and dyslipidaemia: a review. Int J Clin Pract. 2008;62:76–87. | ||
Weinman J, Petrie KJ. Illness perceptions: a new paradigm for psychosomatics? J Psychosom Res. 1997;42:113–116. | ||
Ahola AJ, Groop PH. Barriers to self-management of diabetes. Diabet Med. 2013;30:413–420. | ||
Balkrishnan R, Rajagopalan R, Camacho FT, Huston SA, Murray FT, Anderson RT. Predictors of medication adherence and associated health care costs in an older population with type 2 diabetes mellitus: a longitudinal cohort study. Clin Ther. 2003;25:2958–2971. | ||
Ngoh LN. Health literacy: a barrier to pharmacist-patient communication and medication adherence. J Am Pharm Assoc (2003). 2009;49:e132–e146. | ||
Anderson K, Jue SG, Madaras-Kelly KJ. Identifying patients at risk for medication mismanagement: using cognitive screens to predict a patient’s accuracy in filling a pillbox. Consult Pharm. 2008;23:459–472. | ||
Zhang J, Xu CP, Wu HX, et al. Comparative study of the influence of diabetes distress and depression on treatment adherence in Chinese patients with type 2 diabetes: a cross-sectional survey in the People’s Republic of China. Neuropsychiatr Dis Treat. 2013;9:1289–1294. | ||
Anderson LA. Health care communication and selected psychosocial correlates of adherence in diabetes management. Diabetes Care. 1990;13:66–76. | ||
Parchman ML, Zeber JE, Palmer RF. Participatory decision making, patient activation, medication adherence, and intermediate clinical outcomes in type 2 diabetes: a STARNet study. Ann Fam Med. 2010;8:410–417. | ||
DiMatteo MR, Sherbourne CD, Hays RD, et al. Physicians’ characteristics influence patients’ adherence to medical treatment: results from the Medical Outcomes Study. Health Psychol. 1993;12:93–102. | ||
Kaissi AA, Parchman M. Organizational factors associated with self-management behaviors in diabetes primary care clinics. Diabetes Educ. 2009;35:843–850. | ||
Cramer JA, Roy A, Burrell A, et al. Medication compliance and persistence: terminology and definitions. Value Health. 2008;11:44–47. | ||
Garfield S, Clifford S, Eliasson L, Barber N, Willson A. Suitability of measures of self-reported medication adherence for routine clinical use: a systematic review. BMC Med Res Methodol. 2011;11:149. | ||
Ahmad NS, Ramli A, Islahudin F, Paraidathathu T. Medication adherence in patients with type 2 diabetes mellitus treated at primary health clinics in Malaysia. Patient Prefer Adherence. 2013;7:525–530. | ||
Kaur G, Tee GH, Ariaratnam S, Krishnapillai AS, China K. Depression, anxiety and stress symptoms among diabetics in Malaysia: a cross sectional study in an urban primary care setting. BMC Fam Pract. 2013;14:69. | ||
Cheah WL, Lee PY, Lim PY, Fatin Nabila AA, Luk KJ, Nur Irwana AT. Perception of quality of life among people with diabetes. Malays Fam Physician. 2012;7:21–30. | ||
Marcum ZA, Sevick M, Handler SM. Medication nonadherence: a diagnosable and treatable medical condition. JAMA. 2013;309:2105–2106. | ||
Morisky DE, Ang A, Krousel-Wood M, Ward HJ. Predictive validity of a medication adherence measure in an outpatient setting. J Clin Hypertens (Greenwich). 2008;10:348–354. | ||
Al-Qazaz HK, Hassali MA, Shafie AA, Sulaiman SA, Sundram S, Morisky DE. The eight-item Morisky Medication Adherence Scale MMAS: translation and validation of the Malaysian version. Diabetes Res Clin Pract. 2010;90:216–221. | ||
Yan J, You LM, Yang Q, et al. Translation and validation of a Chinese version of the 8-item Morisky Medication Adherence Scale in myocardial infarction patients. J Eval Clin Pract. 2014;20(4):311–317. | ||
Skevington SM, Lotfy M, O’Connell KA. The World Health Organization’s WHOQOL-BREF quality of life assessment: psychometric properties and results of the international field trial. A report from the WHOQOL group. Qual Life Res. 2004;13:299–310. | ||
[No authors listed]. Development of the World Health Organization WHOQOL-BREF quality of life assessment. The WHOQOL Group. Psychol Med. 1998;28:551–558. | ||
Yao G, Chung CW, Yu CF, Wang JD. Development and verification of validity and reliability of the WHOQOL-BREF Taiwan version. J Formos Med Assoc. 2002;101:342–351. | ||
Hasanah CI, Naing L, Rahman AR. World Health Organization Quality of Life Assessment: brief version in Bahasa Malaysia. Med J Malaysia. 2003;58:79–88. | ||
Polonsky WH, Fisher L, Earles J, et al. Assessing psychosocial distress in diabetes: development of the Diabetes Distress Scale. Diabetes Care. 2005;28:626–631. | ||
El Achhab Y, Nejjari C, Chikri M, Lyoussi B. Disease-specific health-related quality of life instruments among adults diabetic: a systematic review. Diabetes Res Clin Pract. 2008;80:171–184. | ||
Ting RZ, Nan H, Yu MW, et al. Diabetes-related distress and physical and psychological health in Chinese type 2 diabetic patients. Diabetes Care. 2011;34:1094–1096. | ||
Fisher L, Hessler DM, Polonsky WH, Mullan J. When is diabetes distress clinically meaningful? Establishing cut points for the Diabetes Distress Scale. Diabetes Care. 2012;35:259–264. | ||
Kroenke K, Spitzer RL, Williams JB. The PHQ-9: validity of a brief depression severity measure. J Gen Intern Med. 2001;16:606–613. | ||
Sherina MS, Arroll B, Goodyear-Smith F. Criterion validity of the PHQ-9 (Malay version) in a primary care clinic in Malaysia. Med J Malaysia. 2012;67:309–315. | ||
Yu X, Tam WW, Wong PT, Lam TH, Stewart SM. The Patient Health Questionnaire-9 for measuring depressive symptoms among the general population in Hong Kong. Compr Psychiatry. 2012;53:95–102. | ||
World Health Organization. Definition, diagnosis and classification of diabetes mellitus and its complications. Part 1: diagnosis and classification of diabetes mellitus. Report no. 99.2. Geneva, Switzerland: World Health Organization; 1999. Available from: http://apps.who.int/iris/handle/10665/66040. Accessed April 6, 2015. | ||
Ministry of Health Malaysia. Management of type 2 diabetes mellitus. Putrajaya, Malaysia: Technology, Health Section, Assessment Division, Medical Development; 2009. Available from: http://www.moh.gov.my/attachments/3878.pdf. Accessed April 7, 2015. | ||
American Diabetes Association. Standards of medical care in diabetes – 2015. Diabetes Care. 2015;38 Suppl 1:S1–S93. | ||
Faul F, Erdfelder E, Lang AG, Buchner A. G*Power 3: a flexible statistical power analysis program for the social, behavioral, and biomedical sciences. Behav Res Methods. 2007;39:175–191. | ||
Fisher L, Mullan JT, Arean P, Glasgow RE, Hessler D, Masharani U. Diabetes distress but not clinical depression or depressive symptoms is associated with glycemic control in both cross-sectional and longitudinal analyses. Diabetes Care. 2010;33:23–28. | ||
van Bastelaar KM, Pouwer F, Geelhoed-Duijvestijn PH, et al. Diabetes-specific emotional distress mediates the association between depressive symptoms and glycaemic control in type 1 and type 2 diabetes. Diabet Med. 2010;27:798–803. | ||
Cramer JA. A systematic review of adherence with medications for diabetes. Diabetes Care. 2004;27:1218–1224. | ||
Saleh F, Mumu SJ, Ara F, Hafez MA, Ali L. Non-adherence to self-care practices and medication and health related quality of life among patients with type 2 diabetes: a cross-sectional study. BMC Public Health. 2014;14:431. | ||
Jimenez-Garcia R, Esteban-Hernandez J, Hernandez-Barrera V, Jimenez-Trujillo I, Lopez-de-Andres A, Carrasco Garrido P. Clustering of unhealthy lifestyle behaviors is associated with nonadherence to clinical preventive recommendations among adults with diabetes. J Diabetes Complications. 2011;25:107–113. | ||
Chew BH, Khoo EM, Chia YC. Quality of care for adult type 2 diabetes mellitus at a university primary care centre in Malaysia. Int J Collab Res Intern Med Public Health. 2011;3:439–449. | ||
Ching SM, Zakaria ZA, Paimin F, Jalalian M. Complementary alternative medicine use among patients with type 2 diabetes mellitus in the primary care setting: a cross-sectional study in Malaysia. BMC Complement Altern Med. 2013;13:148. | ||
Omar M, Tong SF, Saleh N, et al. A comparison of morbidity patterns in public and private primary care clinics in Malaysia. Malays Fam Physician. 2011;6:19–25. | ||
Walker RJ, Smalls BL, Hernandez-Tejada MA, Campbell JA, Davis KS, Egede LE. Effect of diabetes fatalism on medication adherence and self-care behaviors in adults with diabetes. Gen Hosp Psychiatry. 2012;34:598–603. | ||
Aikens JE. Prospective associations between emotional distress and poor outcomes in type 2 diabetes. Diabetes Care. 2012;35:2472–2478. | ||
Gonzalez JS, Shreck E, Psaros C, Safren SA. Distress and type 2 diabetes treatment adherence: a mediating role for perceived control. Health Psychol. August 11, 2014. [Epub ahead of print]. | ||
Fisher L, Gonzalez JS, Polonsky WH. The confusing tale of depression and distress in patients with diabetes: a call for greater clarity and precision. Diabet Med. 2014;31:764–772. | ||
Karlsen B, Oftedal B, Bru E. The relationship between clinical indicators, coping styles, perceived support and diabetes-related distress among adults with type 2 diabetes. J Adv Nurs. 2012;68:391–401. | ||
Chew BH, Shariff-Ghazali S, Lee PY, et al. Type 2 diabetes mellitus patient profiles, diseases control and complications at four public health facilities-a cross-sectional study based on the Adult Diabetes Control and Management (ADCM) Registry 2009. Med J Malaysia. 2013;68:397–404. | ||
Piette JD, Wagner TH, Potter MB, Schillinger D. Health insurance status, cost-related medication underuse, and outcomes among diabetes patients in three systems of care. Med Care. 2004;42:102–109. | ||
Castellano JM, Sanz G, Penalvo JL, et al. A polypill strategy to improve adherence: results from FOCUS (Fixed-dose Combination Drug for Secondary Cardiovascular Prevention) Project. J Am Coll Cardiol. 2014;64:2071–2082. | ||
Vermeire E, Wens J, Van Royen P, Biot Y, Hearnshaw H, Lindenmeyer A. Interventions for improving adherence to treatment recommendations in people with type 2 diabetes mellitus. Cochrane Database Syst Rev. 2005;2:CD003638. | ||
Bailey CJ, Kodack M. Patient adherence to medication requirements for therapy of type 2 diabetes. Int J Clin Pract. 2011;65:314–322. | ||
National Institute for Health and Care Excellence. Medicines adherence: Involving patients in decisions about prescribed medicines and supporting adherence. Clinical guideline 76. Manchester, UK: National Institute for Health and Care Excellence; 2009. Available from: https://www.nice.org.uk/guidance/cg76. Accessed April 8, 2015. | ||
Non-Communicable Disease Section, Disease Control Division, Department of Public Health. National Diabetes Registry Report, Volume 1: 2009–2012. Available from: file:///C:/Users/susan/Downloads/National_Diabetes_Registry_Report_Vol_1_2009_2012.pdf. Accessed April 7, 2015. |
 © 2015 The Author(s). This work is published and licensed by Dove Medical Press Limited. The
full terms of this license are available at https://www.dovepress.com/terms
and incorporate the Creative Commons Attribution
- Non Commercial (unported, 3.0) License.
By accessing the work you hereby accept the Terms. Non-commercial uses of the work are permitted
without any further permission from Dove Medical Press Limited, provided the work is properly
attributed. For permission for commercial use of this work, please see paragraphs 4.2 and 5 of our Terms.
© 2015 The Author(s). This work is published and licensed by Dove Medical Press Limited. The
full terms of this license are available at https://www.dovepress.com/terms
and incorporate the Creative Commons Attribution
- Non Commercial (unported, 3.0) License.
By accessing the work you hereby accept the Terms. Non-commercial uses of the work are permitted
without any further permission from Dove Medical Press Limited, provided the work is properly
attributed. For permission for commercial use of this work, please see paragraphs 4.2 and 5 of our Terms.