Back to Journals » Neuropsychiatric Disease and Treatment » Volume 13
Detailed course of depressive symptoms and risk for developing depression in late adolescents with subthreshold depression: a cohort study
Authors Jinnin R ![]() , Okamoto Y, Takagaki K, Nishiyama Y, Yamamura T, Okamoto Y, Miyake Y, Takebayashi Y
, Okamoto Y, Takagaki K, Nishiyama Y, Yamamura T, Okamoto Y, Miyake Y, Takebayashi Y ![]() , Tanaka K, Sugiura Y, Shimoda H, Kawakami N
, Tanaka K, Sugiura Y, Shimoda H, Kawakami N ![]() , Furukawa TA, Yamawaki S
, Furukawa TA, Yamawaki S
Received 21 July 2016
Accepted for publication 9 September 2016
Published 22 December 2016 Volume 2017:13 Pages 25—33
DOI https://doi.org/10.2147/NDT.S117846
Checked for plagiarism Yes
Review by Single anonymous peer review
Peer reviewer comments 2
Editor who approved publication: Professor Taro Kishi
Ran Jinnin,1 Yasumasa Okamoto,1 Koki Takagaki,1 Yoshiko Nishiyama,1 Takanao Yamamura,1 Yuri Okamoto,2 Yoshie Miyake,2 Yoshitake Takebayashi,3 Keisuke Tanaka,4 Yoshinori Sugiura,5 Haruki Shimoda,6 Norito Kawakami,6 Toshi A Furukawa,7 Shigeto Yamawaki1
1Department of Psychiatry and Neurosciences, 2Health Service Center, Hiroshima University, Hiroshima, Japan; 3Risk Analysis Research Center, The Institute of Statistical Mathematics, Tokyo, Japan; 4Graduated School of Education, Joetsu University of Education, Niigata, Japan; 5Graduated School of Integrated Arts and Sciences, Hiroshima University, Hiroshima, Japan; 6Department of Mental Health, Graduate School of Medicine, The University of Tokyo, Tokyo, Japan; 7Department of Health Promotion and Human Behavior, Kyoto University Graduate School of Medicine/School of Public Health, Kyoto, Japan
Purpose: Despite its clinical importance, adolescent subthreshold depression remains a largely neglected topic. The aims of this study were to accurately identify the natural course of depressive symptoms and the risk for developing major depressive episode (MDE) in late adolescents with subthreshold depression over 1 year.
Patients and methods: One hundred and seventy-two participants <20 years of age (mean age: 18.32 years, standard deviation: 0.50), who did not meet the full criteria for an MDE, were selected from 2,494 screened freshmen based on the Beck Depression Inventory, 2nd edition (BDI-II). We conducted a cohort study of three groups (low-, middle-, and high-symptom groups) divided based on BDI-II scores, over a 1 year period with the use of bimonthly assessments. Temporal changes of depressive symptoms were analyzed using linear mixed modeling and growth mixture modeling.
Results: First, we found that late adolescents with subthreshold depression (high depressive symptoms) were split between the increasing and decreasing depressive symptoms groups, whereas the majority of the less-symptoms group remained stable during 1 year. Second, in comparison with late adolescents with less depressive symptoms, those with subthreshold depression had an elevated risk of later depression.
Conclusion: Some late adolescents with subthreshold depression had increased depressive symptoms and developed an MDE during 1 year. Therefore, it is necessary for us to rigorously assess the changes in subthreshold depressive symptoms over time in late adolescents.
Keywords: adolescence, subthreshold depression, major depressive episode, university student, cohort study
Introduction
In recent years, there has been considerable interest in the clinical significance of subthreshold depression (ie, the presence of clinically relevant depressive symptoms that do not meet the full criteria of a major depressive episode [MDE]) in adolescence.1 Subthreshold depressive symptoms among adolescents are highly prevalent and are a considerable health problem.2 Several studies suggest that childhood and adolescent subthreshold depression are associated with severe impairment3,4 and with the future risk of developing an MDE,5–7 which is similar to findings in adult populations.8,9 Although the participants were children and adolescents <18 years of age, a recent systematic review10 indicated that subthreshold depression and major depression are common conditions with similar risk factor patterns. The clinical characteristics of both subthreshold depression and major depression are depressed mood and high psychiatric comorbidity with anxiety and conduct disorders. In addition, both subthreshold depression and major depression have comparably poor outcomes, with increased psychiatric morbidity and health service use.10 However, compared to the significant amount of research on major depression, little attention has been given to the issue of sustained subthreshold depression in adolescence.
The prevalence of subthreshold depression in adolescence peaks in the mid-teens and then reduces with age.2,6,11,12 In contrast, the prevalence of major depression increases linearly from the mid-teens to mid-twenties.2,6,13 It is reported that the transition from subthreshold depression to major depression occurs in late adolescence.2 Several researchers have observed that the prevalence of psychological distress is higher among students than among working nonstudent populations of the same sex and age.14–17 In Japan, it has been reported that the prevalence of depression was quite high in first-year university students.18 Especially the first year in university student’s life is a period of vulnerability during which young students establish, test, and adjust to new psychological identities.19 Thus, in late adolescence, it is necessary to rigorously analyze temporal changes in depressive symptoms during the first year of admission into the university.
Several studies have indicated that the persistence of adolescent depressive symptoms is predictive of subsequent mental health problems.20,21 In these studies, depressive symptoms were measured at several points in adolescence and young adulthood. Persistent adolescent depressive symptoms (high scores consistent across time points) were associated with abnormal psychosocial and mental functioning in early adulthood, while episodic high scores (at only one time point in adolescence) were not.20 Although this research provides estimates of persistent depressive symptoms, the data sampling interval in these studies was every several years. It has been shown that repeated and more frequent assessments of the same individuals could overcome the potential biases of reminiscence over long periods and could more accurately identify the onset and natural course of the disorder throughout the developmental period.6
The aims of this study were to accurately identify the natural course of depressive symptoms and the risk for developing MDE in late adolescents with subthreshold depression over 1 year. In the present study, subthreshold depression was defined as the presence of any depressive symptoms, as measured by the Beck Depression Inventory, 2nd edition (BDI-II), that do not meet the full criteria for an MDE. Therefore, we conducted a cohort study in three groups (low-, middle-, and high-symptom group) of first-year university students, divided based on BDI-II scores, to examine their detailed course of depressive symptoms and risk for developing an MDE over a 12-month period.
Methods
Participants
First-year undergraduate students were recruited from Hiroshima University in Japan. The inclusion criteria were 1) age 18–19 years (at the time of entry into university), 2) not having an MDE during the previous 12 months, and 3) not currently taking psychotropic drugs or receiving psychotherapy for a mental health problem. The exclusion criteria were 1) a diagnosed lifetime history of bipolar disorder and 2) having a serious physical illness.
Measures
The Japanese version of the BDI-II
The original BDI-II, developed by Beck et al,22 is a widely used self-reported questionnaire that assesses the severity of depression. The BDI-II consists of 21 items rated on a four-point scale ranging from 0 to 3. A high score indicates that depressive symptoms are severe. The validity and reliability of the Japanese version has been confirmed.23 A cutoff score of 18 in the BDI-II yielded a sensitivity of 94% and a specificity of 92%, and a cutoff score of 10 yielded a sensitivity of 100% and a specificity of 70%.24 Participants completed the BDI-II every 2 months (annual checkup, baseline assessment, 2, 4, 6, 8, 10, and 12 months later).
Composite International Diagnostic Interview
The Composite International Diagnostic Interview (CIDI)25 is a fully structured diagnostic interview that assesses mental disorders using the definitions and criteria of the Diagnostic and Statistical Manual of Mental Disorders, Fourth Edition. We used the computer-assisted personal interview version to assess mental state at baseline and at a 1-year follow-up. In the interview, we included the sections evaluating mood disorders and anxiety disorders (panic disorder, social phobia, agoraphobia, generalized anxiety disorder, and posttraumatic stress disorder). We used the Japanese version of the CIDI,26 which was administered by trained interviewers who were psychiatrists or graduate clinical psychology students. The CIDI was conducted at baseline and 12 months later.
Procedure
The participants in this study were freshmen from Hiroshima University. The BDI-II is performed as part of an annual checkup for all freshmen. Most students complete it every year (with an average response rate of >99%). In this study, 2,494 freshmen were screened using the BDI-II as part of the checkup, and 2,281 freshmen <20 years of age at the point of entry into university responded. In the present study, subthreshold depression was defined as the presence of any depressive symptoms, as measured by the BDI-II, that do not meet the full criteria for an MDE. It has been shown that a cutoff score of 18 in the BDI-II yields a sensitivity of 94% and a specificity of 92% and that a cutoff score of 10 yields a sensitivity of 100% and a specificity of 70%.24 On the basis of a previous study,24 we created three groups using the BDI-II scores (the low-symptom group: BDI-II score ≤10, the middle-symptom group: BDI-II score =11–17, and the high-symptom group: BDI-II score ≥18). Participants were categorized into the symptom groups as follows: low-symptom group (n=1,918), middle-symptom group (n=276), and high-symptom group (n=87). For the low- and middle-symptom groups, we contacted randomly selected students by mail via the Hiroshima University information system. As there were only a few students in the high-symptom group, we contacted all students in this group. At this point of contact, we gave them a brief explanation of the study. Some students (low-symptom group: n=72, middle-symptom group: n=62, high-symptom group: n=68) who were interested in study participation were provided detailed information regarding this study. After obtaining consent, all potential participants (low-symptom group: n=68, middle-symptom group: n=57, high-symptom group: n=66) were assessed using the CIDI face-to-face by a trained interviewer. Then, the participants were selected according to the study’s inclusion and exclusion criteria of the CIDI. Follow-up was done every two months (2, 4, 6, 8, 10, and 12 months later), for one year, to assess depressive symptoms using the BDI-II. At the 12-month follow-up, all participants completed the CIDI.
The Ethics Committee of Hiroshima University approved the study and the study protocol, and written informed consent was obtained from all participants.
Data analysis
We analyzed the data of 172 students who completed the BDI-II and CIDI at baseline and 12 months later. First, we calculated descriptive data and investigated the baseline differences in the demographic data using analysis of variance (ANOVA) and χ2 tests. A previous study has reported that BDI-II consists of two subscales (somatic–affective and cognitive).22,23 We examined whether there were significant differences in these two subscale scores within each group, and we also compared them between different groups. Second, we conducted linear mixed modeling with time and group as factors to examine differences in change over 1 year. Thus, the predictors in the models were time, group, and time × group. We adopted the random intercepts and slope model with maximum likelihood estimation. The random effects of this model were intercepts and slope of time. Third, we conducted Fisher’s exact test to examine differences in the incidence of MDE between the three groups. Subsequently, if there were significant differences in the results of the Fisher’s exact test, residual analysis between the three groups was conducted to explore them. Fourth, after we examined whether there were dispersions of slope in our participants, we conducted a growth mixture modeling (GMM) to identify subtypes of longitudinal trajectories in depressive symptoms. To examine model fit with latent trajectories, we used the Bayesian information criteria (BIC) and the entropy.27–29 Finally, we examined how many participants from the BDI-II groups were present in different classes. Statistical analyses of ANOVA, χ2 tests, and Fisher’s exact test were done using SPSS version 22.0 (IBM Corporation, Armonk, NY, USA) for Windows. Linear mixed modeling and GMM analyses were carried out using the R statistical computing environment (version 3.2.1; http://www.R-project.org/), together with the LCMM package.30
Results
Participants
After obtaining written informed consent, a trained interviewer conducted the CIDI face-to-face, and participants completed the scales. One participant in the middle-symptom group and 12 participants in the high-symptom group were excluded because they either met the criteria for major depression in the past year or had a lifetime history of bipolar disorder. Finally, 176 participants were selected based on the inclusion and exclusion criteria. The flow of participants is described in Figure 1. Sixty-six participants in the low-symptom group, 56 participants in the middle-symptom group, and 54 participants in the high-symptom group met the eligibility criteria. Sixty-six freshmen in the low-symptom group (100%), 55 in the middle-symptom group (98.2%), and 51 in the high-symptom group (94.4%) completed the follow-up assessment 12 months later. One participant in the middle-symptom group and three participants in the high-symptom group were excluded because they did not receive the assessments at the 12-month follow-up.
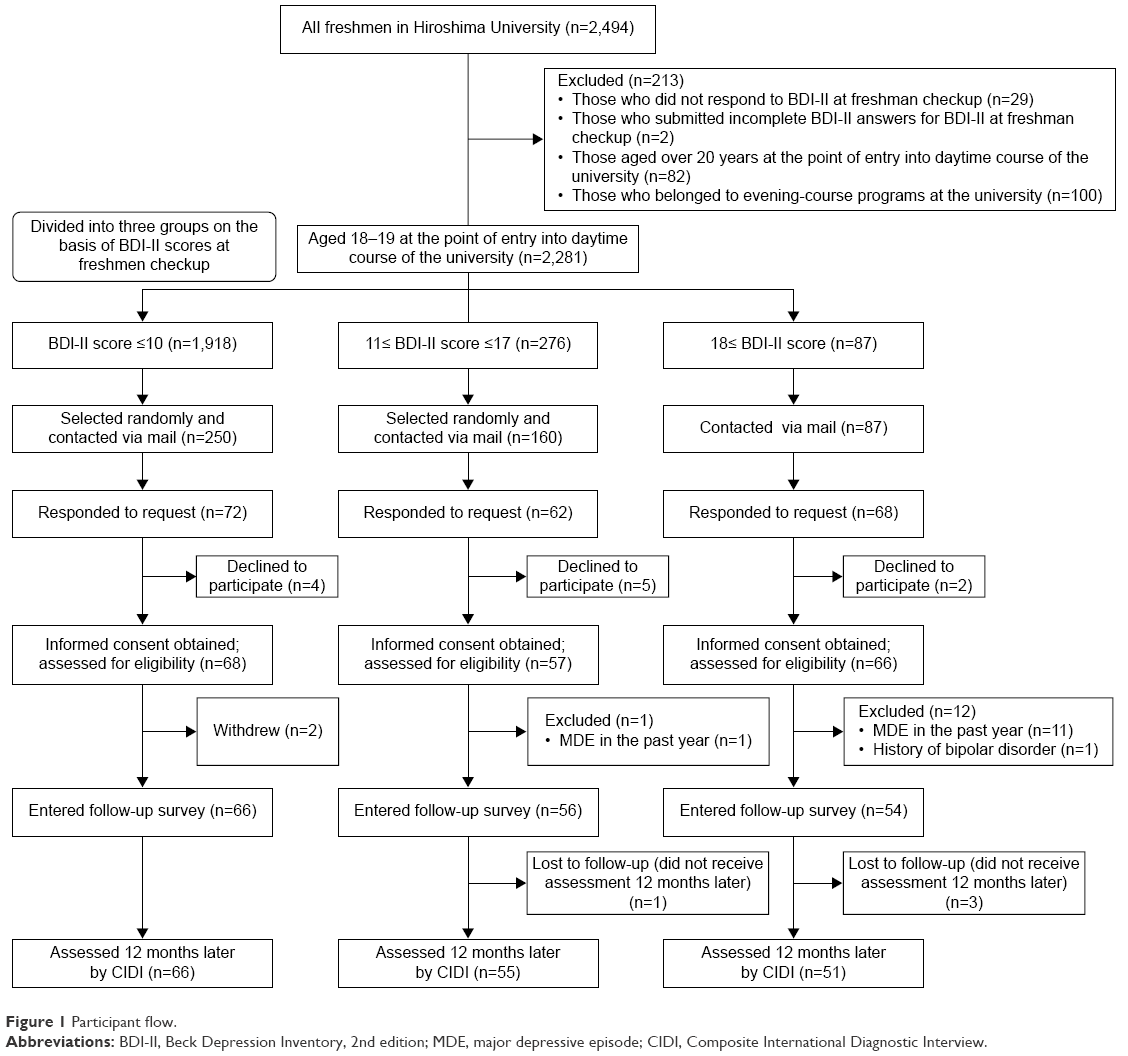 | Figure 1 Participant flow. |
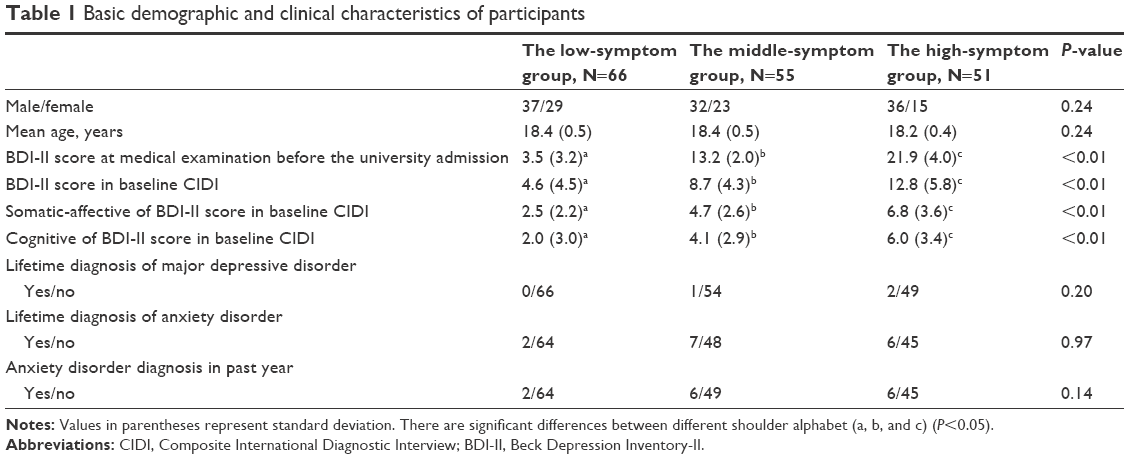
Basic demographic and clinical characteristics
Table 1 lists the demographic and clinical characteristics of the participants. We examined whether there were significant differences in age, gender distribution, and clinical characteristics between the three groups by conducting ANOVA and χ2 tests. The age, gender distribution, history of major depression, and comorbidity of anxiety disorders did not differ significantly between the three groups. One-way ANOVAs yielded significant differences between the three groups for BDI-II scores. We then conducted multiple comparisons for each of the scales, which yielded significant differences between the three groups for BDI-II scores. Next, we examined whether there were significant differences in the two subscales for the three groups. The results of an ANOVA indicated that there were no significant differences in the two subscales within each group. We also conducted an ANOVA to examine significant difference in the two BDI-II subscales between the three groups. The results of the ANOVAs showed that there were significant differences in BDI-II scores between the three groups.
 | Table 1 Basic demographic and clinical characteristics of participants |
Average scores of depressive symptoms in follow-up surveys
We conducted linear mixed modeling to examine significant differences between the seven time points the BDI-II was administered (Figure 2). There was no significant interaction between all groups, but the main effects of the middle-symptom group (estimate =5.14, standard error [SE] =0.86, t-value =5.98, P<0.01) and the high-symptom group (estimate =8.89, SE =0.88, t-value =10.14, P<0.01) were significant. The multiple comparisons revealed significant differences between the three groups (mean of the low-symptom group =4.81, mean of the middle-symptom group =9.95, and mean of the high-symptom group =13.69, P<0.01), but there was no main effect of time (estimate =−0.12, SE =0.11, t-value =−1.06, P=0.29). Next, we examined whether there were statistical dispersions of the slope within the group. The results indicated that the dispersions of the slope were large (χ2 =34.7, degrees of freedom [df] =2, P<0.01).
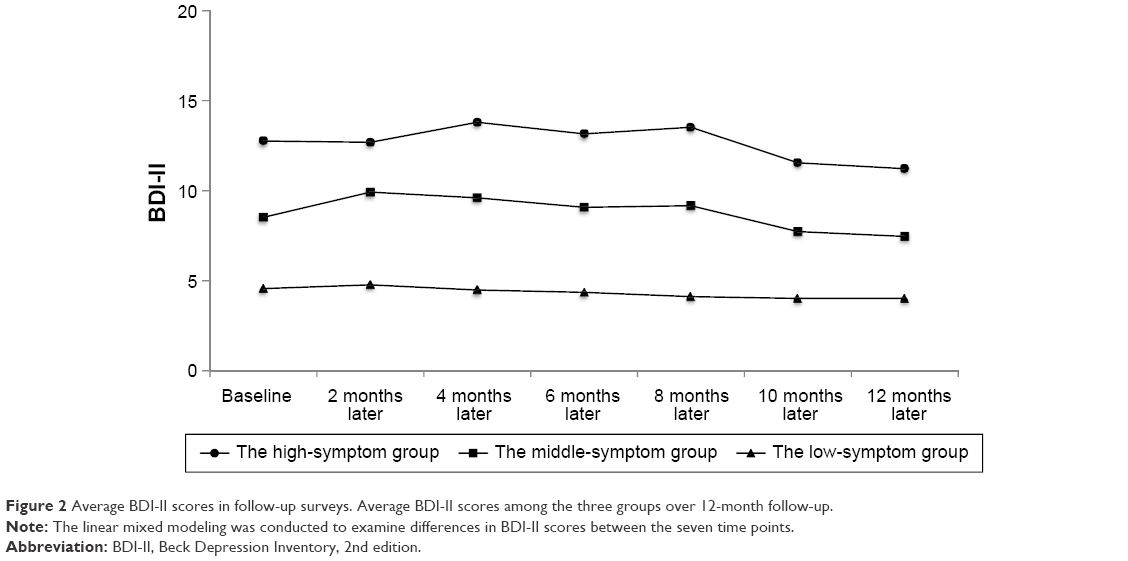 | Figure 2 Average BDI-II scores in follow-up surveys. Average BDI-II scores among the three groups over 12-month follow-up. |
Individual trajectories of depressive symptoms
The linear mixed modeling was inappropriate for analyzing longitudinal data, if the variance of the slope in longitudinal data was large.31 Result of linear mixed modeling indicated that dispersions of the slope in our participants were large (χ2 =34.7, df =2, P<0.01). Therefore, to identify particular change of depressive symptoms, we used a GMM to analyze the data. The results indicate that six classes were estimated. To identify the number of latent trajectory classes, we used the BIC and the entropy. The results revealed that the BIC scores were lowest for the three-class solution (one-class =7,028.59, two-class =6,967.61, three-class =6,943.98, four-class =6,972.57, five-class =6,961.77, six-class =6,986.12). Based on a previous study,32 we also calculated the entropy. The entropy score for the three-class solution was 0.81. Judging from fit indexes of BIC and entropy, we adopted three classes. The average latent class probabilities for most likely latent class membership by latent class for the three-class model was very good (Class 1 =0.94, Class 2 =0.91, and Class 3 =0.90). Figure 3 displays the results of the GMM. We named each class as follows: Class 1 was the stable group, Class 2 was the decreasing group, and Class 3 was the increasing group. The parameter estimates for the model are provided in Table 2. There was no significant change in depressive symptoms in the stable group (n=65). The stable group included 63 participants from the low-symptom group and 2 participants from the middle-symptom group. The decreasing group (n=81) demonstrated a significant decrease in depressive symptoms during the 12 months (P<0.01). The decreasing group included 3 participants from the low-symptom group, 49 participants from the middle-symptom group, and 29 participants from the high-symptom group. The increasing group (n=26) revealed a significant increase in depressive symptoms during the 12 months (P<0.05). The increasing group included 4 participants from the middle-symptom group and 22 participants from the high-symptom group.
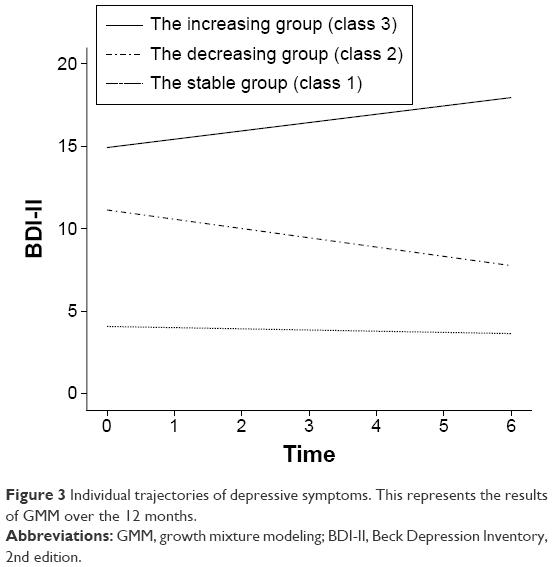 | Figure 3 Individual trajectories of depressive symptoms. This represents the results of GMM over the 12 months. |
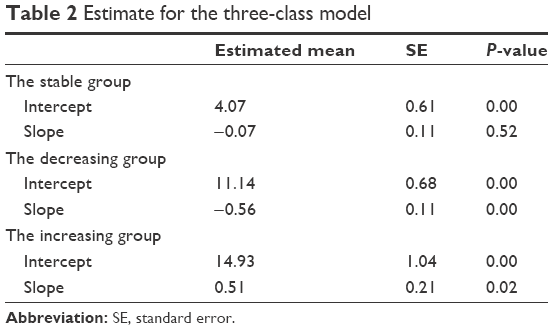 | Table 2 Estimate for the three-class model |
Group risk of developing an MDE during the 12 months
Three students in the high-symptom group developed an MDE by the 12-month follow-up, whereas no one in the low- and middle-symptom groups did. We conducted Fisher’s test to examine differences in the incidence of MDE among the three groups, and found significant differences between the three groups (χ2(2) =4.85, P<0.05). Additionally, we conducted residual analysis among the three groups. Results revealed a significant difference in the incidence of MDE between the high-symptom group and the other groups (P<0.05).
Discussion
To the best of our knowledge, the present study is the first to rigorously assess depressive symptoms (low-symptom group, middle-symptom group, and high-symptom group) in late adolescence over a 1-year period with the use of bimonthly assessments to improve the accuracy of reported symptoms and the onset of depression. Two major findings emerged from this longitudinal study. First, we found that late adolescents with high depressive symptoms (subthreshold depression) were split between the increasing and decreasing depressive symptoms groups, whereas the majority of the low and middle symptoms group remained stable over a 12-month period. Second, in comparison with late adolescents with low and middle depressive symptoms, those with high symptoms (subthreshold depression) had an elevated risk of later depression.
Only 29% and 39% of the participants who were contacted, respectively, from low- and middle-symptom groups participated in the study, whereas 78% of those in the high-symptom group participated. It has been reported that the severity of depression is the most important predictor of using university psychiatric services, and therefore, highly depressed students might have searched and accessed psychiatric services more than other students,33 which might have increased the participation rate of students with high depressive symptoms compared to students with low or middle depressive symptoms.
The present longitudinal research focused on the symptomatic changes of subthreshold depression in late adolescents. Based on the result of linear mixed modeling, the BDI-II mean scores of the high-symptom group remained high throughout the year. However, the GMM results, which take into account individual differences, indicated that half of the participants in the high-symptom group showed an increase in depressive symptoms during the 12 months, whereas other participants experienced a decrease in symptoms. Thus, it seems that half of the participants in the high-symptom group were not at risk for developing an MDE. On the contrary, from results of linear mixed modeling and GMM, both individual and mean scores of the BDI-II scores in the low-symptom group remained stable in low depressive symptoms over the year. Although the middle-symptom group mean scores did not change over the year from results of linear mixed modeling, most participants in this group showed a decrease in the depressive symptoms over the 12 months from the result of GMM. Therefore, the middle-symptom group may be classified as low-risk.
In addition, our data revealed that subthreshold depression (high depressive symptoms) might increase the likelihood of developing an MDE over time. The number of participants meeting the criteria for MDE during the year was only 3 of 172 students; however, it was noted that all were from the high-symptom group and had subthreshold depression. In the present study, three participants in the high-symptom group (n=51) developed an MDE. Therefore, the 1-year incidence of MDE in the high-symptom group was 5.8%. In a longitudinal study, Klein et al34 tested whether subthreshold depression among youth escalates or predicts the onset of full-syndrome depressive disorder. Among those adolescents (aged 14–18 years) with a history of subthreshold depressive disorder at baseline, 11.0% escalated to a full-syndrome depressive disorder during the year.34 Fergusson et al5 also showed that subthreshold depression in late adolescence (ages 17–18 years) increased the risk of an MDE (27.4%) at age 18–21 years. The rate of an MDE development in our cohort is somewhat lower than reported in other studies,5,6,34 which might reflect the lower prevalence of mental disorders in Japan compared to Western countries.26,35–38 Moreover, an alternative explanation for the low prevalence rate may be the timing of assessments in this study. Since the first assessment took place during a very stressful time period (admission), the prevalence rates at baseline may not be comparable to other studies.
It is important to note some limitations of the current study. First, although there were significant differences in the incidence of MDE between the three groups at the 1-year follow-up, the length of follow-up (12 months) was relatively short. It is necessary to conduct a long-term follow-up study, because only three participants developed an MDE, whereas half of the participants showed an increase in depressive symptoms in the high-symptom group. Second, our results showed that depressive symptoms were the highest at the checkup before university admission and had reduced when entering the follow-up study. A possible explanation for the decrease in symptoms is that the timing of the assessments contributed to this effect. For example, at the baseline measurement, late adolescents were not yet free from a highly stressful situation with regard to entrance examinations and were uneasy about the entrance into the university, which is a major transition point. As the adolescents acclimated to university, their stress and depression levels may have decreased by 2 months later. However, the depression levels in all the three groups were characterized by, on average, a relatively stable course after the first 2 months. Third, participants in this study were recruited from only one specific university and enrollment in a single year. The homogeneity of the specific sample may limit the generalizability of our results to community or clinical populations. Future studies should examine similar hypotheses among adolescents in other Japanese provinces to determine if the current findings can be replicated and, consequently, be generalized. Finally, we have not excluded the possibility that the high-symptom group might be characterized by particular personal features. However, personal features of subjects were not examined in this study. Therefore, it would be necessary to investigate personal features of subjects in future studies.
Conclusion
Despite its clinical importance, adolescent subthreshold depression remains a largely neglected topic.2 Whereas the majority of the less symptoms group remains stable over time, some late adolescents with subthreshold depression show an increase in depressive symptoms and develop an MDE during 1 year. Therefore, it is necessary for us to rigorously assess the changes in subthreshold depressive symptoms over time in the late adolescents.
Acknowledgments
This study was supported (in part) by JSPS KAKENHI Grant Number JP16H06395, JP16H06399 and Grant-in-Aid for Scientific Research on Innovative Areas (23118004; Adolescent Mind & Self-Regulation) from the Ministry of Education, Culture, Sports, Science and Technology.
Author contributions
All authors contributed toward data analysis, drafting and critically revising the paper and agree to be accountable for all aspects of the work.
Disclosure
The authors report no conflicts of interest in this work.
References
Georgiades K, Lewinsohn PM, Monroe SM, Seeley JR. Major depressive disorder in adolescence: the role of subthreshold symptoms. J Am Acad Child Adolesc Psychiatry. 2006;45(8):936–944. | ||
Bertha EA, Balázs J. Subthreshold depression in adolescence: a systematic review. Eur Child Adolesc Psychiatry. 2013;22(10):589–603. | ||
González-Tejera G, Canino G, Ramírez R, et al. Examining minor and major depression in adolescents. J Child Psychol Psychiatry. 2005;46(8):888–899. | ||
Keenan K, Hipwell A, Feng X, et al. Subthreshold symptoms of depression in preadolescent girls are stable and predictive of depressive disorders. J Am Acad Child Adolesc Psychiatry. 2008;47:1433–1442. | ||
Fergusson DM, Horwood LJ, Ridder EM, Beautrais AL. Suicidal behaviour in adolescence and subsequent mental health outcomes in young adulthood. Psychol Med. 2005;35:983–993. | ||
Rohde P, Beevers CG, Stice E, O’Neil K. Major and minor depression in female adolescents: onset, course, symptom presentation, and demographic associations. J Clin Psychol. 2009;65(12):1339–1349. | ||
Johnson JG, Cohen P, Kasen S. Minor depression during adolescence and mental health outcomes during adulthood. Br J Psychiatry. 2009;195:264–265. | ||
Cuijpers P, Smit F, Willemse G. Predicting the onset of major depression in subjects with subthreshold depression in primary care: A prospective study. Acta Psychiatr Scand. 2005;111(2):133–138. | ||
Cuijpers P, Smit F. Subthreshold depression as a risk indicator for major depressive disorder: A systematic review of prospective studies. Acta Psychiatr Scand. 2004;109(5):325–331. | ||
Wesselhoeft R, Sørensen MJ, Heiervang ER, Bilenberg N. Subthreshold depression in children and adolescents – a systematic review. J Affect Disord. 2013;151(1):7–22. | ||
Allgaier AK, Pietsch K, Frühe B, Prast E, Sigl-Glöckner J, Schulte-Körne G. Depression in pediatric care: is the WHO-Five Well-Being Index a valid screening instrument for children and adolescents? Gen Hosp Psychiatry. 2012;34(3):234–241. | ||
Cuijpers P, Boluijt P, van Straten A. Screening of depression in adolescents through the Internet: sensitivity and specificity of two screening questionnaires. Eur Child Adolesc Psychiatry. 2008;17(1):32–38. | ||
Kessler RC, Walters EE. Epidemiology of DSM-III-R major depression and minor depression among adolescents and young adults in the National Comorbidity Survey. 1998;7(1):3–14. | ||
Adlaf EM, Gliksman L, Demers A, Newton-Taylor B. The prevalence of elevated psychological distress among Canadian undergraduates: findings from the 1998 Canadian Campus Survey. J Am Coll Health. 2001;50(2):67–72. | ||
Stallman HM. Psychological distress in university students: a comparison with general population data. Aust Psychol. 2010;45(4):249–257. | ||
Dyrbye LN, Thomas MR, Shanafelt TD. Systematic review of depression, anxiety, and other indicators of psychological distress among U.S. and Canadian medical students. Acad Med. 2006;81(4):354–373. | ||
Roberts R, Golding J, Towell T, Weinreb I. The effects of economic circumstances on British students’ mental and physical health. J Am Coll Heal. 1999;48(3):103–109. | ||
Tomoda A, Mori K, Kimura M, Takahashi T, Kitamura T. One-year prevalence and incidence of depression among first-year university students in Japan: a preliminary study. Psychiatry Clin Neurosci. 2000;54(5):583–588. | ||
Verger P, Combes JB, Kovess-Masfety V, et al. Psychological distress in first year university students: socioeconomic and academic stressors, mastery and social support in young men and women. Soc Psychiatry Psychiatr Epidemiol. 2009;44(8):643–650. | ||
Colman I, Wadsworth ME, Croudace TJ, Jones PB. Forty-year psychiatric outcomes following assessment for internalizing disorder in adolescence. Am J Psychiatry. 2007;164(1):126–133. | ||
Stoolmiller M, Kim HK, Capaldi DM. The course of depressive symptoms in men from early adolescence to young adulthood: identifying latent trajectories and early predictors. J Abnorm Psychol. 2005;114(3):331–345. | ||
Beck A, Steer R, Brown G. Manual for the Beck Depression Inventory-II. San Antonio, TX: Psychological Corporation; 1996. | ||
Kojima M, Furukawa TA, Takahashi H, Kawai M, Nagaya T, Tokudome S. Cross-cultural validation of the Beck Depression Inventory-II in Japan. Psychiatry Res. 2002;110(3):291–299. | ||
Arnau RC, Meagher MW, Norris MP, Bramson R. Psychometric evaluation of the Beck Depression Inventory-II with primary care medical patients. Health Psychol. 2001;20(2):112–119. | ||
Kessler RC, Üstün BB. The World Mental Health (WMH) Survey Initiative version of the World Health Organization (WHO) Composite International Diagnostic Interview (CIDI). Int J Methods Psychiatr Res. 2004;13(2):93–117. | ||
Kawakami N, Takeshima T, Ono Y, et al. Twelve-month prevalence, severity, and treatment of common mental disorders in communities in Japan: preliminary finding from the World Mental Health Japan Survey 2002–2003. Psychiatry Clin Neurosci. 2005;59(4):441–452. | ||
Nagin DS. Analyzing developmental trajectories: a semiparametric, group-based approach. Psychol Methods. 1999;4(2):139–157. | ||
Nylund KL, Asparouhov T, Muthén BO. Deciding on the number of classes in latent class analysis and growth mixture modeling: a monte carlo simulation study. Struct Equ Model. 2007;14(4):535–569. | ||
Ramaswamy V, DeSarbo W. An empirical pooling approach for estimating marketing mix elasticities with PIMS data. Marketing Science, 1993. Available from: http://pubsonline.informs.org/doi/abs/10.1287/mksc.12.1.103. Accessed March 26, 2016. | ||
Proust-Lima C, Philipps V, Diakite A, Liquet B. LCMM: Estimation of Latent Class Mixed Models, Joint Latent Class Mixed Models and Mixed Models for Curvilinear Outcomes. R Package Version 163. Available from: http://cran.r-project.org/package=lcmm. 2013. Available from https://scholar.google.com/scholar?hl=ja&q=Proust-Lima+C%2C+Philipps+V%2C+DiakiteA%2C+Liquet+B.+LCMM&btnG=&lr=#0. Accessed December 21, 2015. | ||
Singer JD, Willett JB. Applied Longitudinal Data Analysis: Modeling Change and Event Occurrence. Oxford University Press, USA; 2003. | ||
Celeux G, Soromenho G. An entropy criterion for assessing the number of clusters in a mixture model. J Classif. 1996. Available from: http://link.springer.com/article/10.1007/BF01246098. Accessed March 26, 2016. | ||
O’Neil MK, Lancee WJ, Freeman SJ. Help-seeking behaviour of depressed students. Soc Sci Med. 1984;18(6):511–514. | ||
Klein DN, Shankman SA, Lewinsohn PM, Seeley JR. Subthreshold depressive disorder in adolescents: predictors of escalation to full-syndrome depressive disorders. J Am Acad Child Adolesc Psychiatry. 2009;48(7):703–710. | ||
Weissman MM, Bland RC, Canino GJ, et al. Cross-National epidemiology of major depression and bipolar disorder. JAMA J Am Med Assoc. 1996;276(4):293–299. | ||
Simon GE, Goldberg DP, Von Korff M, Ustün TB. Understanding cross-national differences in depression prevalence. Psychol Med. 2002;32(4):585–594. | ||
Demyttenaere K, Bruffaerts R, Posada-Villa J, et al. Prevalence, severity, and unmet need for treatment of mental disorders in the World Health Organization World Mental Health Surveys. JAMA. 2004;291(21):2581–2590. | ||
Andrade L, Caraveo-Anduaga JJ, Berglund P, et al. The epidemiology of major depressive episodes: results from the International Consortium of Psychiatric Epidemiology (ICPE) Surveys. Int J Methods Psychiatr Res. 2003;12(1):3–21. |
 © 2016 The Author(s). This work is published and licensed by Dove Medical Press Limited. The
full terms of this license are available at https://www.dovepress.com/terms
and incorporate the Creative Commons Attribution
- Non Commercial (unported, 3.0) License.
By accessing the work you hereby accept the Terms. Non-commercial uses of the work are permitted
without any further permission from Dove Medical Press Limited, provided the work is properly
attributed. For permission for commercial use of this work, please see paragraphs 4.2 and 5 of our Terms.
© 2016 The Author(s). This work is published and licensed by Dove Medical Press Limited. The
full terms of this license are available at https://www.dovepress.com/terms
and incorporate the Creative Commons Attribution
- Non Commercial (unported, 3.0) License.
By accessing the work you hereby accept the Terms. Non-commercial uses of the work are permitted
without any further permission from Dove Medical Press Limited, provided the work is properly
attributed. For permission for commercial use of this work, please see paragraphs 4.2 and 5 of our Terms.