Back to Journals » International Journal of Nanomedicine » Volume 14
Design and Synthesis of Gold-Gadolinium-Core-Shell Nanoparticles as Contrast Agent: a Smart Way to Future Nanomaterials for Nanomedicine Applications
Authors Aouidat F, Boumati S, Khan M, Tielens F ![]() , Doan BT, Spadavecchia J
, Doan BT, Spadavecchia J ![]()
Received 26 July 2019
Accepted for publication 2 October 2019
Published 29 November 2019 Volume 2019:14 Pages 9309—9324
DOI https://doi.org/10.2147/IJN.S224805
Checked for plagiarism Yes
Review by Single anonymous peer review
Peer reviewer comments 2
Editor who approved publication: Dr Thomas Webster
This paper has been retracted.
Fatima Aouidat,1 Sarah Boumati,2 Memona Khan,1 Frederik Tielens,3 Bich-Thuy Doan,2 Jolanda Spadavecchia1
1CNRS, UMR 7244, CSPBAT, Laboratory of Chemistry, Structures and Properties of Biomaterials And Therapeutic Agents University Paris 13, Sorbonne Paris Cité, Bobigny, France; 2UTCBS – Chimie ParisTech – University Paris Descartes - CNRS UMR 8258 – INSERM U1022 Equipe “Synthesis, Electrochemistry, Imaging and Analytical Systems for Diagnostics” SEISAD, Paris, France; 3General Chemistry (ALGC), Vrije University of Brussel (Free University Brussels-VUB), Brussel, Belgium
Correspondence: Jolanda Spadavecchia Email [email protected]
Introduction: The development of biopolymers for the synthesis of Gd(III) nanoparticles, as therapeutics, could play a key role in nanomedicine. Biocompatible polymers are not only used for complex monovalent biomolecules, but also for the realization of multivalent active targeting materials as diagnostic and/or therapeutic hybrid nanoparticles. In this article, it was reported for the first time, a novel synthesis of Gd(III)–biopolymer–Au(III) complex, acting as a key ingredient of core-shell gold nanoparticles (Gd(@AuNPs).
Material and methods: The physical and chemical evaluation was carried out by spectroscopic analytical techniques (Raman spectroscopy, UV-visible and TEM). The theoretical characterization by DFT (density functional theory) analysis was carried out under specific conditions to investigate the interaction between the Au and the Gd precursors, during the first nucleation step. Magnetic features with relaxivity measurements at 7T were also performed as well as cytotoxicity studies on hepatocyte cell lines for biocompatibility studies. The in vivo detailed dynamic biodistribution studies in mice to characterize the potential applications for biology as MRI contrast agents were then achieved.
Results: Physical–chemical evaluation confirms the successful design and reaction supposed. Viabilities of TIB-75 (hepatocytes) cells were evaluated using Alamar blue cytotoxic tests with increasing concentrations of nanoparticles. In vivo biodistribution studies were then accomplished to assess the kinetic behavior of the nanoparticles in mice and characterize their stealthiness property after intravenous injection.
Conclusion: We demonstrated that Gd@AuNPs have some advantages to display hepatocytes in the liver. Particularly, these nanoconjugates give a good cellular uptake of several quantities of Gd@NPs into cells, while preserving a T1 contrast inside cells that provide a robust in vivo detection using T1-weighted MR images. These results will strengthen the role of gadolinium as complex to gold in order to tune Gd(@AuNPs) as an innovative diagnostic agent in the field of nanomedicine.
Keywords: Gd-gold complex, theoretical study, MRI, relaxivity, biodistribution
Introduction
In recent decades, hybrid nanomaterials have been intensively investigated in the field of nanomedicine,1–3 diagnosis,4 and imaging.5,6 The consolidation of several functional materials into nanocomposites makes up new opportunities in order to improve a variety of emerging applications of hybrid nanomaterials.7–9
The application area in which nanoparticles have obtained remarkable profit is in the biomedical field and in particular in diagnostic imaging.10 Several types of nanoparticles have been inquiring for several imaging applications which include biomolecules,11 metal oxides,12 and semiconducting nanomaterials.13 Recently, gold nanoparticles (AuNPs) have been regarded as the common choice of imaging contrast and theranostic agents due to their optochemical properties, biological efficiency as biomarkers, strong X-ray absorption coefficients and efficient high-Z nanoparticle radio-enhancement, NIR light-responsive agent to create nanosized contrast agents with molecular specificity.14–16 The nanoparticle selected is dependent upon the required imaging modality;17 gadolinium (Gd) owns a wide magnetic moment and seven unpaired electrons in the external shell, which are carried out as a clinical positive contrast agent for MRI as chelates.18 The clinical contrast agents for CT (cancer treatment) are principally based on tri-iodobenzene, which can effectively absorb X-rays. Unfortunately, the short circulation time of the Gd chelates and iodinated compounds, due to the nature of the small molecules under a few nanometer sizes, can limit the relative imaging technique from reaching the pathologic tissue of interest to be detected and from collecting the prerequisite information. Moreover, it is laborious to promote the grafting of small molecules for active targeting.19
Nanomaterials based on Gd(III) and AuNPs have recently showed significantly increased relaxivity values in magnetic resonance imaging (MRI) due to geometrical confinement of Gd(III)–chelate compounds into porous structures compared to those with free chelated Gd(III)complexes.20
The payload of gadolinium, particularly under its Gd(III) form in NP structures, has a notable effect in plenty of research fields from plasmonics to nanomedicine applications.21–23
Nevertheless, strategies to load NPs as contrast agents used in MRI, in harsh or poor loading conditions, result in NP surface modifications that alter the targeting in vivo.24
To provide a safe application in biological media, and to understand the importance of cationic metals in biological systems (charge balancing, stabilizing structures, catalyzing reactions, … ), gadolinium ions must be chelated to prevent the release of metal in the body. Another option could be the incorporation of the cations in “safe” nanostructures, and keeping in mind that also the final design of the complex-hybrid NP might combine both options after being assembled together. In the recent literature, a fast synthesis method to develop polymer-modified AuNPs using biopolymers as stabilizers, under biological conditions,25–27 has been described. Other authors have synthesized and described hybrid nanoparticles based on sugar stabilizers for different applications in nanomedicine.28
In this article, three bimetallic nanoformulations (Gs@AuNPs) named NP1, NP2 and NP3, including Au–Gd complex wrapped into a biopolymer structure, were designed and synthetized. Furthermore, these nanovectors including paramagnetic Gd(III) ions provided potential interesting magnetic for MRI.
The purpose of the study is also the development of innovative molecular imaging methods based on the dynamic recording of the uptake and clearance of novel imaging probes. Indeed, the quantitative pharmacokinetics of theranostic nanovectors allowed the study of in vivo behavior, necessary to determine the stealthiness and targeted property of the probes, and supply the final biomolecular mapping for the determination of the diagnosis and the efficiency of a therapy. These novel perspectives will have a decisive impact on the evolution of high hybrid nanomaterials used in nanomedicine.
Experimental Section
Materials
Tetrachloroauric acid (HAuCl4*3H2O), gadolinium chloride hexahydrate (GdCl3*6H2O), sodium borohydride (NaBH4), phosphate buffer solution (PBS, pH4.0, 7.2–9.0), sodium chloride (NaCl), culture media cell (DMEM), dicarboxylic polyethylene glycol (PEG)-600 (PEG), collagen Type I from calf skin (COL) and chitosan (deacetylated chitin, Poly(D)-glucosamine) (CHIT) were purchased from Sigma-Aldrich (Saint-Quentin Fallavier, France). All chemicals were used as such without further purification. Milli Q water was used throughout the experiments. TIB-75 cell line was purchased from ATCC (Americal Type Culture Cells, USA).
Physical-Chemical Characterization
All characterizations were performed in triplicate in order to confirm the reproducibility of the synthetic and analytical procedures.29
UV-Vis absorption spectroscopy: As previously mentioned, absorption spectra were recorded in the 350–900 nm spectral range in water at Gd@AuNP concentration equal to 0.28 mM for [Au] and 13.94 mM for [Gd].
Transmission electron microscopy (TEM): Transmission electron microscopy was performed as previously described.29
Scanning electron microscopy-energy dispersive x-ray analysis (SEM-EDX): Scanning electron microscopy (SEM) investigation was performed on an environmental SEM (ESEM, Quanta 200 FEG, FEI Company Hillsboro, OR) equipped with an (EDX) spectrometer (Genesis 2000, XMS System 60 with a Sapphire Si/Li Detector from EDAX Inc., Mahwah, NJ, USA).
Raman spectroscopy: The Raman experiments were carried out as previously described.29
Dynamic light scattering (DLS): DLS analysis was performed as described previously.29
Zeta potential measurements: The zeta potential of Gd@AuNPsin aqueous solution was carried out as described above.29
Release Kinetics Under Acidic Conditions
The release of the Gd@AuNPs was carried out in buffers of pH 4.0 under specific conditions.20 In a glass vial, 1 mL of Gd@AuNPs was dissolved in 50 µL of phosphate buffer of the required pH and the solution was stirred at 37°C of temperature. After 10 mins, 1 mL of dispersion was withdrawn and centrifuged to separate the dye (rose bengal RB) released from the particles.30 The amount of RB released from the NPs was evaluated by measuring its absorbance at 549 nm in the supernatant.30
Cytotoxicity Test
The cytotoxicity was determined on TIB-75 hepatocytes using the Alamar blue test. The cells were cultured at 37°C in DMEM + Glutamax containing 10% fetal bovine serum (FBS, Gibco Life Technologies), in 96-well plaques of 100 µM of streptomycin and 100 units/mL of penicillin. They were maintained in a 5% CO2-humified atmosphere and passaged twice a week by removing the adherent cells with 0.05% Trypsin-EDTA. Fluorescence measurements at 570 nm were performed on a TECAN Infinite 200 plaque reader and IC50 was assessed from the normalized values using Graphpad Prism software.
In vitro Relaxivities Studies
Samples of MNPs and UMLs were diluted in injection buffer (0.108 M NaCl, 0.02 M sodium citrate and 0.01 M HEPES) at various concentrations of Gd (0, 0.1, 0.5, 1.0, 3 mM).
In vitro relaxivity experiments were carried out by recording T1 and T2 maps with a 7T MR imaging vertical spectrometer fitted with an ultra-shielded refrigerated magnet (300WB, Bruker, Avance II, Wissembourg, France) and equipped with a nominative 200 mT/m actively shielded gradient. The software Paravision 5.1 allowed the acquisitions with the following parameters: for T1 map: RARE images; TE = 13 ms; TR = 15 s, 8 s, 3 s, 1.2 s, 0.8 s, 0.594 s, 0.3 s, 0.144 s, 0.05 s, 0.033 s, RARE factor 2; for T2 map: multi-echo MSME images: hermitian pulse, TR/TE = 15 s/11 ms, 32 echos. Fields of view of 3 × 3 cm2, a matrix size of 128 x 64 and a slice with a thickness of 1.5 mm were used for T1 and T2 maps. Relaxation times T1, T2 and T2* of each sample were calculated by fitting (for T1: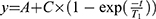 ; for T2 and T2*:
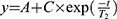 ).
).
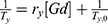
Molar relaxivities r1 and r2 in mM−1.s−1 were obtained using the following equation:
In vivo Biodistribution Studies by MRI
Biodistribution studies were achieved in vivo by MRI21 to assess the uptake and clearance from kidney, muscle, spleen, and liver more easily observable by MRI, a noninvasive in vivo bioimaging method.
All animal work was performed in accordance with the institutional animal protocol guidelines in place at the University Paris Descartes, saisine CEEA34.JS.142.1 and approved by the Institute’s Animal Research Committee.
Wild-type female 8-week BALB/c mice were anesthetized by isoflurane (1.5% air/O2 0.5/0.25 L.min−1) inhalation and positioned into a dedicated contention cradle with monitoring of the breadth and temperature of the animal, thanks to specific detectors. 100 µL of gadolinium Au nanoparticles in saline 0.9% with an optimized concentration of 10 mM of Gd was intravenously injected via the tail vein through a dedicated nonmagnetic 30G catheter while the mouse was in the scanner. One agent (NP3) was imaged representative of the series of agent with n=6 mice for reproducibility.
Images were acquired at 7 Tesla (300 MHz) microimaging spectrometer (Bruker, Karlsruhe Germany) as previously described.51
The scanning protocol was developed using Paravision 5.1 software.
After positioning anatomic slice recorded in axial directions to locate the different organs of the mice, DCE Dynamic Intragate Flash for motion-free artifacts and multislicesT1weighted sequence images were recorded. The final images have a spatial resolution of 117 µm x 117 µm in a plane. The scan time was in the order of 3 mins 14 s per image which was sequentially recorded before and after the contrast agent injection. The dynamic follow-up is measured during a first scan time of 40 mins, then at 3 hrs, 6 h,rs 24 hrs and 48 hrs postinjection.
To study the biodistribution of the nanoparticles, postprocessing of the dynamic images consists in delineation and monitoring of several regions of interest (ROI) into the mouse body MRI images, the liver, muscle, spleen and the kidney. The corresponding MRI intensities related to the amount of the nanoparticle contrast agent were plotted against time to visualize the uptake and clearance of the Gd scaffolds in the organs. Comparison with commercial DOTA-Gd (Guebert, France) as a reference was also performed at the corresponding concentration of Gd (10 mM). Uptake, permanence and clearance times were visually assessed, and semiquantitative kinetic parameters were measured from the dynamic curves and compared to the novel contrast agent.
Stability of Gd@AuNPs
The stability of Gd@AuNPswas monitored by UV VIS. All nanoparticles were dissolved in culture media (DMEM + 10% FBS) solution for 72 hrs (Figure S2 Supporting Information).
Synthesis Procedures of Gd @AuNPs
Synthesis of NP1
10 mL of Gd solution (0.86mM) was mixed with 20 mL of 0.0001M aqueous HAuCl4 solution for 10 mins. After this time, 250 µL of polyethylene glycol 600 diacid (PEG) was added under stirring for 5 mins. After 10 mins, 1.2 mL of NaBH4 (0.01 M) was added dropwise followed by rapid stirring and kept without agitation for 2 hrs. The resulting red-rose solution was centrifuged and purified as described previously.29,31
Synthesis of NP2
NP2 was prepared under the same protocol of NP1.
10 mL of Gd solution was mixed with 20 mL of 0.0001M aqueous HAuCl4 solution for 10 mins. After this time, 250 µL of polyethylene glycol 600 diacid (PEG) was added under stirring for 5 mins; then 500 µL of collagen (COL) and 1 mL was added under stirring at room temperature. After 10 mins, 1.2 mL of NaBH4 (0.01M) was added dropwise followed by rapid stirring and kept without agitation for 2 hrs. The resulting violet solution was centrifuged and purified at the same conditions.
Synthesis of NP3
NP3 was prepared under the same protocol of NP2. 10 mL of Gd solution was mixed with 20 mL of 0.0001M aqueous HAuCl4 solution for 10 mins. After this time, 250 µL of polyethylene glycol 600 diacid (PEG) was added under stirring for 5 mins. Then, 500 µL of collagen and 1 mL of CHIT solutions were added under stirring at room temperature. After 10 mins, 3 mL (and/or 1.2 mL) of NaBH4 (0.01 M) was added dropwise followed by rapid stirring and kept without agitation for 2 hrs. The resulting red-wine solution was centrifuged and purified at the same conditions.
Determination of Gd@AuNPs Concentration
Gd@AuNP concentration was calculated mathematically in a colloidal solution by Lambert–Beer law  . In this equation, A is the maximum absorbance of the UV-visible spectrum,
  is the molar extinction coefficient (equal to 3.07 × 10¹⁰ M−1 cm−1), C is the molar concentration of colloids and l is the optical length of the cuvette (1 cm). The resulting C was multiplied for the dilution factor to obtain the concentration of colloids.32
Purification and Efficiency of Gd@AuNPs
The encapsulation efficiency (percentage of Gd bound to Au-surface) was evaluated as the difference between the initial Gd content and the amount of free Gd in the filtrate after ultrafiltration (Ultrafree MC centrifugal filter units, 30,000 NMWL, Millipore, USA). The reaction efficiency was equal to 75%. Gd@AuNPs were dispersed at concentration of 1.2×10¹² particles/mL in 2.0 mL PBS under physiological conditions. Dialysis was performed with membrane tubing with dialysis tubing Spectra/Por 3 (molecular weight cutoff 3500 Da, Serva Electrophoresis, Germany) with continuous stirring (150 rpm).
Computational Details – DFT Study
The interaction energies were calculated using the ab initio plane-wave pseudopotential approach as implemented in the VASP code.22 The Perdew–Burke–Ernzerhof (PBE) functional23 was chosen to perform the periodic DFT calculations, with accuracy on the overall convergence tested elsewhere.24 The valence electrons were treated explicitly and their interactions with the ionic cores are described by the Projector Augmented-Wave method (PAW),28,37,38 which allows the use of a low-energy cutoff equal to 400 eV for the plane-wave basis. The integration over the Brillouin zone was performed on the point, in all calculations.
In the geometry optimizations at 0 K, the positions of all atoms in the supercell are relaxed in the potential energy determined by the full quantum mechanical electronic structure until the total energy difference between the loops is less than 10−4 eV.
In order to account for the dispersion interaction in the system, DFT-D325 was used, as implemented in VASP, which consists in adding a semi-empirical dispersion potential to the conventional Kohn–Sham DFT energy.
In order to compare the results with the experiment, water was implicitly included in the calculations, by means of the PCM correction as implemented in VASP.26
Results and Discussion
The Formation Mechanism of Gd–Au Complex (Gd@Au)
Several intermolecular interactions between organic compounds and metal chlorides were overcome in order to obtain new molecular systems for medical and biophysical applications.33,34 The key to this study is to apply a Gd@Au chloride complex as building blocks of bimetallic nanoparticles under specific conditions of the reaction.
For this aim, in the first step, GdCl3*6H2O and HAuCl4*3H2O were mixed in ultrapure water solution at room temperature (Scheme 1 panel s1).
 |
Scheme 1 Schematic of the proposed mechanism of GdCl3-AuCl4− reduction of complexation and particle formation (Gd@Au NPs) in the presence of polymer and sugar as surfactants. (Please note that drawings are not in scale and are not intended to be representative of the full sample’s composition and stoichiometry.) |
Figure 1 shows the absorption spectra fingerprint of each solution (GdCl3*6H2O, HAuCl4*3H2O) and the complex of them (Gd@Au). The UV-Vis spectra showed typical spectra of HAuCl4*3H2O (black line) with 2 prominent peaks at 256 nm and 290 nm (black line in Figure 1A). When GdCl3*6H2O was added to the HAuCl4*3H2O solution, a chemical–physical modification appeared evidenct in the UV-Vis spectra (blue line in Figure 1A). The optical modification in the absorption spectra was indeed characterized by an intensity decrease and blue shift of the peak at 280 nm, due to the electronic transition associated with Gd-AuCl2− ions upon complexation. The evolution of the Gd@Au complex was still monitored under acidic and alkaline conditions by a localized surface plasmon technique (LSP). Figure S1 in Supporting Information shows evidence of two absorption peaks at 242 nm and 308 nm under acidic conditions (PBS; pH 4) compared to a singular peak at 235 nm under basic conditions (PBS; pH 9). This spectroscopic behavior principally originates from the simultaneous participation of protonic and/or anionic groups into electronic transition bands conferring the appearance and/or disappearance of plasmon peaks in the UV–VIS spectra, confirming the hybrid complex arrangement.
 |
Figure 1 (A) UV-Vis absorption of HAuCl4·3H2O (black line), GdCl3*6H2O (red line); Au–Gd complex (blue line) in the range 200–900 nm (B) Raman spectra of Gd@Au complex (blue line) in the range 200–3000 cm−1, compared to HAuCl4·6H2O (black line), GdCl3·6H2O (red line) as controls. Experimental conditions: λexc = 785 nm; laser power 20 mW; accumulation time 180 s. |
Raman spectroscopy (Figure 1B) also displays a peak at 477 cm−1 due to Gd-Au-Cl and the disappearance of the peaks at 655 cm−1 and 550 cm−1 due to Gd-OH and Au-OH stretching. This spectroscopic behavior was associated with π-π* electronic transitions due to the interactions between GdCl3 and AuCl2− ions,8,35 and this gives better evidence of the complex formation confirming the electronic delocalization thought the bimetallic complex.8
The Formation Mechanism of Core-Shell Gd@Au NPs and the Role of Polymers as a Stabilizing Agent
Many authors have realized the association between Au nanoparticles and Gd chelates in order to realize multimodal MRI/CT contrast agents.17 For this purpose, other scientific investigations based on Gd-chelate-embedded gold nanorods,36,37 Gd-enriched DNA AuNPs conjugates,38 and grafting Gd chelates on gold nanostructures as multimodal MRI/CT contrast agents have been carried out. Thanks to the small sizes of Gd chelates, a low magnetic center Gd(III) payload for the particle prevents further bioconjugation and active targeting of AuNPs in biomedical applications.39 In contrast to previous works, a novel Au(III)–Gd(III) complex, entrapped in polymeric chains, was used as building blocks to form core-shell bimetallic nanoparticles (Gd@Au NPs).
The synthesis of Gd@AuNPs named NP1-NP2-NP3 was carried out by reducing tetraclororoauric acid in the presence of gadolinium salt and different biocompatible polymers (PEG-diacid COL, CHIT) using sodium borohydride (NaBH4) as a reducing agent. Particle formation and growth were controlled by the amphiphilic character of the polymers and include main steps (Scheme 1): (1) complexation between GdCl3 and AuCl4− to form gold-gadolinium clusters (Gd(III)–Au(III)) (Scheme 1- panel s1), (2) adsorption of COOH-terminated PEG polymer molecules onto Gd(III)–Au(III) complex and initial reduction to Gd(III)–Au(II), (3) interaction of collagen (COL) and chitosan (CHIT) molecules, respectively, by electrostatic forces (Scheme 1: panel s2), (4) complete reduction and growth of gadolinium-gold particles (Scheme 1: panel s3). In the latter case, Gd@Au complex molecules are expected to be involved in the nucleation process and may, thus, influence the final shape and size of nanoparticles (NP1-NP2-NP3).
Spectroscopic Evaluation of Gd@Au NPs
Previously, Boyes et al40 have grafted thiol-terminated polymer chains onto Gd nanocomposite through the coordination of the thiolate end group with Gd(III) ions.41
The employment of polymer has shown a strong interaction between Gd composite and AuNPs.17,40,42 In the present study, it was demonstrated that the introduction of the polymer as the chelating surfactant plays a key role in the final form of bimetallic nanoformulation.
TEM images of NP1 embedded in a shell of PEG showed a metal core of diameter around 20 ± 1 nm (Figure 2A-a1 left panel, above; low magnification) with a hydrodynamic layer of about 80 nm due to polymeric bimetallic complex (Figure 2A right panel, above; high magnification). Unlike nanostructures that were obtained with NP2.
 |
Figure 2 (A) Low and high magnification of TEM images and (a1-a2-a3) size distribution histogram of Gd@AuNPs as NP1-NP2-NP3 scale bars: 50 nm and 20 nm. |
They exhibited a polyedric-like shape, embedded in a shell of PEG and COL, in which metal nanoparticles showed a diameter around 40 ± 2 nm (Figure 2A-a2 middle panel; left low and right high magnification) with a hydrodynamic layer of about 5 nm. Similar polyhedral nanostructures have been previously obtained, thanks to the growing of macromolecules onto [110] gold facet.31 In our case, it was supposed that during the growing process, COL and PEG undergo a conformational chemical arrangement responsible for adsorption onto the preferentially [110] gold facet, consequently with the achievement of a polyhedral shape. TEM images to NP3 display a snowflake-like shape, embedded in a shell of PEG, COL, and CHIT with a diameter around 60 ± 2 nm (Figure 2A-a3 left panel, below; low magnification), with a layer average thickness of 3.5 ± 1nm (Figure 2A right panel, below; high magnification). Beforehand, we revealed the synthesis of comparable nanostructures utilizing dicarboxylic PEG, chitosan28,29,32 and drugs,27,30,31 while characteristic snowflakes nanoparticles were acquired by consolidating protoporphyrin particles in the development solution of AuNPs.27 On the basis of previous studies,25–27 it was assumed that this chemical behaviour is attributed to a different adsorption behavior onto gold facets [1.1.0] of CHIT onto complex PEG-COL-GdAuCl2−, based on their different steric conformation of chemical groups during nucleation and growth process of Gd@AuNPs. Hence, it was assumed that, when the polymer ligands were added to the Gd@Au solution, the carboxylic group of polymer, being initially bound to Gd(III)–Au(III) clusters electrostatically, was embedded in dicarboxylic PEG in a mushroom conformation27,29 and then bounded with COL and CHIT, respectively, in order to form hybrid- core-shell nanoparticles. Accordingly, it is possible to obtain different shapes and sizes of NPs, by varying the concentrations of reagents and the order of the added mixture in the reaction. In this way, the behavior of each polymer in the formation of bimetallic micelles during the growth process of nanoparticles can be modulated.
Figure 3A reports the absorption spectra of Gd@Au NPs, all characterized by peaks at 300 nm and 238 nm, and a surface plasmon band in the range 530–560 nm. The slow shift of the band position depends on the ratio of the gold salt and the capping materials during the reaction processes. NP1 (red line Figure 3A) shows a plasmon peak at 560 nm. This peak is assigned to collective surface plasmon oscillation of the metal electrons in the conduction band, due to the interaction of electrons with the light of that wavelength. PEG can be used as stabilizing polymers due to the formation of coordination bands between Au(III) and Gd(III) ions with carboxylic groups. This chelation evenly better dispersed Au ions and Gd which were reduced to form Gd@Au NPs of relatively uniform size. NP2 (blue line) and NP3 (green line) in Figure 3A shows a strong resonance band at around 222 nm and a weaker one at 300 nm. A shift and a strong decrease of the plasmon peak to 534 nm for NP2 and 555 nm for NP3 was observed. This spectroscopic behavior is due to the steric arrangement of PEG, COL and CHIT as stabilizers during the synthetic process with the amine or carboxylic groups, respectively. We suppose that this phenomenon is due to electronic delocalization through polymer chain–metal complex and HOMO–LUMO transition, confirming that polymers (PEG, COL, CHIT) were effectively involved in the nucleation process and creates an interaction with Gd-Au.
 |
Figure 3 (A) normalized UV-Vis absorption of Gd@AuNPs: NP1 (red line), NP2 (blue line) and NP3 (green line) in the range 300–900 nm and (B) Raman spectra Gd@AuNPs (NP1-NP2-NP3) products. Experimental conditions: λexc = 785 nm; laser power 20 mW; accumulation time 180 s. |
The NP sizes were confirmed by DLS measurements (Table S1 in Supporting Information). Zeta potential measurements show that Gd@AuNPs were colloidally stable at physiological pH. The synthesized Gd@AuNPs (NP1-NP2-NP3) show a negligible change in the LSP band position over a period of 72 hrs in cell culture media (DMEM+10% FBS) (Figure S2 in Supporting Information).
Raman spectroscopy and surface-enhanced Raman scattering were used to confirm the influence of Gd ions in Au–polymer nanoparticles. As described previously,23 the presence of Gd ions enhances the Raman signal of biomolecules (protein, natural polymer) capped onto gold nanoparticles (AuNPs).
Raman spectra of Gd@AuNPs at 4.5 × 10⁻⁴ M are shown in Figure 3B. The region from 1200 to 1550 cm−1 corresponds to the vibrations of N-H bending and C-N stretching, while the region between 1550 and 1750 cm−1 corresponds to the C=O stretching mode. The band observed near 836 cm−1 corresponds to vibrations of the aromatic ring. This enhancement is the result of the electric field around the gold nanoparticles that interact with collagen molecules, in the presence of gadolinium.
The characteristic vibration mode for the amine group is located at 1630 cm−1 (highlighted band in Figure 3B). This band shows a Raman signal enhancement factor 40 times higher than that for free collagen.43 The increment in the Raman signal of collagen could be due to a combination of three factors: (i) formation of well-defined hot-spots, where Gd(III) ions work as spacers between gold nanoparticles; (ii) the refractive index contrast produced by the presence of Gd(III) ions can cause an increment in the electric field around the nanoparticle producing a higher enhancement factor and (iii) a charge transfer effect between gold nanoparticles and Gd(III) ions.44,45
Gd@AuNPs were characterized by EDX microanalysis, in which the simultaneous presence of Gd and Au of all nanoparticles was qualitatively proven (Figure S3 Supporting Information).
Kinetic Release and Disaggregation
Release kinetics is a crucial parameter for biomedical application of NPs.30,46 We decided to realize this study onto NP3 since it appears as the best candidate in terms of biological stability and MRI contrast agent. The release of Gd(III) as gold complex from was carried out in buffer solutions, under acidic (PBS; pH 4) and temperature conditions (37°C). The kinetic process was investigated by LSP and Raman spectroscopy. At pH 4.0, the release of 2% was noticed after 18 h and remained almost the same even after 180 h (Figure S4A in the Supporting Information). The Raman band at 260 cm−1 was monitored to assess Gd(III) release from NP3. We performed our measurements each hour, noting a remarkable spectral change after 24 hrs, until complete-increase after 48 hrs (Figure S4B in the Supporting Information). These findings established that Gd(III) release was pH and time dependent after long term. We believe that during incubation at pH 4, Gd@Au complex migrates in the PEG and CHIT chains and is released upon CHIT-PEG-GdAuCl2−. This scientific speculation can explain depolymerization and the change of size at different pH47 (Figure S4C in the Supporting Information). We also observed a gradational modification of shape and size from nanoflowers of about 60 nm (as synthesized) (Figure S4C panel a t=1 hr) to small nanospheres of about 5 nm (pH 4.0) (Figure S4C panel d, t=72 hrs). Between these two states, we relieve an intermediate one in which a morphological variation, as well as depolymerization from the original structure, was more evident (Figure S4C panel b, c). We deduce that, under pH conditions, a strong change of shape and size of NP3 was made and Gd(III) was released as gold complex, as previously described for other experiments.27,47
Computational Results
In order to investigate the interaction between the Au and Gd precursors being considered as the very first nucleation step of the particles studied, a molecular geometry study at the DFT level corrected for dispersion interactions was performed.
The precursors contain Cl− and OH− ligands. The ligand stoichiometry depends on the pH at which the synthesis is performed (Figure 4). As it was shown in one of our earlier studies on the Au precursor, the presence of Cl− has an impact on the interaction that drives the nucleation and the interaction with its environment.48
 |
Figure 4 The square planar (AuX4)+ precursor and the GdX3 precursor with X = Cl or OH. |
Both precursor molecules were positioned in each other’s neighborhood (Au-Gd distance ͌ 7 Å) followed by a geometry optimization. The different start geometries were investigated and at every metastable converged geometry an extra geometry optimization was performed until the total energy of the complex could not be lowered (stabilized) more. This procedure was undertaken for every combination of Cl−/OH− and this for every relative position around the Au and the Gd center. The interaction energy is calculated as follows:
(1)
A graphical representation of the interaction energies (see equation 1) between both metal complexes for every value of x and y is presented in Figure 5.
 |
Figure 5 (graph right) Interaction energy ΔEint as a function of the Cl substitution around Au and Gd for the complex HAu(OH)4-xClx and Gd(OH)3-yCly. Energies in eV. The values on the x-axes correspond to the x values, while the numbers in the legend correspond to the y values. The ΔEint for y = 1 is connected with a red line. (A) Geometry of the most stable HAu (OH)4-xClx···Gd (OH)3-yCly complex. (B) Geometry of the least stable HAu(OH)4-xClx···Gd(OH)3-yCly complex, showing a distorted trigonal geometry for Gd and a hydrogen bond between the Au and the Gd complex. The distance between both metal centers is 2.35 Å – 3.06 Å for structure a and b, respectively. |
It can be seen that the presence of chlorine influences the interaction energy in a nonlinear way (see e.g. red line in Figure 5). Indeed, the position and the number of Cl− around each metal center influence the stabilization of the complex. Moreover, it is interesting to note that one can divide the interactions into the following types: OH-OH, OH-Cl, Cl-Cl, and Gd-Au.
The most stable configuration is found for GdCl3 interacting with HAuHau(OH)4 (ie, x = 0, y = 3; −4.19 eV) (Figure 5A). The presence of one Cl− on the Au metal complex destabilizes it with 0.18 eV. From this result, one has to conclude that the H-bond interaction, which is expected to be formed between the complexes containing OH-groups, does not compete with the metal–metal interaction in the complex and that Cl–Cl halogen bonding is, as expected, weaker than a hydrogen bond.
The destabilizing effect takes place after the addition of one Cl− on the Au center, even with the addition of a second and a third Cl−. Nevertheless, the complexes do not reach the stabilization found for the HAu(OH)4 … GdCl3 complex containing no Cl− on Au.
It is clear that this form of the precursor is the best for the Au precursor to interact with the Gd-precursor. Just for the sake of completeness, the HAu(OH)3Cl … Gd(OH)Cl2 is found as the least stable one. However, two questions emerge: What is the stabilizing effect between the OH-Cl groups? And, what is the effect of the relative distribution of the Cl groups around the metal center of the interaction energy?
The geometry of this complex shows the Penta-coordination of Gd, the presence of bridging OH groups between Gd and Au and the shift of the H atom on an Au-OH group. Gd shows a high affinity for Cl, whereas Au prefers OH groups in our calculations. In general, the geometrical feature that destabilizes the complex is the presence of Cl between the metal centers.
Having these stability trends in mind, what about the Cl content of the complexes in experimental conditions, especially, the role of the pH on the Cl content of the complexes? For the Au precursor, it is known that the optimal nucleation conditions for the formation of gold nanoclusters are in the range of 6–9. The gold complex at this optimal pH is shown in Figure 5B which corresponds to HAu(OH)Cl3. Surprisingly, it is this precursor type that has the strongest destabilizing effect.
The gold complex was found to decrease its affinity for the Gd complex with an increasing number of Cl− groups.48 However, in the actual case of interaction with a Gd complex, the opposite trend is observed, ie, GdCl3 interacts more strongly with Au(OH)3Cl than the Gd hydroxides.48 The explanation for this contrasting finding can be explained by electronegativity softness (polarizability) competition.49 From the very low electronegativity of Gd compared with the very high electronegativity of Au, ie, 1.20 and 2.54 on the scale of Pauling, respectively, it is clear that the polarity of the ligands is largely affected, which can explain this opposite trend compared with Au or other more electronegative elements, such as Si, as was found in the case of silica (Si-OH groups). The hydroxylated Gd complex is found to more strongly interact than the chlorinated ones in accordance with the higher electronegativity of the oxygen atoms. In contrast, the interaction decreases upon chlorination resulting from the higher polarizability, charge capacity or softness of Cl−.
The Cl− surrounding Gd can attract more charge and thus interact more strongly. Earlier, delicate uncommon earth metal ion unequivocally reinforced with too hard donor oxygen atoms has been clarified by Pearson’s HSAB principle.37 With this trend in mind, one can predict the optimal conditions to form Gd–Au clusters; ie, the hypothetical pH conditions in which Gd is surrounded by Cl and Au by OH groups, ie, basic conditions.
In Vitro Cytotoxicity and Relaxivity
Viabilities of TIB-75 (hepatocytes) cells were evaluated using Alamar blue cytotoxic tests with increasing concentrations of nanoparticles. Figure 6A shows mild toxicity at Gd concentrations above 0.2 mM concentration to 3.8 mM. The in vivo injected amount should, therefore, be inferior, respectively, from 2 to 38 mM of Gd.
 |
Figure 6 (A) Viability by Alamar Blue assay of TIB-75 (hepatocytes) cell lines after incubation with Gd@AuNPs (NP1-NP2-NP3); (B) Examples of MRI images of T1 and T2 weighting of Gd@AuNPs recorded at 7T showing the efficient T1 type features of the contrast agent for MRI at 7T with hyper signal for higher Gd concentration. |
Relaxivities in solution were measured at 7 Teslas and were compared to Dotarem Gd complex commercial MRI contrast agent. Values of longitudinal and transverse relaxivities r1 and r2 are given for these three types of objects in Figure 6B and Table 1.
 |
Table 1 Values of Relaxivities R1 and R2 are Expressed in (Mm−1.s−1) Measured at 7T And Corrected (Second Lines) from ICP AES Elementary Analysis (Institut Physique Du Globe (IPG) ICP AES Facility, Paris); R2/R1 Ratio Is Calculated to Evidence the T1 Type MRI Contrast Agent (>1) |
Gd(III) complex contrast agents are well known for their contrast agent properties in MR imaging. They provide a hypersignal in appropriate T1-weighted MRI acquisition sequences. Gd@Au nanoparticle longitudinal relaxivity r1 increases with a better result for NP3, compared to the one of Gd(III) Dotarem and with smaller values as expected compared to free Gd(III) ions. Noteworthy, the r1 relaxivity values increase with the NP core sizes 19, 40 and 60 nm and hydrodynamic diameter of 100, 45 and 64 nm, for, respectively, NP1, NP2 and NP3; 6,4 8,4 and 9,9 mM−1.s−1, which could be rationalized by water accessibility to Gd inner sphere thanks to the decreasing polymer layer size of 80, 5 and 3,5 nm which favoured optimized water exchange rates and is the principal factor affecting r1 relaxivity for this 50-100 nm sized nanoparticles. These r1 values obtained at high magnetic field 7T are exceptionally high for nanoparticles, as usual, Gd CA’ s relaxivities are around 4mM−1.s−1 and that demonstrated the strong efficiency of these novel Gd@AuNPs as contrast agents (CA).
Rotze et al. have performed a synthesis and characterization of a nanoconjugate CA by covalent binding of Gd(III) to thiolated DNA (Gd(III)-DNA), followed by grafting onto gold nanostars (DNA-Gd@stars).50 These 26-nm size conjugates display remarkable r1 with values up to 98 mM−1 at 1.4T. Besides, DNA-Gd@stars show efficient Gd(III) delivery and biocompatibility in vitro, evolve meaningful contrast increase in solution when imaged at 7 T and present potential in vivo applications.
Compared to the literature, the present nanoparticles display improved features in terms of MR imaging.Meade et al have developed Gd(III)–gold nanoconjugates with varied chelate structure and nanoparticle-chelate linker length, showing good biocompatibility, high cellular internalization for cell tracking and MRI abilities at high 7T and 9,4T magnetic field. The r1 relaxivities values at 7T of our Gd@AuNPs are higher by a factor of 1.5 to 2.4 compared to the small size commercial DOTA Gd and the Gd@AuNPs nanoconjugates of 25 nm size.
In Vivo Biodistribution by MRI
In vivo biodistribution studies were then accomplished to assess the kinetic behavior of the nanoparticles in mice and characterize their stealthiness property after intravenous injection. For further nanomedicine application in vivo, nanovectors should indeed circulate long enough more than about 30 mins into the bloodstream to be able to reach a potential targeted tissue, before being captured by the final reticulo-endoplasmic system, here liver and spleen. The NP size superior to 20 nm predicts a hepatic uptake. The natural uptake and clearance pathway for exogeneous scaffolds of a small size under 5 nm is the kidney. The proposed imaging method enabling such in vivo biodistribution is based on dynamic contrast enhanced MR imaging with specific time observation adjusted from min to days. It allows following the organ uptake by kinetic imaging acquisitions to gain the whole process of nanoparticle elimination: liver uptake, remanence and clearance.51,52
Figure 7A and A1 and Table 2 summarize the kinetics of uptake and clearance of NP1, with examples of MRI pictures illustrating the evolution of the signal versus time at each remarkable point (A: initial signal, B: increasing slope, C: plateau, D: decreasing signal). The NP uptake by the liver results in an increase of signal in the liver up to 40% with an increasing duration of 10 mins corresponding to the NP circulation into the bloodstream. The plateau is reached during about 30 mins, meaning the accumulation of the NP into the liver and the decreasing period during 48 hrs corresponds to the clearance time.
 |
Table 2 Timings of Biodistribution of the NP1 Measured In Vivo from DCE MRI in Mice |
 |
Figure 7 (A) Example of dynamic contrast enhanced (DCE) MRI biodistribution in vivo before and after injection of v=100 µL of the solution of NP1 during 48 hrs post injection. (A1) Enhancement of the signal visualized the uptake of the NP in the organ and the disappearance of the signal showed its clearance. |
The biodistribution in other organs (spleen and kidney) was recorded by in vivo DCE MRI at 7T and is shown in Figure S5 in Supporting Informations. Semiquantitative kinetic parameters can be deduced from the DCE curves. The biodistribution in the spleen looks like the liver one. In the kidney, the uptake is immediate corresponding to the perfusion through the cortex and the clearance took place after 3 to 5 hrs postinjection. The CA is not eliminated by the glomerular filtration as shown by the expected lack of medullar and bladder signal.
It is of interest to compare these results with the biodistribution of the small size commercial contrast agent DOTAREM (Table 3). Indeed, as Figure S5 displays, the uptake in kidney is quick and the clearance phase immediately follows during 3 hrs, corresponding to a half-life of 90 mins. In the liver, the clearance is also rapid within about 1 hr, corresponding to a vascular complementary circulation. To sum up, DOTAREM is eliminated more quickly about 10 times faster than the NP1. The mid-size and in particular the polymer PEG coating of the NP could rationalize its long circulating behavior, as expected from the PEG stealthiness ability showing the efficiency of the novel NP as a contrast agent for biomedical applications.
 |
Table 3 Comparison of Timings oiodistribution with Commercial DOTAREM |
Conclusion
In this article, the development of new chemical polymeric core-shell nanostructures, whose optical and morphological properties are optimized for their application in therapeutic targeting, diagnosis and therapy. In contrast to previous works, a new strategy of gadolinium complexes to gold ions, and then stacking with biopolymer matrix was employed. Chemical–physical characterization studies were led broadly and completely explained the arrangement system of the nanostructure just as the conformational changes related to such procedures. We demonstrated that Gd@AuNPs have some advantages to display hepatocytes in the liver. Particularly, these nanoconjugates give a good cellular uptake of several quantities of Gd @NPs into cells, while preserving a T1 contrast inside cells that provide a robust in vivo detection using T1-weighted MR images.
After in vitro assays of cytotoxicity and imaging, in vivo assays of dynamic biodistribution were recorded showing liver, spleen, kidney/blood biodistribution and blood stealthiness. Given these encouraging results, this bimetallic core-shell-nanomaterial system represents a veritable promise as a therapeutic entity in the field of medicinal applications.
Acknowledgement
With the support of SATT IDF Innov, J.S. has filed a patent application on the nanoparticles presented in this manuscript, nanomaterial and method of production of a nanomaterial for medical applications, such as MRI or SERS - Inventor: Jolanda Spadavecchia, European Patent Application number EP17305087.3, filed January 27, 2017, and PCT application PCT/EP2018/051988 filed January 26, 2018. This work has been partly performed on the CNanoMat platform of the University Paris 13 and the National natural science foundation of China under grant 81430063. Computational resources and services were provided by the Shared ICT Services Centre funded by the Vrije Universiteit Brussel, the Flemish Supercomputer Center (VSC) and FWO. The MRI experiments were performed at the LIOPA/uMRI imaging facility belonging to the consortium Plateformesd’Imageries du Vivant of Paris Descartes, PIV and UTCBS/SEISAD/ENSCP team. The IDEX SPC Sorbonne Paris Cité IDV Imageries du Vivant is also acknowledged. We also thank the Ecole Doctorale of Université PSL, U406 for financing SB’s thesis and KawtherFeddag, MS student of University of Nancy, Master BSISfor the biological assays.
Disclosure
The authors report no conflicts of interest in this work.
References
1. Genchi GG, Marino A, Tapeinos C, Ciofani G. Smart materials meet multifunctional biomedical devices: current and prospective implications for nanomedicine. Front Bioeng Biotechnol. 2017;5:80. doi:10.3389/fbioe.2017.00080
2. Marchesan S, Prato M. Nanomaterials for (Nano)medicine. ACS Med Chem Lett. 2013;4(2):147–149. doi:10.1021/ml3003742
3. Sanna V, Nurra S, Pala N, et al. Targeted nanoparticles for the delivery of novel bioactive molecules to pancreatic cancer cells. J Med Chem. 2016;59(11):5209–5220. doi:10.1021/acs.jmedchem.5b01571
4. Oliveira ON
5. Alric C, Taleb J, Le Duc G, et al. Gadolinium chelate coated gold nanoparticles as contrast agents for both X-ray computed tomography and magnetic resonance imaging. J Am Chem Soc. 2008;130(18):5908–5915. doi:10.1021/ja078176p
6. Lemaster JE, Wang Z, Hariri A, et al. Gadolinium doping enhances the photoacoustic signal of synthetic melanin nanoparticles: a dual modality contrast agent for stem cell imaging. Chem Mater. 2019;31(1):251–259. doi:10.1021/acs.chemmater.8b04333
7. Leung KC, Xuan S. Noble metal-iron oxide hybrid nanomaterials: emerging applications. Chem Rec. 2016;16(1):458–472. doi:10.1002/tcr.201500259
8. Aouidat F, Halime Z, Moretta R, et al. Design and synthesis of hybrid pegylated metal monopicolinate cyclam ligands for biomedical applications. ACS Omega. 2019;4(2):2500–2509. doi:10.1021/acsomega.8b03266
9. Yang Y, Zhang Y-M, Chen Y, Chen J-T, Liu Y. Targeted polysaccharide nanoparticle for adamplatin prodrug delivery. J Med Chem. 2013;56(23):9725–9736. doi:10.1021/jm4014168
10. Choi HS, Frangioni JV. Nanoparticles for biomedical imaging: fundamentals of clinical translation. Mol Imaging. 2010;9(6):291–310. doi:10.2310/7290.2010.00031
11. Yasui T, Kaji N, Baba Y. Nanobiodevices for biomolecule analysis and imaging. Annu Rev Anal Chem (Palo Alto Calif). 2013;6:83–96. doi:10.1146/annurev-anchem-062012-092619
12. Bourassa MW, Miller LM. Metal imaging in neurodegenerative diseases. Metallomics. 2012;4(8):721–738. doi:10.1039/c2mt20052j
13. Teske SS, Detweiler CS. The biomechanisms of metal and metal-oxide nanoparticles’ interactions with cells. Int J Environ Res Public Health. 2015;12(2):1112–1134. doi:10.3390/ijerph120201112
14. Wang H, Zhang S, Tian X, et al. High sensitivity of gold nanoparticles co-doped with Gd(2)O(3) mesoporous silica nanocomposite to nasopharyngeal carcinoma cells. Sci Rep. 2016;6:34367. doi:10.1038/srep34367
15. Rodriguez-Castillo M, Lugo-Preciado G, Laurencin D, et al. Experimental and theoretical study of the reactivity of gold nanoparticles towards benzimidazole-2-ylidene ligands. Chemistry. 2016;22(30):10446–10458. doi:10.1002/chem.201601253
16. Rodríguez-Castillo M, Laurencin D, Tielens F, et al. Reactivity of gold nanoparticles towards N-heterocyclic carbenes. Dalton Trans. 2014;43(16):5978–5982. doi:10.1039/c3dt53579g
17. Pan Y, Chen W, Yang J, Zheng J, Yang M, Yi C. Facile synthesis of gadolinium chelate-conjugated polymer nanoparticles for fluorescence/magnetic resonance dual-modal imaging. Anal Chem. 2018;90(3):1992–2000. doi:10.1021/acs.analchem.7b04078
18. Yang C-T, Chuang K-H. Gd(iii) chelates for MRI contrast agents: from high relaxivity to “smart”, from blood pool to blood–brain barrier permeable. Med Chem Comm. 2012;3(5):552–565. doi:10.1039/c2md00279e
19. Garanger E, Hilderbrand SA, Blois JT, Sosnovik DE, Weissleder R, Josephson L, A DNA-binding Gd chelate for the detection of cell death by MRI. Chem Commun (Camb). 2009;29:4444–4446. doi:10.1039/b907375b
20. Sethi R, Ananta JS, Karmonik C, et al. Enhanced relaxivity of Gd(3+)-based contrast agents geometrically confined within porous nanoconstructs. Contrast Media Mol Imaging. 2012;7(6). doi:10.1002/cmmi.1480
21. Sharma S, Paiphansiri U, Hombach V, et al. Characterization of MRI contrast agent-loaded polymeric nanocapsules as versatile vehicle for targeted imaging. Contrast Media Mol Imaging. 2010;5(2):59–69. doi:10.1002/cmmi.364
22. Pan D, Caruthers SD, Chen J, et al. Nanomedicine strategies for molecular targets with MRI and optical imaging. Future Med Chem. 2010;2(3):471–490. doi:10.4155/fmc.10.5
23. López-Neira JP, Galicia-Hernández JM, Reyes-Coronado A, Pérez E, Castillo-Rivera F. Surface enhanced raman scattering of amino acids assisted by gold nanoparticles and Gd3+ ions. J Phys Chem A. 2015;119(18):4127–4135. doi:10.1021/jp511548a
24. Lu HD, Wang LZ, Wilson BK, et al. Copper loading of preformed nanoparticles for PET-imaging applications. ACS Appl Mater Interfaces. 2018;10(4):3191–3199. doi:10.1021/acsami.7b07242
25. Spadavecchia J, Apchain E, Alberic M, Fontan E, Reiche I. One-step synthesis of collagen hybrid gold nanoparticles and formation on Egyptian-like gold-plated archaeological ivory. Angew Chem Int Ed Engl. 2014;53(32):8363–8366. doi:10.1002/anie.v53.32
26. Politi J, De Stefano L, Rea I, et al. One-pot synthesis of a gold nanoparticle-Vmh2 hydrophobin nanobiocomplex for glucose monitoring. Nanotechnology. 2016;27(19):195701. doi:10.1088/0957-4484/27/19/195701
27. Moustaoui H, Movia D, Dupont N, et al. Tunable design of Gold(III)-doxorubicin complex-PEGylated nanocarrier. the golden doxorubicin for oncological applications. ACS Appl Mater Interfaces. 2016;8(31):19946–19957. doi:10.1021/acsami.6b07250
28. D’Amelio N, Esteban C, Coslovi A, et al. Insight into the molecular properties of chitlac, a chitosan derivative for tissue engineering. J Phys Chem B. 2013;117(43):13578–13587. doi:10.1021/jp4067263
29. Spadavecchia J, Movia D, Moore C, et al. Targeted polyethylene glycol gold nanoparticles for the treatment of pancreatic cancer: from synthesis to proof-of-concept in vitro studies. Int J Nanomedicine. 2016;11:791–822. doi:10.2147/IJN
30. Kumar S, Meena VK, Hazari PP, Sharma SK, Sharma RK. Rose Bengal attached and dextran coated gadolinium oxide nanoparticles for potential diagnostic imaging applications. Eur J Pharm Sci. 2018;117:362–370. doi:10.1016/j.ejps.2018.03.008
31. Spadavecchia J, Casale S, Landoulsi J, Pradier C-M. Tuning the shape and size of hybrid gold nanoparticles by porphyrins using seed-mediated synthesis. Chem Phys Lett. 2014;609:134–141. doi:10.1016/j.cplett.2014.06.008
32. Liu Q, Sacco P, Marsich E, et al. Lactose-modified chitosan gold (III)-PEGylated complex -bioconjugates: from synthesis to interaction with targeted Galectin-1 protein. Bioconjug Chem. 2018;29:3352–3361. doi:10.1021/acs.bioconjchem.8b00520
33. Park JA, Reddy PA, Kim HK, et al. Gold nanoparticles functionalised by Gd-complex of DTPA-bis(amide) conjugate of glutathione as an MRI contrast agent. Bioorg Med Chem Lett. 2008;18(23):6135–6137. doi:10.1016/j.bmcl.2008.10.017
34. Nguyen MT, Zhang H, Deng L, Tokunaga T, Yonezawa T. Au/Cu bimetallic nanoparticles via double-target sputtering onto a liquid polymer. Langmuir. 2017;33(43):12389–12397. doi:10.1021/acs.langmuir.7b03194
35. Costes J-P, Dahan F, Dupuis A, Laurent J-P. A genuine example of a discrete bimetallic (Cu, Gd) complex: structural determination and magnetic properties. Inorg Chem. 1996;35(8):2400–2402. doi:10.1021/ic951382q
36. Qin H, Zhou T, Yang S, Chen Q, Xing D. Gadolinium(III)-gold nanorods for MRI and photoacoustic imaging dual-modality detection of macrophages in atherosclerotic inflammation. Nanomedicine. 2013;8(10):1611–1624. doi:10.2217/nnm.12.168
37. Guo T, Lin Y, Li Z, et al. Gadolinium oxysulfide-coated gold nanorods with improved stability and dual-modal magnetic resonance/photoacoustic imaging contrast enhancement for cancer theranostics. Nanoscale. 2017;9(1):56–61. doi:10.1039/C6NR08281E
38. Song Y, Xu X, MacRenaris KW, Zhang X-Q, Mirkin CA, Meade TJ. Multimodal gadolinium-enriched DNA gold nanoparticle conjugates for cellular imaging. Angew Chem Int Ed Engl. 2009;48(48):9143–9147. doi:10.1002/anie.200904666
39. Rammohan N, Holbrook RJ, Rotz MW, et al. Gd(III)-gold nanoconjugates provide remarkable cell labeling for high field magnetic resonance imaging. Bioconjug Chem. 2017;28(1):153–160. doi:10.1021/acs.bioconjchem.6b00389
40. Boyes SG, Akgun B, Brittain WJ, Foster MD. Synthesis, characterization, and properties of polyelectrolyte block copolymer brushes prepared by atom transfer radical polymerization and their use in the synthesis of metal nanoparticles. Macromolecules. 2003;36(25):9539–9548. doi:10.1021/ma035029c
41. Rowe MD, Chang CC, Thamm DH, et al. Tuning the magnetic resonance imaging properties of positive contrast agent nanoparticles by surface modification with RAFT polymers. Langmuir. 2009;25(16):9487–9499. doi:10.1021/la900730b
42. Debouttière P-J, Roux S, Vocanson F, et al. Design of gold nanoparticles for magnetic resonance imaging. Adv Funct Mater. 2006;16(18):2330–2339. doi:10.1002/(ISSN)1616-3028
43. Gullekson C, Lucas L, Hewitt K, Kreplak L. Surface-sensitive raman spectroscopy of collagen I fibrils. Biophys J. 2011;100(7):1837–1845. doi:10.1016/j.bpj.2011.02.026
44. Freeman LM, Pang L, Fainman Y. Maximizing the electromagnetic and chemical resonances of surface-enhanced Raman scattering for nucleic acids. ACS Nano. 2014;8(8):8383–8391. doi:10.1021/nn5028664
45. Park W-H, Kim ZH. Charge transfer enhancement in the SERS of a single molecule. Nano Lett. 2010;10(10):4040–4048. doi:10.1021/nl102026p
46. Juneja R, Roy I. Surface modified PMMA nanoparticles with tunable drug release and cellular uptake. RSC Adv. 2014;4(84):44472–44479. doi:10.1039/C4RA07939F
47. Marguerit G, Moustaoui H, Haddada MB, Djaker N, Chapelle ML, Spadavecchia J. Taxanes hybrid nanovectors: from design to physico-chemical evaluation of docetaxel and paclitaxel Gold (III)-PEGylated complex nanocarriers. Part Part Syst Charact. 2018;35(2):1700299. doi:10.1002/ppsc.v35.2
48. Wojtaszek A, Sobczak I, Ziolek M, Tielens F. Gold grafted to mesoporous silica surfaces, a molecular picture. J Phys Chem C. 2009;113(31):13855–13859. doi:10.1021/jp9036815
49. Damoun S, Langenaeker W, Van de Woude G, Geerlings P. Acidity of halogenated alcohols and silanols: competition of electronegativity and softness in second and higher row atoms. J Phys Chem. 1995;99(32):12151–12157. doi:10.1021/j100032a016
50. Rotz MWCK, Parigi G, MacRenaris KW, Luchinat C, Odom TW, Meade TJ. High relaxivity Gd(III)-DNA gold nanostars: investigation of shape effects on proton relaxation. ACS Nano. 2015;9(3):3385–3396. doi:10.1021/nn5070953
51. Fredy JW, Scelle J, Ramniceanu G, et al. Mechanostereoselective one-pot synthesis of functionalized head-to-head cyclodextrin [3]rotaxanes and their application as magnetic resonance imaging contrast agents. Org Lett. 2017;19(5):1136–1139. doi:10.1021/acs.orglett.7b00153
52. Ramniceanu G, Doan BT, Vezignol C, et al. Delayed hepatic uptake of multi-phosphonic acid poly(ethylene glycol) coated iron oxide measured by real-time magnetic resonance imaging. RSC Adv. 2016;6(68):63788–63800. doi:10.1039/C6RA09896G
 © 2019 The Author(s). This work is published and licensed by Dove Medical Press Limited. The
full terms of this license are available at https://www.dovepress.com/terms
and incorporate the Creative Commons Attribution
- Non Commercial (unported, 3.0) License.
By accessing the work you hereby accept the Terms. Non-commercial uses of the work are permitted
without any further permission from Dove Medical Press Limited, provided the work is properly
attributed. For permission for commercial use of this work, please see paragraphs 4.2 and 5 of our Terms.
© 2019 The Author(s). This work is published and licensed by Dove Medical Press Limited. The
full terms of this license are available at https://www.dovepress.com/terms
and incorporate the Creative Commons Attribution
- Non Commercial (unported, 3.0) License.
By accessing the work you hereby accept the Terms. Non-commercial uses of the work are permitted
without any further permission from Dove Medical Press Limited, provided the work is properly
attributed. For permission for commercial use of this work, please see paragraphs 4.2 and 5 of our Terms.