Back to Journals » Drug Design, Development and Therapy » Volume 9
Design and in vivo evaluation of oxycodone once-a-day controlled-release tablets
Authors Kim J, Lee S, Park C ![]() , Rhee Y, Kim D, Park J, Lee M, Seo J, Park E
, Rhee Y, Kim D, Park J, Lee M, Seo J, Park E
Received 11 November 2014
Accepted for publication 5 December 2014
Published 30 January 2015 Volume 2015:9 Pages 695—706
DOI https://doi.org/10.2147/DDDT.S77356
Checked for plagiarism Yes
Review by Single anonymous peer review
Peer reviewer comments 2
Editor who approved publication: Prof. Dr. Wei Duan
Ju-Young Kim,1,* Sung-Hoon Lee,2,3,* Chun-Woong Park,4 Yun-Seok Rhee,5 Dong-Wook Kim,6 Junsang Park,3 Moonseok Lee,3 Jeong-Woong Seo,2 Eun-Seok Park2
1College of Pharmacy, Woosuk University, Wanju-gun, Republic of Korea; 2School of Pharmacy, Sungkyunkwan University, Suwon, Republic of Korea; 3GL Pharmtech, Seongnam, Republic of Korea; 4College of Pharmacy, Chungbuk National University, Cheongju, Republic of Korea; 5College of Pharmacy and Research Institute of Pharmaceutical Sciences, Gyeongsang National University, Jinju, Republic of Korea; 6Department of Pharmaceutical Engineering, Cheongju University, Cheongju, Republic of Korea
*These authors contributed equally to this work
Abstract: The aim of present study was to design oxycodone once-a-day controlled-release (CR) tablets and to perform in vitro/in vivo characterizations. Release profiles to achieve desired plasma concentration versus time curves were established by using simulation software and reported pharmacokinetic parameters of the drug. Hydroxypropyl methylcellulose (HPMC) 100,000 mPa·s was used as a release modifier because the polymer was found to be resistant to changes in conditions of the release study, including rotation speed of paddle and ion strength. The burst release of the drug from the CR tablets could be suppressed by applying an additional HPMC layer as a physical barrier. Finally, the oxycodone once-a-day tablet was comprised of two layers, an inert HPMC layer and a CR layer containing drug and HPMC. Commercial products, either 10 mg bis in die (bid [twice a day]) or once-a-day CR tablets (20 mg) were administered to healthy volunteers, and calculated pharmacokinetic parameters indicated bioequivalence of the two different treatments. The findings of the present study emphasize the potential of oxycodone once-a-day CR tablets for improved patient compliance, safety, and efficacy, which could help researchers to develop new CR dosage forms of oxycodone.
Keywords: pharmacokinetics, oral delivery, in vitro–in vivo correlation, double-layer tablet
Introduction
Oxycodone hydrochloride (oxycodone; 14-hydroxy-7,8-dihydrocodeinone) has been used for over 80 years and it has become a leading drug in the group of opioid analgesics worldwide. It is a semi-synthetic opioid agonist that provides effective relief for moderate to severe pain in cancer1,2 and post-operative patients.3 Oral bioavailability of the drug in humans is 60% (range, 50%–87%) and the terminal elimination half-life is not affected by dose, with modest inter-individual variations.1,2,4,5
The most common adverse effects of oxycodone are constipation, sleepiness, sweating, vomiting, pruritus, and illness accompanied by hot flashes.6 Although adverse effects of oxycodone are similar to those of morphine, it could be superior to morphine in that fewer opioid-induced hallucinations are related to oxycodone.7–9
Controlled-release (CR) morphine formulations have been a drug of choice in the management of chronic cancer related pain as compared to immediate-release (IR) morphine,10 because CR formulations can provide less fluctuation in plasma drug concentration and good patient compliance due to reduced dose frequency. In the case of hydromorphone HCl, a once-a-day extended-release tablet (Exalgo®; Mallinckrodt Pharmaceuticals, Hazelwood, MO, USA) has been also marketed using push–pull osmotic active technology. This type of product can reduce fluctuations in peak plasma concentration observed with general IR formulations and minimize break-through pain to maintain analgesia for long periods in patients with chronic pain.11 Literature also reports improvement in sleep quantity and decrease in pain interference ratings with extended-release tablets.12
Lately, a CR tablet of oxycodone has been marketed (Oxycontin® CR; Bard Pharmaceuticals Ltd, Cambridge, UK) and it has been introduced as a safe and effective drug that can be used in post-operative patients.13 It is necessary to administer the product every 12 hours to the patient, and thus, it should be administered at least twice a day.14 This supposes that there is an unmet need for the drug related to patient compliance, efficacy, and safety.
However, in the case of opioid analgesics, the government of South Korea needs to monitor the researcher and track the amount of drug used during the manufacturing process under strict regulation of narcotics to prevent abuse. This makes investigation on new dosage forms for opioid analgesics strained and not preferred. Therefore, only a few studies on development of new controlled dosage forms of opioids are reported.15,16
The aim of the present study was to design an oxycodone once-a-day CR tablet that fit the simulated release profiles. By using the direct compression method, which could minimize loss of drug during the process better than the wet granulation method, we could tightly control the amount of drug used. An in vitro release study was performed in the present research, and the effect of the application of physical barriers on release behavior was investigated. The pharmacokinetics of the drug were estimated in human volunteers and were compared to that of the commercial bis in die (bid [twice a day]) product to evaluate the suitability of the once-a-day CR tablet as an alternative that can provide reduced dose frequency and less fluctuation in plasma drug concentration. In addition, the fraction of drug dissolved in vitro versus the fraction of drug absorbed in vivo was plotted to investigate in vitro/in vivo correlation of CR tablets.
Materials and methods
Materials
The following materials were purchased from various companies and used as received: oxycodone hydrochloride (Macfarlan Smith, Edinburgh, Scotland); hydroxypropyl methylcellulose (HPMC; Metolose 90SH-100,000SR, 60SH-10,000SR, and 90SH-4,000SR; Shin-Etsu Chemical, Tokyo, Japan); hydroxypropyl cellulose (HPC; Klucel™-HF, Ashland, Covington, KY, USA); lactose monohydrate (FlowLac® 100; Molkerei MEGGLE Wasserburg GmbH & Co. KG, Wasserburg, Germany); microcrystalline cellulose (Vivapur 12®; JRS Pharma, Rosenberg, Germany); and fumed silica (Aerosil® R972; Evonik, Essen, Germany). All other chemicals used were of high-performance liquid chromatography (HPLC) or reagent grade.
Establishment of target in vitro release profiles
Plasma concentration profiles of oxycodone after single-dose or multiple-dose administration were simulated using Micromath Scientist® software (Micromath Research, St Louis, MO, USA) with the following Equations.
|
|

(Cp)t(multiple oral) =(Cp)t1+(Cp)t2+···+(Cp)tn+1 | (2) |
In Equation 1, F (%) is absolute bioavailability of oxycodone after oral administration; D1 is a single dose by oral administration; ka (hr [hours]−1) is the absorption rate constant of the drug after oral administration; Vd (mL) is the volume of distribution of the drug after oral administration; ke (hr−1) is elimination rate constant of the drug after oral administration; and Cp (ng/mL) is the plasma concentration of the drug at time t (hr). Pharmacokinetics parameters of commercial oxycodone CR tablets were obtained from the literature17 and were assumed as follows: t1/2 =5.64 hours, Vd =45,233.3 mL, and F =61.3%.
Considering the predicted Cmax (peak serum concentration) and AUC (area under the curve) of commercial oxycodone CR tablets (10 mg, bid), target pharmacokinetic profiles of the new oxycodone once-a-day CR tablets (20 mg quaque die [qd {once daily}]) were established. Then, absorbed fraction of the drug versus time was calculated using the Wagner–Nelson method:
F(t)=C(t)+ke AUCt | (3) |
|
|
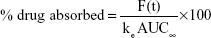
where F(t) is the amount absorbed, and ke is the elimination rate constant. Target in vitro release profiles were simulated assuming that the release rate of oxycodone was a rate-limiting step for the absorption of the drug.
Preparation of tablets
Compositions of the CR tablets are given in Table 1. All materials in the composition were passed through a sieve (number 30 mesh) before using to avoid any aggregates. Each formulation was compressed using a hydraulic laboratory press equipped with a flat-faced punch (diameter, 9.5 mm). The compression force was 10.0 MPa.
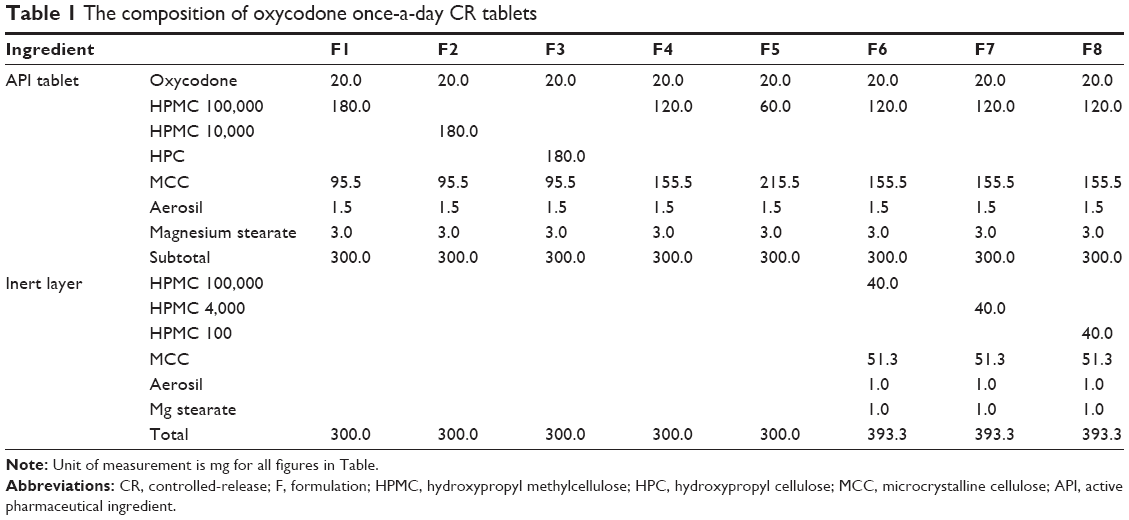 | Table 1 The composition of oxycodone once-a-day CR tablets |
Quantitative analysis of oxycodone using HPLC
Analysis of oxycodone was conducted using a HPLC system (Agilent 1100 Series; Agilent Technologies, Santa Clara, CA, USA) equipped with a C18 column (Bondapak®, 3.9×300 mm, 10 μm; Waters Corporation, Milford, MA, USA). The mobile phase was comprised of a mixture of aqueous buffer (0.05 M KH2PO4), MeOH, and tertiary-butyl ether in a volume ratio of 85:15:0.5, and its flow rate was 1.0 mL/minute. The HPLC method was fully validated before the analysis of samples.
In vitro release studies
In vitro drug release studies were conducted according to US Pharmacopeia Apparatus 2 (paddle method; model VK 7000 dissolution apparatus, Varian Inc, Palo Alto, CA, USA) with 900 mL of the dissolution medium (pH 6.8, 50 mM phosphate buffer) maintained at 37°C±0.5°C. Samples were withdrawn at predetermined time points and were analyzed using an HPLC system. The Higuchi model (Equation 5) and the zero-order model (Equation 6) were used to calculate release rates of the formulations.
Qt/Q∞ = kt1/2 + c | (5) |
Qt/Q∞ = kt + c | (6) |
where Q t is released amount of oxycodone at time t, Q∞ is released amount of oxycodone at infinite time, k is the release constant for the model, and c is an intercept.
Pharmacokinetic evaluations
Subjects
The whole in vivo study procedure was approved by the Ministry of Food and Drug Safety, Republic of Korea. Healthy male volunteers (n=18) were enrolled into the study. To qualify for entry, subjects had to provide written, informed consent. Only subjects free from significant abnormal findings were chosen based upon pre-study physical exam, laboratory testing, and medical history. Subjects with known medical conditions that might interfere with the interpretation of data and those with a history of hypersensitivity to opioids or a history of drug abuse were precluded from entering the study. Subjects who used opioids during the 3 months prior to entry or any medication within 7 days preceding or during the study were also excluded.
Study design
A single-dose, randomized, analytically blinded, two-way, crossover pharmacokinetic study was designed. The study protocol was approved by the Research Consultants’ Review Committee Institutional Review Board, Republic of Korea. Doses were administered at approximately 9:00 am, after an 8-hour overnight fast. Subjects continued fasting for an additional 4 hours after dosing. For the first period of the study, group 1 received one 20 mg CR tablet prepared in the present study. Group 2 received 10 mg CR tablets (Oxycontin® tablets, Bard Pharmaceuticals) bid. The second period of the study proceeded following crossover design after a washout period (7 days).
Sample preparation and analysis
Blood samples were collected and assayed for plasma oxycodone concentration. These samples were obtained just prior to ingestion of the study medication (0 hr) and at 1, 1.5, 2, 2.5, 3, 3.5, 4, 5, 6, 8, 10, 12, and 24 hours after dosing. Analysis for oxycodone in plasma was conducted using a validated liquid chromatography/mass spectrometry procedure, as previously described but with the following modifications. Oxycodone-d6 was used as the internal standard. Samples (3 μL each) were injected into a Prominence UFLCXR HPLC system (Shimadzu, Kyoto, Japan) with an API 4000 mass spectrometer. Two channels in positive ion multiple reaction monitoring mode were used to detect oxycodone and internal standard (IS). The most abundant product ions of the compounds were at m/z =241.20 from the precursor ion m/z 316.10 of oxycodone and at m/z =247.20 from the m/z =322.20 of IS. The analytical column used was a Luna® HILIC 200A (100×2.0 mm, 3 μm; Phenomenex, Torrance, CA, USA), and the mobile phase contained a mixture of aqueous buffer (10 mM ammonium acetate), acetonitrile, and formic acid in a volume ratio of 10:90:0.2, and its flow rate was 0.25 mL/min. The temperature of the auto-sampler and column oven was maintained at 10°C and 40°C, respectively. The analytical method was fully validated in the range of 0.1–100 ng/mL (with an r2>0.9900 value for linearity). The pharmacokinetic parameters were acquired with non-compartmental method by using Phoenix™ WinNonlin® (Pharsight Corp, Sunnyvale, CA, USA), and log-transformed AUC24 and Cmax values were averaged for each treatment group. The point estimator was obtained for the difference between averages, and their 90% confidence interval at a 0.05 significance level was calculated.
Statistical analysis
All statistical analyses were performed using the Student’s t-test with Minitab™ software (release 13.32, Minitab Inc, State College, PA, USA). Values of P<0.05 were considered statistically significant.
Results and discussion
Pharmacokinetic modeling for oxycodone once-a-day CR tablets
Simulated pharmacokinetic profiles of oxycodone 10 mg bid and 20 mg qd after oral administration are shown in Figure 1A. Pharmacokinetic parameters calculated from simulated plasma drug concentration versus time curves are summarized in Table 2. Release profiles of various ka derived from the absorption fraction of plasma drug concentration curves are displayed in Figure 1B. In the case of the 20 mg qd dose, the simulation showed that a lower ka value has a reducing effect on both AUC and Cmax values. Similar AUC and Cmax values to those of the 10 mg bid dose could be obtained with a kavalue of 0.13 hr−1.
 | Figure 1 (A) Simulated plasma oxycodone concentration versus time curves after oral administration. (B) Computed release profiles with various ka values for oxycodone once-a-day CR tablets. |
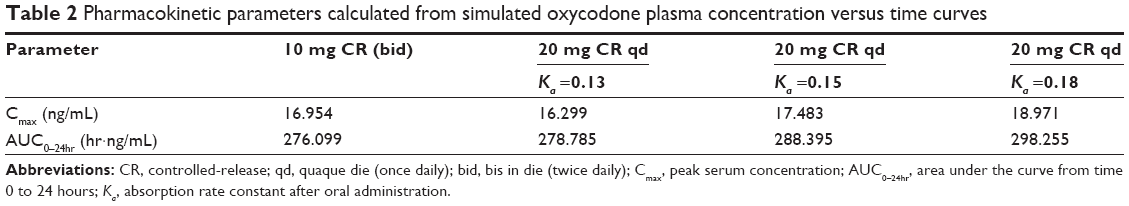 | Table 2 Pharmacokinetic parameters calculated from simulated oxycodone plasma concentration versus time curves |
Cmax and AUC values were considered as key factors to determine the release profile of once-a-day CR tablets, because the bioequivalence of the two different treatments is judged on the basis of equivalence in both Cmax and AUC values.18 Considering that drug absorption in the colon would be less than that in the intestine, because of lack of water,19 calculated pharmacokinetic profiles could not be achieved after gastric transit of the tablet from the intestine to the colon. Therefore, a ka value of 0.13 hr−1 was considered as the lower limit of the absorption rate.
According to the drug label information submitted to the US Food and Drug Administration (FDA) by the manufacturer,14 the drug showed higher oral bioavailability (60%–87%) compared to other oral opioids because of lower pre-systemic and/or first-pass metabolism. Oxycodone possesses dose-proportional pharmacokinetic profiles in the range of 5–30 mg. It was believed that the drug was consistently absorbed through the entire gastrointestinal tract, because CR forms of the drug did not have any decline in bioavailability. Oxycodone CR tablets had similar AUC to IR tablets with same dose.20 It was believed that equivalent AUC was not an issue, with ka values ranging between 0.13 and 0.18, and that change in in vitro release rate would not result in significant reduction in bioavailability of oxycodone.21 In addition, it was already reported that oxycodone CR tablets showed good in vivo–in vivo correlation (r2=0.9957).17
Otherwise, it should be noted that a Cmax value of 20 mg qd may exceed that of 10 mg bid easily. When ka value was increased from 0.13 hr−1 to 0.18 hr−1, only 7% increase in AUC was observed, but a 16% increase was observed for Cmax (Table 2). This increase may interrupt establishment of bioequivalence of the two treatments, and it was supposed that the release profile of 20 mg once-a-day CR should be carefully monitored for Cmax value, similar to that of 10 mg bid. Fast release in the initial phase of the release study could theoretically lead to faster absorption to the systemic circulation and higher Cmax value. Therefore, initial burst release of once-a-day CR was carefully monitored throughout the present study.
In the present study, new once-a-day CR tablets were designed considering simulated plasma concentration profiles under the assumption that in vitro release rates of the drug from the tablet corresponded to in vivo absorption rate. The once-a-day CR tablets were designed to have the release profiles within these two lines (ka=0.13 hr−1 to 0.18 hr−1), as displayed in Figure 1B.21
Release of oxycodone CR tablets using HPMC as a release modifier
The cellulose-derived polymers (HPMC 100,000 mPa·s, HPMC 10,000 cP, or HPC) were employed as release modifiers of oxycodone CR tablets as shown in Table 1. Release profiles of once-a-day CR tablets containing cellulose-derived polymers are displayed in Figure 2A–C.
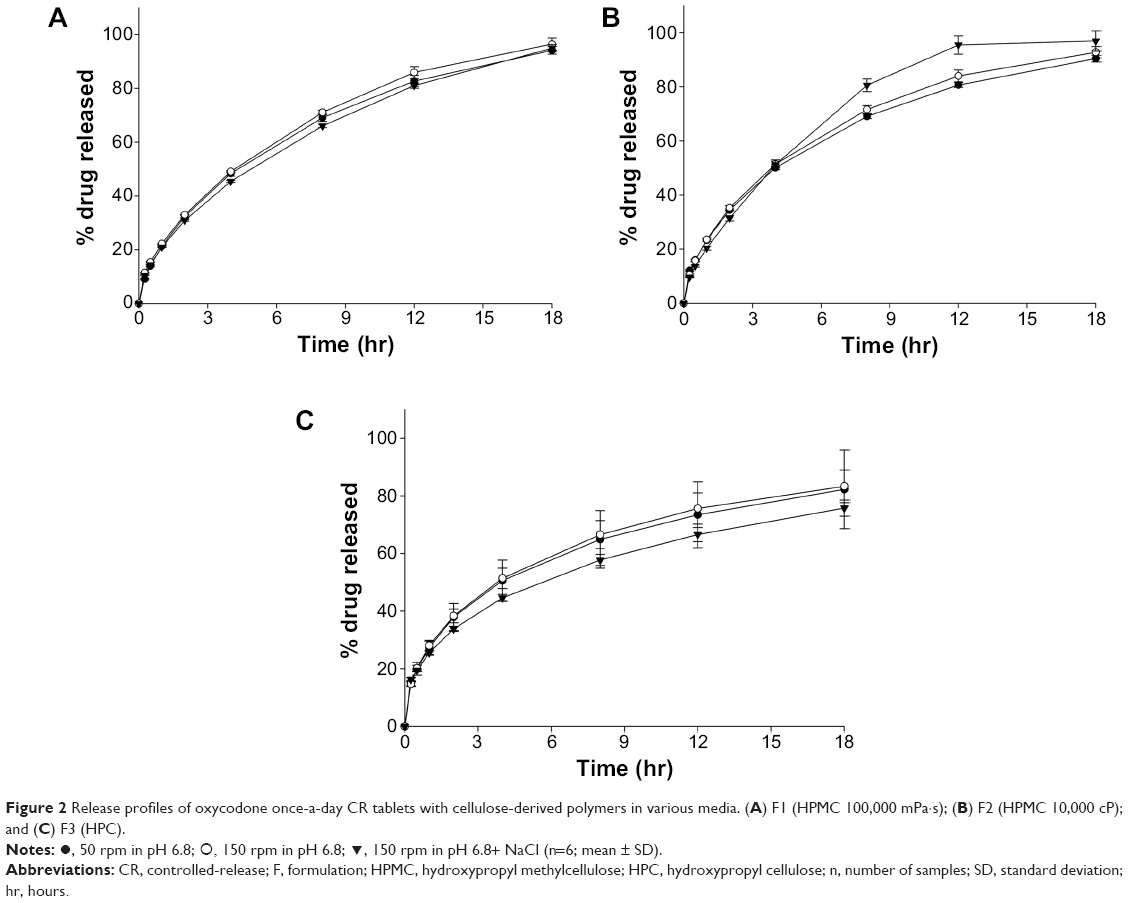 | Figure 2 Release profiles of oxycodone once-a-day CR tablets with cellulose-derived polymers in various media. (A) F1 (HPMC 100,000 mPa·s); (B) F2 (HPMC 10,000 cP); and (C) F3 (HPC). |
In a pH 6.8 medium, release profiles of formulations (hereafter known as F with a numerical identifier) F1 and F2 were very similar when same amount of the polymer was used. At 18 hours after introduction into the medium, 96.5% and 92.8% of the drug was released from F1 and F2, respectively. F3 with HPC released smaller amount of the drug, 83.3%, at the same time point.
HPMC and HPC are water-swellable polymers and form a viscous gel in contact with water. After gel formation, movement of water and drug molecules through the gel layer is partially restricted, and release rate of the drug is thereby decreased. In general, gel formation around the tablet takes time, and so the gel cannot prevent diffusion of soluble drug (eg, oxycodone) molecules into the dissolution medium in the early phase of a release study.16,20 It has also been reported that addition of HPC to HPMC matrix resulted in decreases in release rates from the matrix due to the formation of a stronger gel layer, which reduced diffusion and erosion rate.22,24 Therefore, in the present study, F3 showed a slightly faster release rate in the early phase (<4 hr) of the release study than F1 and F2. After 4 hours, the F3 release rate slowed down more rapidly than that of F1 and F2, and 83.3% of the drug was released from F3 at 18 hours. Considering the release behavior of F3, there were doubts about incomplete drug release from the HPC matrix.
Effects of different conditions of dissolution medium on release behavior of the tablet were also investigated, as shown in Figure 2A–C. Considering CR behavior of CR tablets over 18 hours, the drug should be released from the tablet matrix, as designed, throughout the gastrointestinal tract, which has various physical conditions including pH, ionic strength, and mobility. It is important for once-a-day CR tablets to preserve their designed release behavior against changes in gastrointestinal environment. Therefore, ionic strength and paddle speed were controlled in the present study, because these factors vary along the gastrointestinal tract and are affected by food intake.
Ionic strength of the gastrointestinal tract under various physiological conditions ranged from 0 M to 0.4 M; there can be a variation in values after food intake, dependent on the composition of the food.25,26 It has been reported that erosion rate decreased when the ionic strength increased in the dissolution medium because of salting out of the polymer. As the ionic strength of the medium increased, ions in the medium took water molecules from the swollen polymer chain due to high water affinity, which led to decrease in release and erosion rate of the polymer matrix.27,28 Among the polymers, it was HPMC 100,000 mPa·s that had better resistance than HPMC 10,000 mPa·s or HPC against changes in ionic strength. In the present study, there was no significant difference in released amount of drug at 8, 12, and 18 hours from F1, whether NaCl was added to the pH 6.8 medium or not. However, the release rate of F2 was increased by the addition of NaCl. On the other hand, addition of NaCl resulted in retardation of drug release in F3.
Release profiles of F1, F2, and F3 were not significantly influenced by rpm speed in the current in vitro release study. In general, the erosion rate of the tablet matrix was accelerated by increase in paddle speed (rpm) when the matrix formation was not rigid enough.28,29 It was believed that viscosity grade and amount of polymers were sufficient to stand harsher conditions of release (150 rpm) in the cases of F1, F2, and F3.
HPMC and HPC are non-ionic polymers, and thus, release of the drug from matrix made of these polymers is not affected by the pH of the dissolution medium. However, release rate could be influenced by pH if the drug had pH-dependent solubility.30 In the case of oxycodone, the drug is soluble in a broad pH range;31 there was little effect of pH on the medium or on release behavior. In the range of pH 1.2–6.8, pH value of the dissolution medium did not show any significant effect on release behavior of F1 (data not shown).
Considering the results of our current release studies, it was found that HPMC 100,000 mPa·s was most insusceptible to conditions of release study. Therefore HPMC 100,000 mPa·s was considered a better release modifier than the other polymers and chosen for further studies.
The effect of amount of HPMC 100,000 mPa·s on release rate is displayed in Figure 3. Release rate decreased with increase in HPMC amount, which was in good accordance with reported results.32,33 In addition, F1 and F4 seemed to reach the target profile range. However, release amount of these formulations (F1, F4, and F5) in 2 hours was beyond the range of the target profile, as shown in the inset of Figure 3. At 4 hours, released amount of F1 was lower than target release profile, with ka =0.18, but released amounts of F4 and F5 remained larger. HPMC could retard the release of the drug from the matrix by forming a viscous gel, and it took time to build around the matrix. Because fast initial release of the drug can cause higher Cmax, which leads to nonequivalence of the dosage forms, release rate of the initial phase should be controlled so as to reach the target range. It was obvious that release rate of the drug in an initial phase could be decreased by incorporating a larger amount of HPMC than of F1. However, this addition of HPMC can accompany a lower release rate of the drug in a late phase, because the release of the soluble drug depends on diffusion of the drug molecules, which is apparently interrupted by the strong and thick gel produced by larger amount of the polymer. It was believed that increase in polymer amount was not an appropriate way to lower burst release in an initial phase.
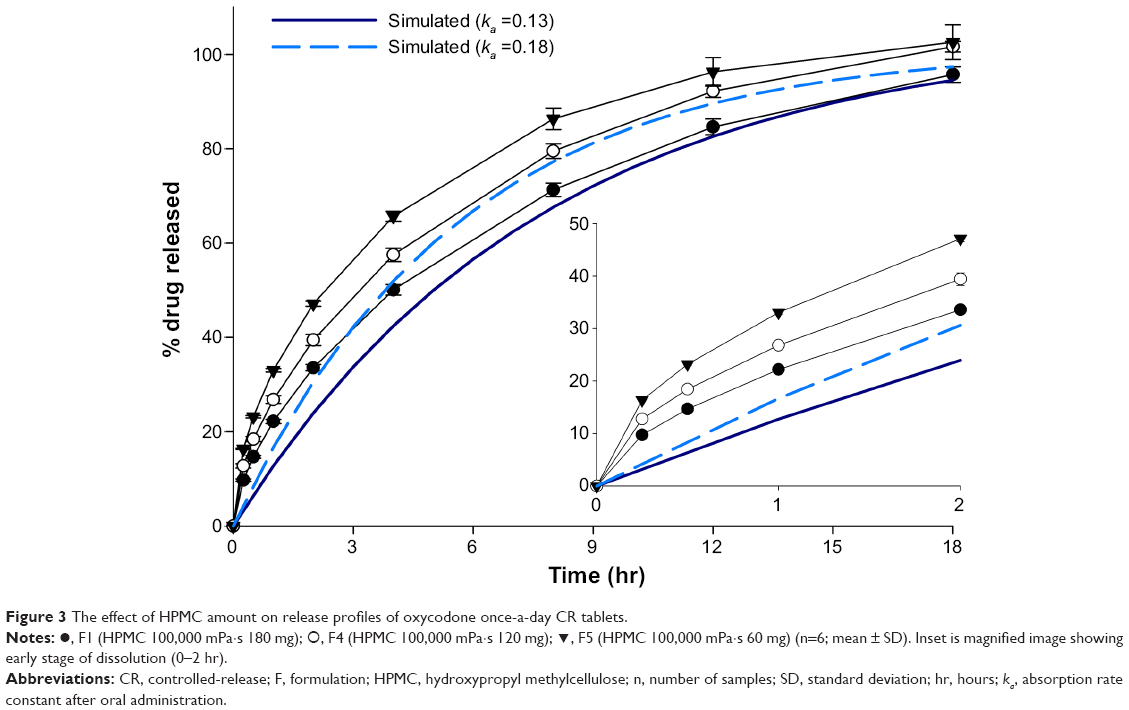 | Figure 3 The effect of HPMC amount on release profiles of oxycodone once-a-day CR tablets. |
Release of oxycodone CR bi-layer tablets with inert layer
An inert layer was applied to the once-a-day CR tablet, which could limit the dimensions of the tablet surface for drug release.34,35 Effect of the viscosity grade of HPMC in the inert layer on release rate is shown in Figure 4. Release rate of the drug was decreased when HPMC with higher viscosity grade was incorporated in the inert layer.
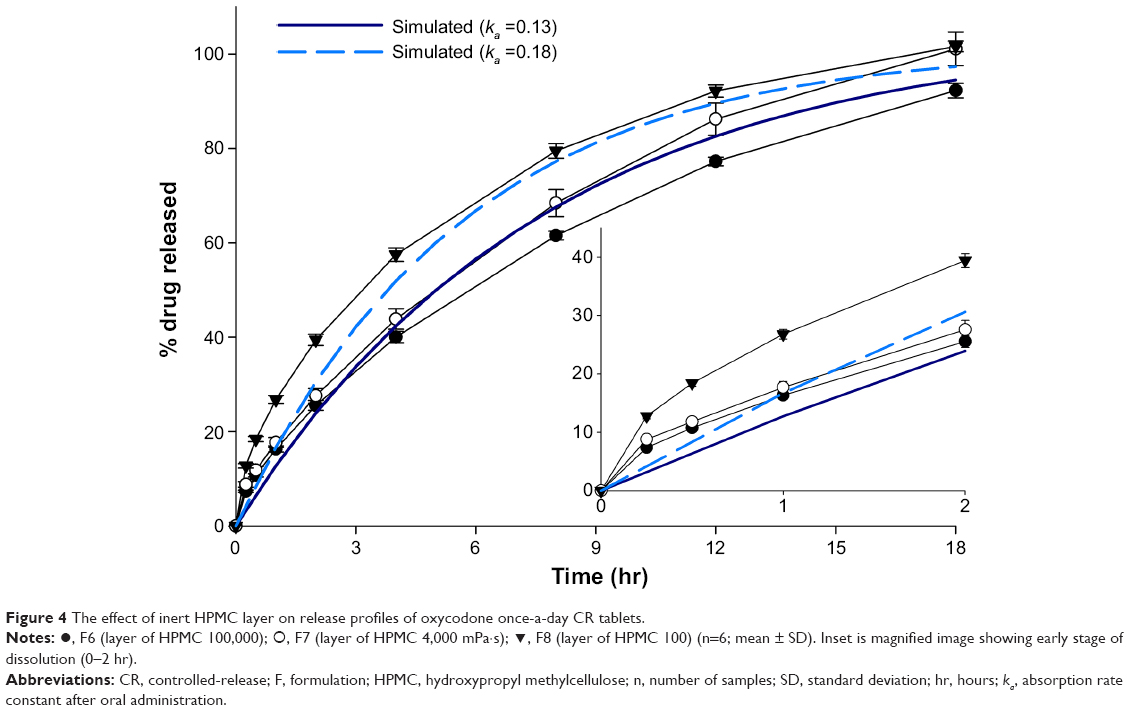 | Figure 4 The effect of inert HPMC layer on release profiles of oxycodone once-a-day CR tablets. |
Although release profiles of F6, F7, and F8 were not in the target profile range at 0.5 hours, it was obvious that application of a physical layer of HPMC 100,000 mPa·s and HPMC 4,000 mPa·s could effectively reduce the release rate in an initial phase of the release study (Figure 4 inset). Release amount of the drug from the CR tablets with inert layer of HPMC 100,000 mPa·s and HPMC 4,000 mPa·s approximately met the target profile range after 1 hour. This indicated that limiting surface area on the drug release front could be a better option than increasing the amount of the release modifier, which would better control the release rate of soluble drugs such as oxycodone.
As shown in Figure 4, released drug amount of F6 was lower than target profile range after 3 hours. In contrast, release profile of F7 placed it in the target profile range after 2 hours. Although release amount of the F7 drug was larger than target profile range at 15 hours, it was believed that release profile between 15 and 18 hours could not have significant effect on absorption, because approximately 90% of the drug was already released at 15 hours.
During the in vitro release study, oxycodone once-a-day CR tablets (F7) were withdrawn at predetermined time points (4, 12, and 18 hr) and visually observed, as displayed in Figure 5. The white-colored layer in the figure is an inert layer containing HPMC, and the pink-colored layer contains oxycodone. At 4 hours, both layers expanded in all directions due to water swelling. Establishment of the viscous gel in the matrix was observed, and it was believed that the HPMC inert layer worked as a physical barrier to restrict drug release. At 12 hours, vertical expansion of the tablet was more pronounced, and the HPMC inert layer (white color) became thicker. However, the upper side (row 2, Figure 5) of the CR tablet showed that the HPMC inert layer underwent obvious erosion. At this point, 86% of drug was released from the CR tablet already (Figure 3), and elimination of the physical barrier could be desirable to avoid incomplete release of the drug from the swollen matrix. At 18 hours, the HPMC inert layer was almost eroded, and drug release from the CR tablet was finished.
 | Figure 5 Representative images of oxycodone once-a-day CR tablets withdrawn at 4, 12, and 18 hr during in vitro release study. |
Release kinetic models of oxycodone CR bi-layer tablets
The in vitro release profiles of the tablets were fit to zero-order and Higuchi models. The kinetic parameters including the correlation coefficient (r2) and release rate constant (k) for the models are given in Table 3.
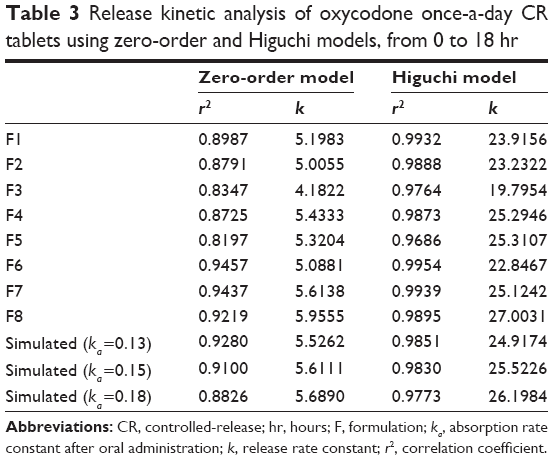 | Table 3 Release kinetic analysis of oxycodone once-a-day CR tablets using zero-order and Higuchi models, from 0 to 18 hr |
The Higuchi model was found to provide higher value of r2 (0.9686–0.9954) than the zero-order model (0.8197–0.9457) for all formulations (F1–F8). High values of r2 yielded by the Higuchi model indicated that the release behavior of the CR tablets containing oxycodone could be elucidated using the diffusion phenomena through the matrix, due to hydrophilicity of the drug. Simulated target profiles also featured high values of r2 (0.9773–0.9851), and the release rate constant ranged between 24.9174 and 16.1984 hr−1/2 for the Higuchi model. F1, F4, F5, F6, F7, and F8 had similar release rate constants to the simulated target profile and were considered as candidates.
The target profile showed high correlation coefficient values not only for the Higuchi model but also for the zero-order model, as shown in Table 3. Tablets without a physical barrier (F1–F5) showed relatively low values of r2, which ranged between 0.8197 and 0.8987 when analyzed using the zero-order model. The results were caused by burst release, which was observed in in vitro release profiles (Figures 2 and 3). On the other hand, suppressed burst release caused by the physical barrier led to higher correlation coefficients for F6, F7, and F8 using the zero-order model.
The effect of a physical barrier became more obvious when release behavior in the initial phase (0 hr–2 hr) was analyzed using kinetic models (Table 4). Simulated release profiles had higher r2 values with the zero-order model than with the Higuchi model for the initial 2 hours of release, but all formulations (F1–F8) showed higher r2 values with the Higuchi model. However, F6, F7, and F8 showed high r2 values with the zero-order model as well as the Higuchi model, which pre-supposed that the release behavior of these formulations was more similar to simulated release profiles than to the other formulations. In addition, F6, F7, and F8 also showed release rate constants similar to simulated release profiles when examined using both the zero-order model and the Higuchi model. The release rate constant of tablets without a physical barrier was much higher (23.8045–33.3079 hr−1/2), and this higher value indicated a burst release of tablets without a physical barrier for an initial period. Therefore, burst release could be suppressed by applying a physical barrier.
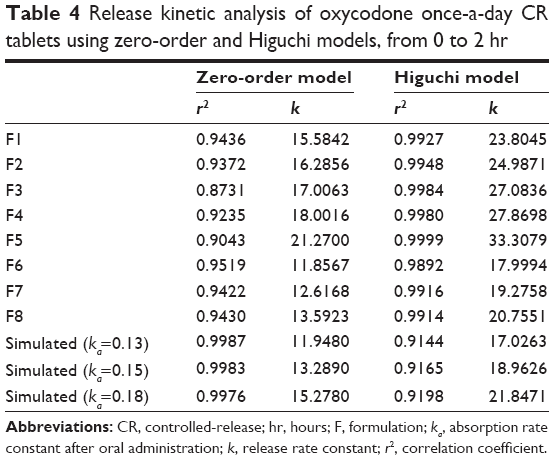 | Table 4 Release kinetic analysis of oxycodone once-a-day CR tablets using zero-order and Higuchi models, from 0 to 2 hr |
As a result, the release rate of oxycodone could be controlled and could be manipulated into the target range by applying a physical barrier. Considering release behavior both for the full 18 hours and the initial 2 hours, F7 was chosen for the pharmacokinetic study, with minor modification for mass production.
Pharmacokinetic study and in vitro–in vivo correlation
The pharmacokinetics of oxycodone once-a-day CR tablets was investigated in human volunteers and was compared to that of the commercial product (Oxycontin®, bid). Observed abnormal responses were minor, and subjects recovered without any after-effects.
The plasma concentration versus time profile of the drug after oral administration of oxycodone once-a-day CR tablets and the commercial product are shown in Figure 6. Pharmacokinetic parameters including AUC and Cmax were summarized in Table 5.
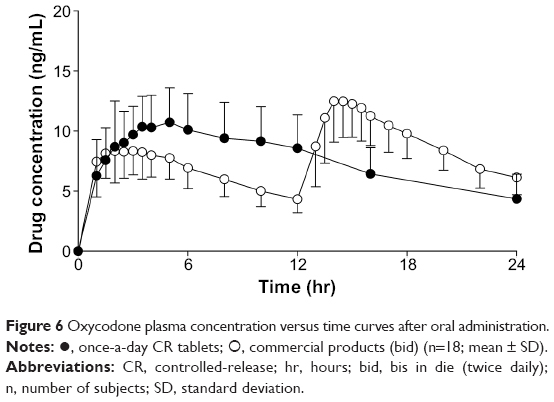 | Figure 6 Oxycodone plasma concentration versus time curves after oral administration. |
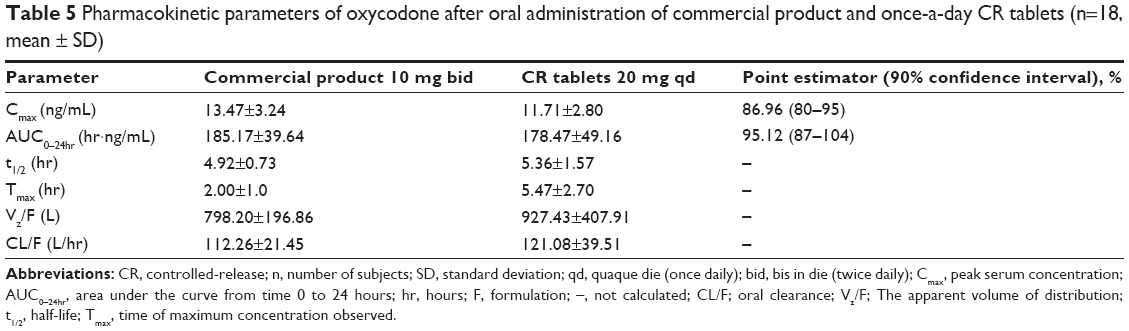 | Table 5 Pharmacokinetic parameters of oxycodone after oral administration of commercial product and once-a-day CR tablets (n=18, mean ± SD) |
Cmax is 13.47±3.24 ng/mL for 10 mg commercial product bid and 11.71±2.80 ng/mL for 20 mg once-a-day CR tablets, respectively. AUC0–24h is 185.17±39.64 ng·hr/mL for 10 mg commercial product bid and 178.47±49.16 ng·hr/mL (fasted condition) for 20 mg once-a-day CR tablets, respectively.
As shown in Table 5, 90% confidence interval of the ratio of the means for Cmax and AUC24 was 80–95 and 87–104, respectively. Because 90% confidence interval of the ratio of the means within 80–125 indicates bioequivalence between the two different treatments, it was concluded that 10 mg commercial product bid and once-a-day CR tablets qd were bioequivalent.16
The relation between in vitro release fraction and in vivo absorption fraction was fitted in Figure 7. The value of r2 was 1.000 and indicated good correlation between two variables, as previously reported.14 This correlation indicated that the absorption of the drug into systemic circulation took place immediately after release of the drug from the CR tablets, and this release continued for the entire time frame.
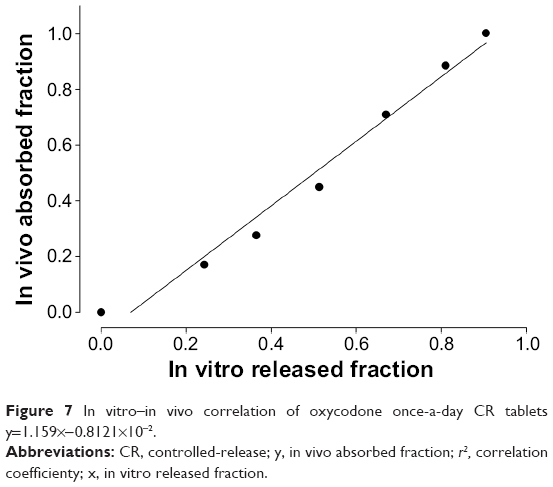 | Figure 7 In vitro–in vivo correlation of oxycodone once-a-day CR tablets y=1.159×−0.8121×10⁻². |
When the results of the pharmacokinetic study were compared to simulated values, it was apparent that both AUC and Cmax values were lower than simulated values in the cases of both the once-a-day CR tablets and the commercial product (Tables 2 and 5). It was noteworthy that the AUC for both treatments and the Cmax of once-a-day CR tablets corresponded to 62%–67% of simulated values. This indicated that drug absorption was lower than expected because of variables including difference in individual physical conditions of volunteers in the present study, regardless of the treatments. However, Cmax of the commercial product reached 79% of simulation, and magnitude of decrease in Cmax value of commercial product was smaller than other parameters. This could threaten establishment of bioequivalence between the two different treatments, and it was clear that the release profile of once-a-day CR tablets should be cautiously designed in terms of Cmax value. The 90% confidence interval of the point estimator for Cmax was 80%–95% and reached lower limitation. Therefore, it could be allowed that increase in ka value could cause the increase in Cmax value for once-a-day CR tablets.
Conclusion
The present study demonstrates that once-a-day CR tablets containing oxycodone can be designed as per simulated profiles, and that they work in vivo as designed. Application of a physical barrier was an appropriate strategy to suppress the burst release of CR tablets, and it was believed that this strategy promoted the establishment of bioequivalence between the once-a-day CR tablet and the commercial product (bid). Correlation between the fraction of in vitro oxycodone release rate and that of the in vivo absorption rate was well established, and it was apparent that absorption of the drug could be controlled by modification of in vitro release rates of the dosage form, without any decline in bioavailability. The findings of the present study indicated the potential of oxycodone once-a-day CR in terms of patient compliance and could help researchers to develop new CR dosage forms of oxycodone.
Acknowledgments
This study was supported by a grant from the Korean Health Technology R&D Project, Ministry for Health, Welfare & Family Affairs, Republic of Korea (grant number A092018).
Disclosure
The authors report no conflicts of interest in this work.
References
Glare PA, Walsh TD. Dose-ranging study of oxycodone for chronic pain in advanced cancer. J Clin Oncol. 1993;11(5):973–978. | ||
Kalso E, Vainio A. Morphine and oxycodone hydrochloride in the management of cancer pain. Clin Pharmacol Ther. 1990;47(5):639–646. | ||
Kalso E, Pöyhiä R, Onnela P, Linko K, Tigerstedt I, Tammisto T. Intravenous morphine and oxycodone for pain after abdominal surgery. Acta Anaesthesiol Scand. 1991;35(7):642–646. | ||
Pöyhiä R, Vainio A, Kalso E. A review of oxycodone’s clinical pharmacokinetics and pharmacodynamics. J Pain Symptom Manage. 1993;8(2):63–67. | ||
Leow KP, Smith MT, Williams B, Cramond T. Single-dose and steady-state pharmacokinetics and pharmacodynamics of oxycodone in patients with cancer. Clin Pharmacol Ther. 1992;52(5):487–495. | ||
Leow KP, Cramond T, Smith MT. Pharmacokinetics and pharmacodynamics of oxycodone when given intravenously and rectally to adult patients with cancer pain. Anesth Analg. 1995;80(2):296–302. | ||
Bruera E, Belzile M, Pituskin E, et al. Randomized, double-blind, cross-over trial comparing safety and efficacy of oral controlled-release oxycodone with controlled-release morphine in patients with cancer pain. J Clin Oncol. 1998;16(10):3222–3229. | ||
Heiskanen T, Kalso E. Controlled-release oxycodone and morphine in cancer related pain. Pain. 1997;73(1):37–45. | ||
Curtis G, Johnson G, Clark P, et al. Relative potency of controlled-release oxycodone and controlled-release morphine in a postoperative pain model. Eur J Clin Pharmacol. 1999;55(6):425–429. | ||
Hanks G, Twycross R, Bliss J. Controlled release morphine tablets: a double–blind trial in patients with advanced cancer. Anaesthesia. 1987;42(8):840–844. | ||
Drover DR, Angst MS, Valle M, et al. Input characteristics and bioavailability after administration of immediate and a new extended-release formulation of hydromorphone in healthy volunteers. Anesthesiology. 2002;97(4):827–836. | ||
Coluzzi F, Mattia C. OROS® hydromorphone in chronic pain management: when drug delivery technology matches clinical needs. Minerva Anestesiol. 2010;76(12):1072–1084. | ||
Sunshine A, Olson NZ, Colon A, et al. Analgesic efficacy of controlled–release oxycodone in postoperative pain. J Clin Pharmacol. 1996;36(7):595–603. | ||
US Food and Drug Administration [webpage on Internet]. OxyContin CII. Revised April 2014. Available from: http://www.accessdata.fda.gov/drugsatfda_docs/label/2014/022272s022lbl.pdf. Accessed January 8, 2015. | ||
Ministry of Food and Drug Safety, Republic of Korea [webpage on the Internet]. Act on the control of narcotics. Available from: http://elaw.klri.re.kr/kor_service/lawView.do?hseq=27517&lang=ENG. Accessed January 8, 2015. | ||
Ministry of Food and Drug Safety, Republic of Korea [webpage on the Internet]. Enforcement decree of the act on the control of narcotics. Available from: http://elaw.klri.re.kr/kor_service/lawView.do?hseq=27521&lang=ENG. Accessed January 8, 2015. | ||
Mehta AM, Shah MS, inventors; Mehta AM, Shah MS, assignees. Extended release formulations of opioids and method of use thereof: United States patent US 20050074493 A1; 2004 Sep 28. | ||
Food and Drug Administration. Guidance for industry: statistical approaches to establishing bioequivalence. Rockville, MD: Center for Drug Evaluation and Research; 2001. Available from: http://www.fda.gov/downloads/Drugs/Guidances/ucm070244.pdf. Accessed January 8, 2015. | ||
Choi DH, Kim KH, Park JS, Jeong SH, Park K. Evaluation of drug delivery profiles in geometric three-layered tablets with various mechanical properties, in vitro– in vivo drug release, and Raman imaging. J Control Release. 2013;172(3):763–772. | ||
Mandena JW, Kaiko RF, Oshlack B, Reder RF, Stanski DR. Characterization and validation of a pharmacokinetic model for controlled-release oxycodone. Br J Clin Pharmacol. 1996;42(6):747–756. | ||
Fujisaki Y, Tsukune T, Funyû M, Okumura M, Ukigaya T, Sugibayashi K. Development of sustained-release tablets containing sodium valproate: in vitro and in vivo correlation. Drug Dev Ind Pharm. 2006;32(2):207–217. | ||
Ebube NK, Jones AB. Sustained release of acetaminophen from a heterogeneous mixture of two hydrophilic non-ionic cellulose ether polymers. Int J Pharm. 2004;272(1):19–27. | ||
Mccrystal CB, Ford JL, Rajabi-Siahboomi AR. Water Distribution Studies within Cellulose Ethers Using Differential Scanning Calorimetry. 2. Effect of Polymer Substitution Type and Drug Addition. J Phar Sci. 1999;88(8):797–801. | ||
Vueba M, Batista de Carvalho L, Veiga F, Sousa J, Pina M. Influence of cellulose ether mixtures on ibuprofen release: MC25, HPC and HPMC K100M. Pharm Dev Technol. 2006;11(2):213–228. | ||
Johnson J, Holinej J, Williams M. Influence of ionic strength on matrix integrity and drug release from hydroxypropyl cellulose compacts. Int J Pharm. 1993;90(2):151–159. | ||
Lindahl A, Ungell A-L, Knutson L, Lennernäs H. Characterization of fluids from the stomach and proximal jejunum in men and women. Pharm Res. 1997;14(4):497–502. | ||
Alderman D. A review of cellulose ethers in hydrophilic matrices for oral controlled-release dosage forms. Int J Pharm Tech Prod Mfr. 1984;5(3):1–9. | ||
Kavanagh N, Corrigan OI. Swelling and erosion properties of hydroxypropylmethylcellulose (Hypromellose) matrices–influence of agitation rate and dissolution medium composition. Int J Pharm. 2004;279(1–2):141–152. | ||
Kamba M, Seta Y, Takeda N, et al. Measurement of agitation force in dissolution test and mechanical destructive force in disintegration test. Int J Pharm. 2003;250(1):99–109. | ||
Asare-Addo K, Levina M, Rajabi-Siahboomi AR, Nokhodchi A. Effect of ionic strength and pH of dissolution media on theophylline release from hypromellose matrix tablets – Apparatus USP III, simulated fasted and fed conditions. Carbohydr Polym. 2011;86(1):85–93. | ||
Kasim NA, Whitehouse M, Ramachandran C, et al. Molecular properties of WHO essential drugs and provisional biopharmaceutical classification. Mol Pharm. 2004;1(1):85–96. | ||
Siepmann J, Kranz H, Bodmeier R, Peppas N. HPMC-matrices for controlled drug delivery: a new model combining diffusion, swelling, and dissolution mechanisms and predicting the release kinetics. Pharm Res. 1999;16(11):1748–1756. | ||
Wan L, Heng P, Wong L. The effect of hydroxypropylmethylcellulose on water penetration into a matrix system. Int J Pharm. 1991;73(2):111–116. | ||
Conte U, Maggi L. Modulation of the dissolution profiles from Geomatrix multi-layer matrix tablets containing drugs of different solubility. Biomaterials. 1996;17(9):889–896. | ||
Abdul S, Poddar S. A flexible technology for modified release of drugs: multi layered tablets. J Control Release. 2004;97(3):393–405. |
 © 2015 The Author(s). This work is published and licensed by Dove Medical Press Limited. The
full terms of this license are available at https://www.dovepress.com/terms
and incorporate the Creative Commons Attribution
- Non Commercial (unported, 3.0) License.
By accessing the work you hereby accept the Terms. Non-commercial uses of the work are permitted
without any further permission from Dove Medical Press Limited, provided the work is properly
attributed. For permission for commercial use of this work, please see paragraphs 4.2 and 5 of our Terms.
© 2015 The Author(s). This work is published and licensed by Dove Medical Press Limited. The
full terms of this license are available at https://www.dovepress.com/terms
and incorporate the Creative Commons Attribution
- Non Commercial (unported, 3.0) License.
By accessing the work you hereby accept the Terms. Non-commercial uses of the work are permitted
without any further permission from Dove Medical Press Limited, provided the work is properly
attributed. For permission for commercial use of this work, please see paragraphs 4.2 and 5 of our Terms.