
Back to Journals » Drug Design, Development and Therapy » Volume 19
Decoding Drug Interactions: Character and Degree of Pharmacokinetic Interactions Between Telmisartan and Sorafenib or Donafenib in Rats
Authors Li Y, Du W, Shan C, Yu Z, An J, Dong Z
Received 8 March 2025
Accepted for publication 9 July 2025
Published 15 July 2025 Volume 2025:19 Pages 6047—6060
DOI https://doi.org/10.2147/DDDT.S524048
Checked for plagiarism Yes
Review by Single anonymous peer review
Peer reviewer comments 3
Editor who approved publication: Prof. Dr. Georgios Panos
Ying Li,1,2,* Wenyu Du,1– 3,* Chunhui Shan,4 Zefang Yu,1 Jing An,1,2 Zhanjun Dong1,2
1Department of Pharmacy, Hebei General Hospital, Shijiazhuang, Hebei, People’s Republic of China; 2Hebei Key Laboratory of Clinical Pharmacy, Shijiazhuang, Hebei, People’s Republic of China; 3Graduate School of Hebei Medical University, Shijiazhuang, Hebei, People’s Republic of China; 4Department of Medical Imaging, Hebei General Hospital, Shijiazhuang, Hebei, People’s Republic of China
*These authors contributed equally to this work
Correspondence: Zhanjun Dong, Email [email protected]
Background: Sorafenib and lenvatinib play a significant role as small molecule targeted drugs in the treatment of advanced hepatocellular carcinoma. However, both drugs are most commonly associated with hypertension as a side effect, frequently needing antihypertensive treatment. Telmisartan, an antagonist of angiotensin II receptor, can attenuate sorafenib- or donafenib-induced hypertension. In clinical settings, sorafenib or donafenib is often prescribed alongside telmisartan, but the pharmacokinetic interactions between donafenib and telmisartan, as well as sorafenib and telmisartan, are not well understood. Therefore, this study aimed to evaluate these pharmacokinetic interactions in male Sprague-Dawley (SD) rats.
Methods: The animals were divided into seven groups (n = 6) and treated with sorafenib, donafenib, or telmisartan as monotherapy (groups I–III), multi-dose sorafenib or donafenib with single dose telmisartan (groups IV and V), or multi-dose telmisartan with single dose sorafenib or donafenib (groups VI and VII). The levels of drugs in rat plasma were quantified using ultra-performance liquid chromatography–tandem mass spectrometry (UPLC-MS/MS).
Results: Multiple doses of donafenib resulted in a 0.97-fold (P=0.010) increase in the area under the plasma concentration–time curve (AUC) of telmisartan and a 57.3% (P=0.038) and 45.6% (P=0.032) decrease in the apparent clearance (CLz/F) and the apparent volume of distribution (Vz/F) of telmisartan, respectively. Telmisartan resulted in a decrease in donafenib exposure; however, this effect was not statistically significant. The pharmacokinetic characteristics of sorafenib were significantly altered when it was co-administered with telmisartan. In particular, the AUC value and the maximum plasma concentration (Cmax) increased by 77.7% (P< 0.001) and 60.9% (P< 0.001), respectively, whereas Vz/F (50.4%, P=0.008) and CLz/F (46.0%, P=0.006) were significantly decreased. However, sorafenib did not affect the pharmacokinetic characteristics of telmisartan.
Conclusion: The results demonstrated potential interactions between telmisartan and sorafenib or donafenib, which may guide dosage adjustment and prevent toxic effects in individual patients.
Keywords: hepatocellular carcinoma, hypertension, donafenib, telmisartan, sorafenib, pharmacokinetics, drug–drug interactions
Introduction
Cancer ranks as the second most common cause of death worldwide and significantly impacts human health.1 Tyrosine kinase inhibitors (TKIs) have demonstrated considerable efficacy in treating various solid tumors, such as advanced renal cell carcinoma and hepatocellular carcinoma.2 Although TKIs are effective, certain adverse reactions of these drugs may necessitate dose adjustments or discontinuation if not appropriately addressed.3,4 Hypertension is a common cardiovascular side effect of TKIs and has been related to unfavorable outcomes in cancer therapy.5,6 Prompt management of hypertension during treatment with TKIs may allow patients to maintain the dosage of the drug and gain the maximum benefit from it. Angiotensin receptor blockers (ARBs), which play a crucial role in inhibiting the renin–angiotensin–aldosterone system, are typically used as the main treatment for hypertension caused by VEGFR-TKIs.7 However, combination therapy may elicit drug-drug interactions between TKIs and ARBs.
The oral first-generation multitarget TKI, sorafenib, has been approved for the treatment of hepatocellular carcinoma (HCC) and advanced renal cell carcinoma (RCC) by the US Food and Drug Administration (FDA). It targets a range of receptor tyrosine kinases, including VEGFR.8,9 However, it is significantly associated with a higher incidence of hypertension.10 Following oral intake in human, sorafenib achieves its maximum plasma concentration in about 3 hours, with more than 99% binding to plasma proteins. Sorafenib is primarily processed in the liver by cytochrome P450 (CYP) 3A4 and UDP-glucuronosyltransferases (UGTs) like UGT1A9 and UGT1A1, with an elimination half-life of 25 to 48 hours. P-glycoprotein (P-gp), breast cancer resistance protein (BCRP), and multidrug resistance-associated protein 2 (MRP2) appear to play key roles in the pharmacokinetics of sorafenib.11–14 More importantly, sorafenib is recognized as one of the most effective inhibitors of human UGTs known to date (IC50 = 23.4 μM).14 Research indicates that sorafenib can affect the pharmacokinetic properties of drugs metabolized by UGTs, which necessitates understanding pharmacokinetic interactions between sorafenib and UGT substrates, or drugs primarily metabolized by UGTs.15,16
Donafenib, a deuterated derivative of sorafenib, is an oral small-molecule multi-kinase inhibitor that was approved for the treatment of hepatocellular carcinoma and thyroid cancer, in 2021.17 Deuteration can enhance the stability of a drug, resulting in an extended half-life, reduced systemic clearance, and increased systemic exposure.18 After oral administration of a single dose (100 to 400 mg), donafenib reaches peak plasma levels within 2–3 hours. The half-life for plasma elimination of donafenib is between 21 and 28 hours.19,20 Research conducted in vitro shows that CYP3A4 and UGT1A9 are the primary enzymes responsible for the metabolism of donafenib, with CYP1B1, CYP2C8, CYP2C9, CYP2C19, CYP2D6, and CYP3A5 contributing to a smaller extent.21 Due to its structural resemblance to sorafenib, donafenib might influence the pharmacokinetic properties of drugs metabolized by UGTs.22 However, due to structural differences between sorafenib and donafenib, drug interactions of sorafenib may not directly translate to donafenib, thus characterization of donafenib interactions are warranted.
Telmisartan, having a longer half-life than other ARBs, offers more potent and lasting antihypertensive effects, making it a preferred option for treating hypertension. It can be administered alone or alongside other antihypertensive drugs.23–25 The bioavailability of telmisartan depends on the dose, as higher doses result in higher bioavailability, ranging from 42% to 57%. Telmisartan binds to plasma proteins at a rate of 99.5%, and its half-life for elimination is about 24 hours.26 Instead of undergoing metabolism by the CYP450 system, a large proportion of telmisartan is eliminated from the body as the parent drug, with only a small proportion (11%) being metabolized to acyl-glucuronides by UGT1A3 and excreted into the feces.25,27 Telmisartan does not affect P450 enzymes in vitro, except for causing a minor inhibition of CYP2C19. Additionally, studies have indicated that telmisartan acts as both a substrate and an inhibitor of P-gp (IC50 = 12.4 μM), BCRP (IC50 = 6.7 μM), and MRP2 (IC50 = 38.2 μM).26,28
Because telmisartan, sorafenib, and donafenib share similar metabolic pathways and transporters for elimination, using telmisartan with sorafenib or donafenib could increase interaction risks. To investigate potential drug-drug interactions, a reliable and sensitive analytical method for quantifying plasma concentrations of the target compounds is essential. While multiple techniques are available for drug plasma analysis, existing methods have several drawbacks: large sample volumes, narrow dynamic ranges, and time-consuming procedures that limit clinical utility, and no established approach enables the simultaneous determination of these three drugs.29–31 Therefore, the objectives of this study were to develop and validate a robust ultra-performance liquid chromatography-tandem mass spectrometry (UPLC-MS/MS) method for the simultaneous measurement of telmisartan, sorafenib, and donafenib, and to investigate the drug-drug interactions between them.
Materials and Methods
Materials
Sorafenib (99.5% purity, Lot ZZS-20-638-G3) and donafenib (99.9% purity, ZZS-20-X261-A1) were sourced from Shanghai Zhen Zhun Biotechnology Co., Ltd. (Shanghai, China). Telmisartan (purity ≥ 98%, Y20A7C13363) was purchased from Shanghai Yuan ye Bio-Technology Co., Ltd. (Shanghai, China). 2H3-telmisartan (purity 99.8%, Lot 1062–070A1) was acquired from TLC Pharmaceutical Standards (Aurora, Canada). Dimethyl sulfoxide (DMSO) was sourced from Beijing Solarbio Science Technology Co., Ltd. (Beijing, China). Formic acid, ammonium acetate, and acetonitrile of HPLC grade were procured from Fisher Scientific (Pittsburgh, PA, USA). Ultrapure water supplied by Wahaha Group Co., Ltd. (Hangzhou, China) was employed for the entire study.
Methods
Instruments and Analytical Conditions
A UPLC-MS/MS system, which includes an LC-30A ultra-performance liquid chromatograph (Shimadzu, Japan) and a Sciex Triple Quad 5500 triple quadrupole mass spectrometer (Sciex, USA), was used to quantify sorafenib, donafenib, telmisartan, and 2H3-telmisartan. ZORBAX SB-C18 column (2.1 mm × 100 mm, 3.5 μm) facilitated chromatographic separation through gradient elution, with the temperature maintained at 40°C. The mobile phase includes phase A, which is water with 0.1% formic acid and 5 mM ammonium acetate, and phase B, which is acetonitrile. Gradient elution was conducted at a flow rate of 0.7 mL/min with the following program: 0–2.0 min, 60% B; 2.0–2.5 min, 60–90% B; 2.5–3.5 min, 90% B; 3.5–3.6 min, 90–60% B; 3.6–4.6 min, 60% B.
Positive-mode electrospray ionization was used to ionize the analytes, which were then detected using multiple reaction monitoring (MRM). The monitoring transitions were m/z 465.2→252.1, 468.1→255.1, 515.2→276.1, and 518.3→279.2 for sorafenib, donafenib, telmisartan, and 2H3-telmisartan, respectively (Figure 1). The parameters for the mass spectrometer were set as follows: 50.0 psi for ion source gas 1, 60.0 psi for ion source gas 2, 20.0 psi for curtain gas, a source temperature of 500°C, and an ion spray voltage of 5500 V. Table 1 provides a summary of the optimized mass spectrometer parameters.
 |
Figure 1 The mass spectra of sorafenib (A), doanfenib (B), telmisartan (C), and 2H3-telmisartan (D). |
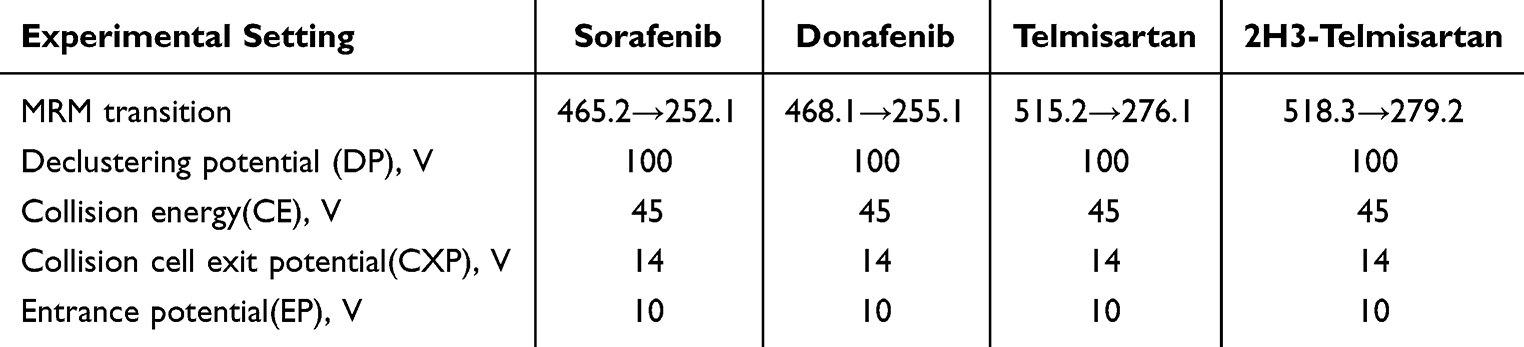 |
Table 1 Experimental Setting for the Tandem Mass-Spectrometer for Analytes and Internal Standard |
Preparation of Calibration Standards and Quality-Control Samples
Sorafenib, donafenib, telmisartan, and 2H3-telmisartan stock solutions, each at 2 mg/mL, were individually prepared in DMSO. By diluting the stock solutions with a mixture of 50% acetonitrile and water, working solutions for calibration were prepared. To prepare calibration standards, 5 μL of the working solution was added to 45 μL of blank rat plasma. The resulting calibration curve concentrations for sorafenib were 5, 15, 50, 200, 800, 2000, and 5000 ng/mL;10, 30, 100, 400, 1600, 4000, and 10,000 ng/mL for donafenib; and 1, 5, 10, 50, 100, 200, and 800 ng/mL for telmisartan. Likewise, the quality-control (QC) samples had final concentrations of 10, 500, and 3750 ng/mL for sorafenib; 20, 3000, and 7500 ng/mL for donafenib; and 2, 80, and 600 ng/mL for telmisartan. The internal standard (IS) working solution of each drug (500 ng/mL of donafenib, 2000 ng/mL of sorafenib, and 500 ng/mL of 2H3-telmisartan) was prepared by diluting its stock solution with 50% acetonitrile–water. 2H3-telmisartan was used as the IS for telmisartan, whereas sorafenib and donafenib were used as each other’s ISs. Stock solutions, working solutions, calibration standards, and QC samples were stored at −20°C until subsequent analysis.
Plasma Sample Preparation
Protein precipitation was used to prepare the plasma samples. A rat plasma sample (25 µL) was combined with 2.5 µL of the IS working solution and 75 µL of acetonitrile. The mixture was vortexed for 1 minute and centrifuged at 12,000 rpm for 10 minutes. Subsequently, 25 μL of the supernatant and 50 μL of 50% acetonitrile–water were transferred to a clean centrifuge tube and vortexed. A total of 5 μL of this solution was injected into the UPLC-MS/MS system for analysis.
Method Validation
The UPLC-MS/MS method was comprehensively validated for selectivity, calibration, lower limit of quantification (LLOQ), accuracy, precision, matrix effects, recovery, and stability according to the guidelines.30 Selectivity was evaluated using blank plasma samples obtained from six rats or samples spiked with analytes at the LLOQ and IS concentration and plasma samples from rats treated with sorafenib, donafenib, or telmisartan.
The calibration curves were analyzed for sorafenib concentrations ranging from 5 to 5000 ng/mL, donafenib from 10 to 10,000 ng/mL, and telmisartan from 1 to 800 ng/mL. By plotting the peak ratio of the target analyte area to the internal standard area against the weighted plasma concentration (1/x2), graphs were constructed, and the relationship was modeled using linear least-square regression. Intra- and inter-day precision and accuracy were evaluated by analyzing six replicates of LLOQ and QC samples processed at low, medium, and high concentrations on 3 consecutive days. Matrix effects were calculated by evaluating the normalized matrix factor of six replicates of low- and high-concentration QC samples. The stability of rat plasma was assessed by analyzing six replicates of QC samples. The stability of analytes was evaluated at both low and high QC levels under four storage and processing conditions (n=6): room temperature (25°C) for 8 h, autosampler temperature (15°C) for 12 h, −80 °C for 14 days, and after three freeze–thaw cycles (−80°C to 25°C).
Animals
Adult male Sprague-Dawley rats, with weights of 230 ± 30 g, were sourced from Beijing Huafukang Biotechnology Co., Ltd. (Beijing, China; license number SCXK [Jing] 2019–0008). The Animal Ethics Committee of Hebei General Hospital (Shijiazhuang, China) reviewed and approved all animal-related experimental procedures (No. 202216). The welfare of the laboratory animals followed the Guidelines for the Ethical Review of Laboratory Animal Welfare People’s Republic of China National Standard GB/T 35892–20181.
The rats were housed under controlled conditions (23 ± 2°C, 12-h dark/12-h light cycle, relative humidity of 50 ± 10%) and were acclimatized for a week to minimize any influence. All rats had unrestricted access to food and water; however, food was prohibited for 12 h before drug administration.
In Vivo Pharmacokinetic Experiments
The rats were randomly divided into seven groups (n = 6). Sorafenib, donafenib and telmisartan were suspended in 0.5% sodium carboxymethyl cellulose (CMC-Na). Rats in groups I–III were administered 0.5% CMC-Na for seven consecutive days, and on the seventh day, they received sorafenib, donafenib, and telmisartan at doses of 100 mg/kg, 40 mg/kg, and 8 mg/kg, respectively, via gavage. Rats in group IV were given 100 mg/kg of sorafenib, while those in group V received 40 mg/kg of donafenib for seven consecutive days, followed by 8 mg/kg of telmisartan on the seventh day. Rats in groups VI and VII, after receiving 8 mg/kg of telmisartan for 7 days, were subsequently administered 100 mg/kg of sorafenib (group VI) or 40 mg/kg of donafenib (group VII) on the seventh day.
For drug detection, 0.1 mL of rat blood was collected into heparinized test tubes at the following time points: 0, 0.5, 1, 2, 3, 4, 5, 6, 7, 8, 10, 12, 24, 48, and 72 h for sorafenib; 0, 0.5, 1, 2, 3, 4, 5, 6, 7, 8, 10, 12, 24, 48, 72, 96, and 120 h for donafenib; and 0, 0.17, 0.33, 0.5, 0.75, 1, 2, 3, 4, 6, 8, 10, 12, 24, 48, and 72 h for telmisartan. Blood samples were centrifuged at 4500 rpm for 10 minutes, with the supernatant collected and stored at −80°C for subsequent UPLC-MS/MS analysis.
Statistical Analysis
The sample size (n = 6 per group) was determined using the resource equation method.32 For one-way analysis of variance (ANOVA), the minimum sample size was calculated as n = 10/ (k + 1), where k represents the number of groups. In this study, comparing pharmacokinetic parameters between two treatment groups (experimental and control) resulted in a sample size per group of n = 10/2 + 1 = 6.
The non-compartmental model, utilizing DAS software (version 2.1.1, Mathematical Pharmacology Professional Committee of China, Shanghai, China), was used to assess the pharmacokinetic parameters of the three drugs. The parameters consisted of the area under the concentration–time curve (AUC), the maximum concentration in plasma (Cmax), the time to reach this maximum concentration (Tmax), the half-life of the drug in plasma (t1/2), clearance of drug plasma volume per time unit (CLz/F), and apparent volume of distribution (Vz/F). SPSS software (SPSS Inc., Chicago, IL, USA) was used to statistically analyze the parameters. Datasets were compared using independent-sample t-tests when they exhibited normality and homogeneity of variance; otherwise, Welch correction (Welch’s t-test) or the Mann–Whitney U-test was employed. Normality was assessed using the Shapiro–Wilk test and visual inspection of Q-Q plots, while homogeneity of variance was confirmed through Levene’s test. A P-value of <0.05 was considered statistically significant. Pharmacokinetic parameters were expressed as the mean ± standard deviation or median with interquartile range (IQR), depending on normality assessments.
Results
Method Validation
Figure 2 depicts the chromatograms obtained from a blank rat plasma sample, blank plasma samples with analytes added at the LLOQ and IS levels, and plasma samples from rats administered with sorafenib, donafenib, or telmisartan. Interfering peaks were absent at the retention times of the drugs, that is, at 1.17 minutes for sorafenib, 1.16 minutes for donafenib, 0.85 minutes for telmisartan, and 0.85 minutes for 2H3-telmisartan.
 |
Figure 2 Representative chromatograms of sorafenib (A), doanfenib (B), telmisartan (C), and 2H3-telmisartan (D). I, a blank rat plasma sample; II, a blank rat plasma sample spiked with the working solution at LLOQ level and IS; III, a rat plasma sample after oral administration of 100 mg/kg sorafenib, 40 mg/kg doanfenib and 8 mg/kg telmisartan. |
The equations for the calibration curves of sorafenib, donafenib, and telmisartan were Y = 0.013X + 0.0123 (r = 0.9980), Y = 0.00113X + 0.00547 (r = 0.9980), and Y = 0.0149X + 0.0012 (r = 0.999), respectively. The precision (RSD) and accuracy (RE) at all concentrations on the standard curves, including the LLOQ, were <15% of the standard concentration. Table 2 presents the precision and accuracy of QC samples. For all analyte concentrations tested in rat plasma, the intra- and inter-day precision values remained below 6.5%, with accuracy ranging from −8.7% to 7.8%, indicating the reproducibility of the proposed method. Matrix effects, evaluated as IS-normalized matrix factor, ranged from 1.01 to 1.06 for sorafenib, 1.01 to 1.02 for donafenib, and 1.03 to 1.09 for telmisartan, indicating negligible matrix effects (Table 3). The extraction recovery ranged from 96.2% to 101.8% for sorafenib, 98.9% to 101.3% for donafenib and 86.5% to 100.8% for telmisartan and the RSDs were <15%. In all four storage and handling scenarios, the RE values of the drugs were below 7.0%, and the RSDs were under 10% (Table 4). This suggests that the drugs in rat plasma samples remained stable.
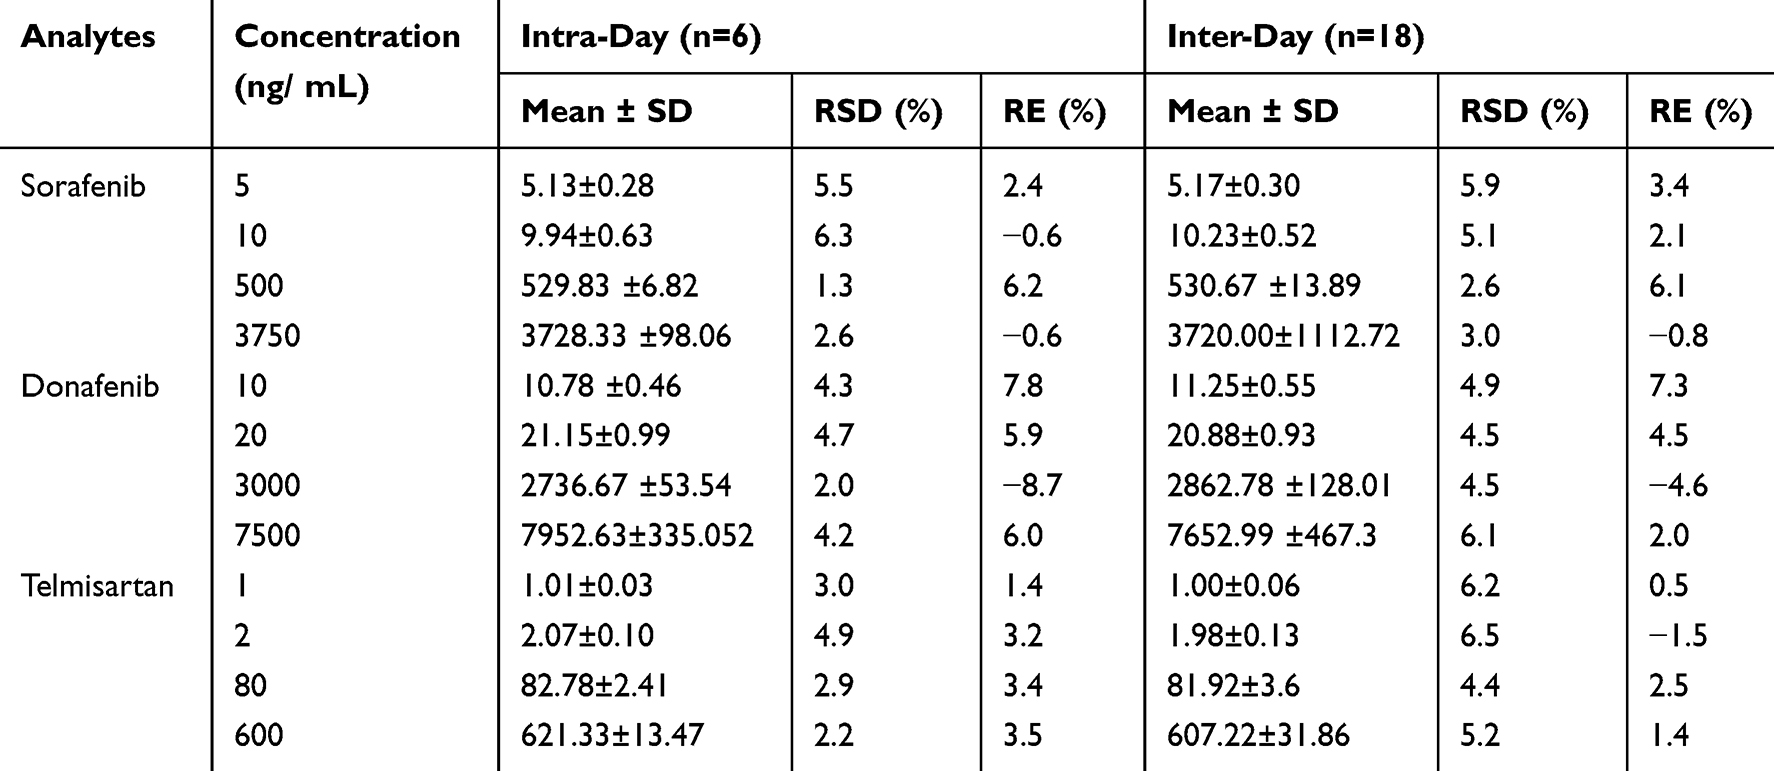 |
Table 2 Intra- and Inter-Day Precision and Accuracy of Sorafenib, Donafenib and Telmisartan in Rat Plasma |
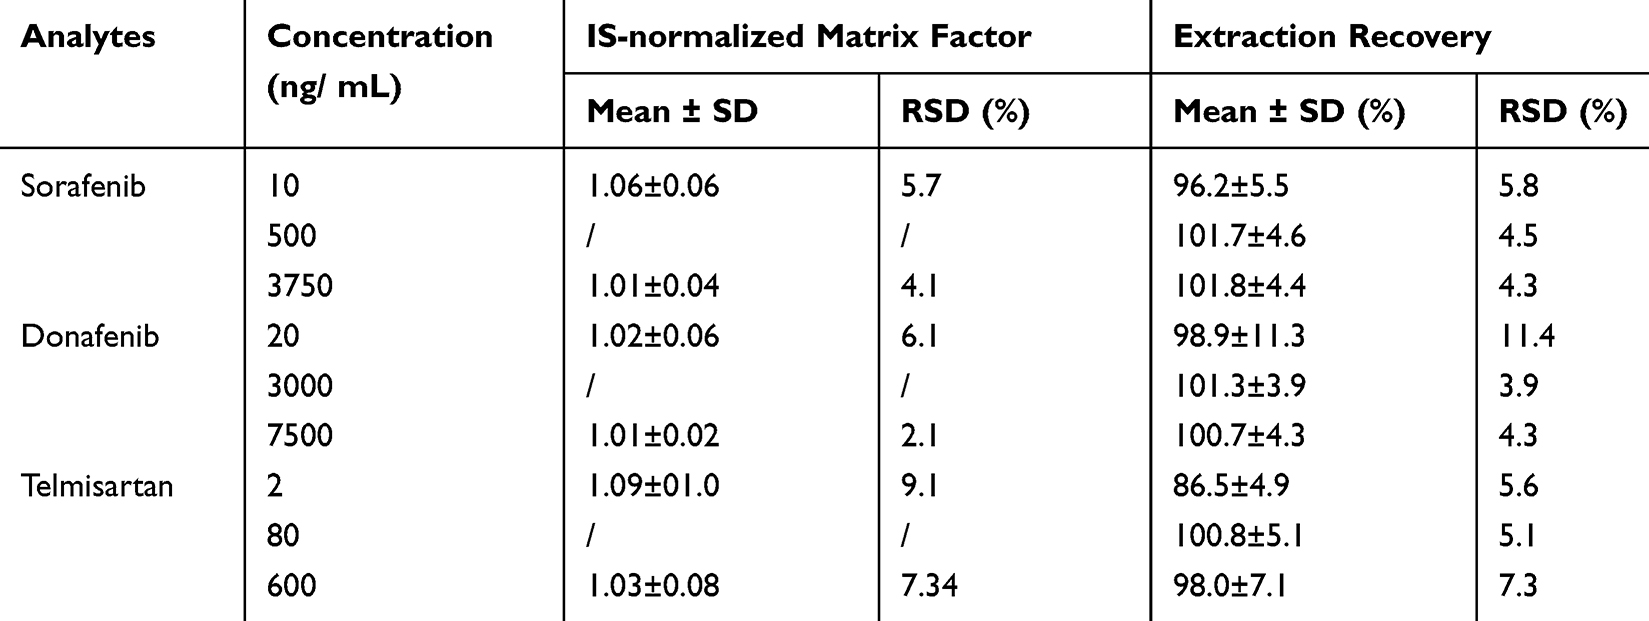 |
Table 3 Matrix Effect and Extraction Recovery of Sorafenib, Donafenib and Telmisartan in Rat Plasma (n = 6) |
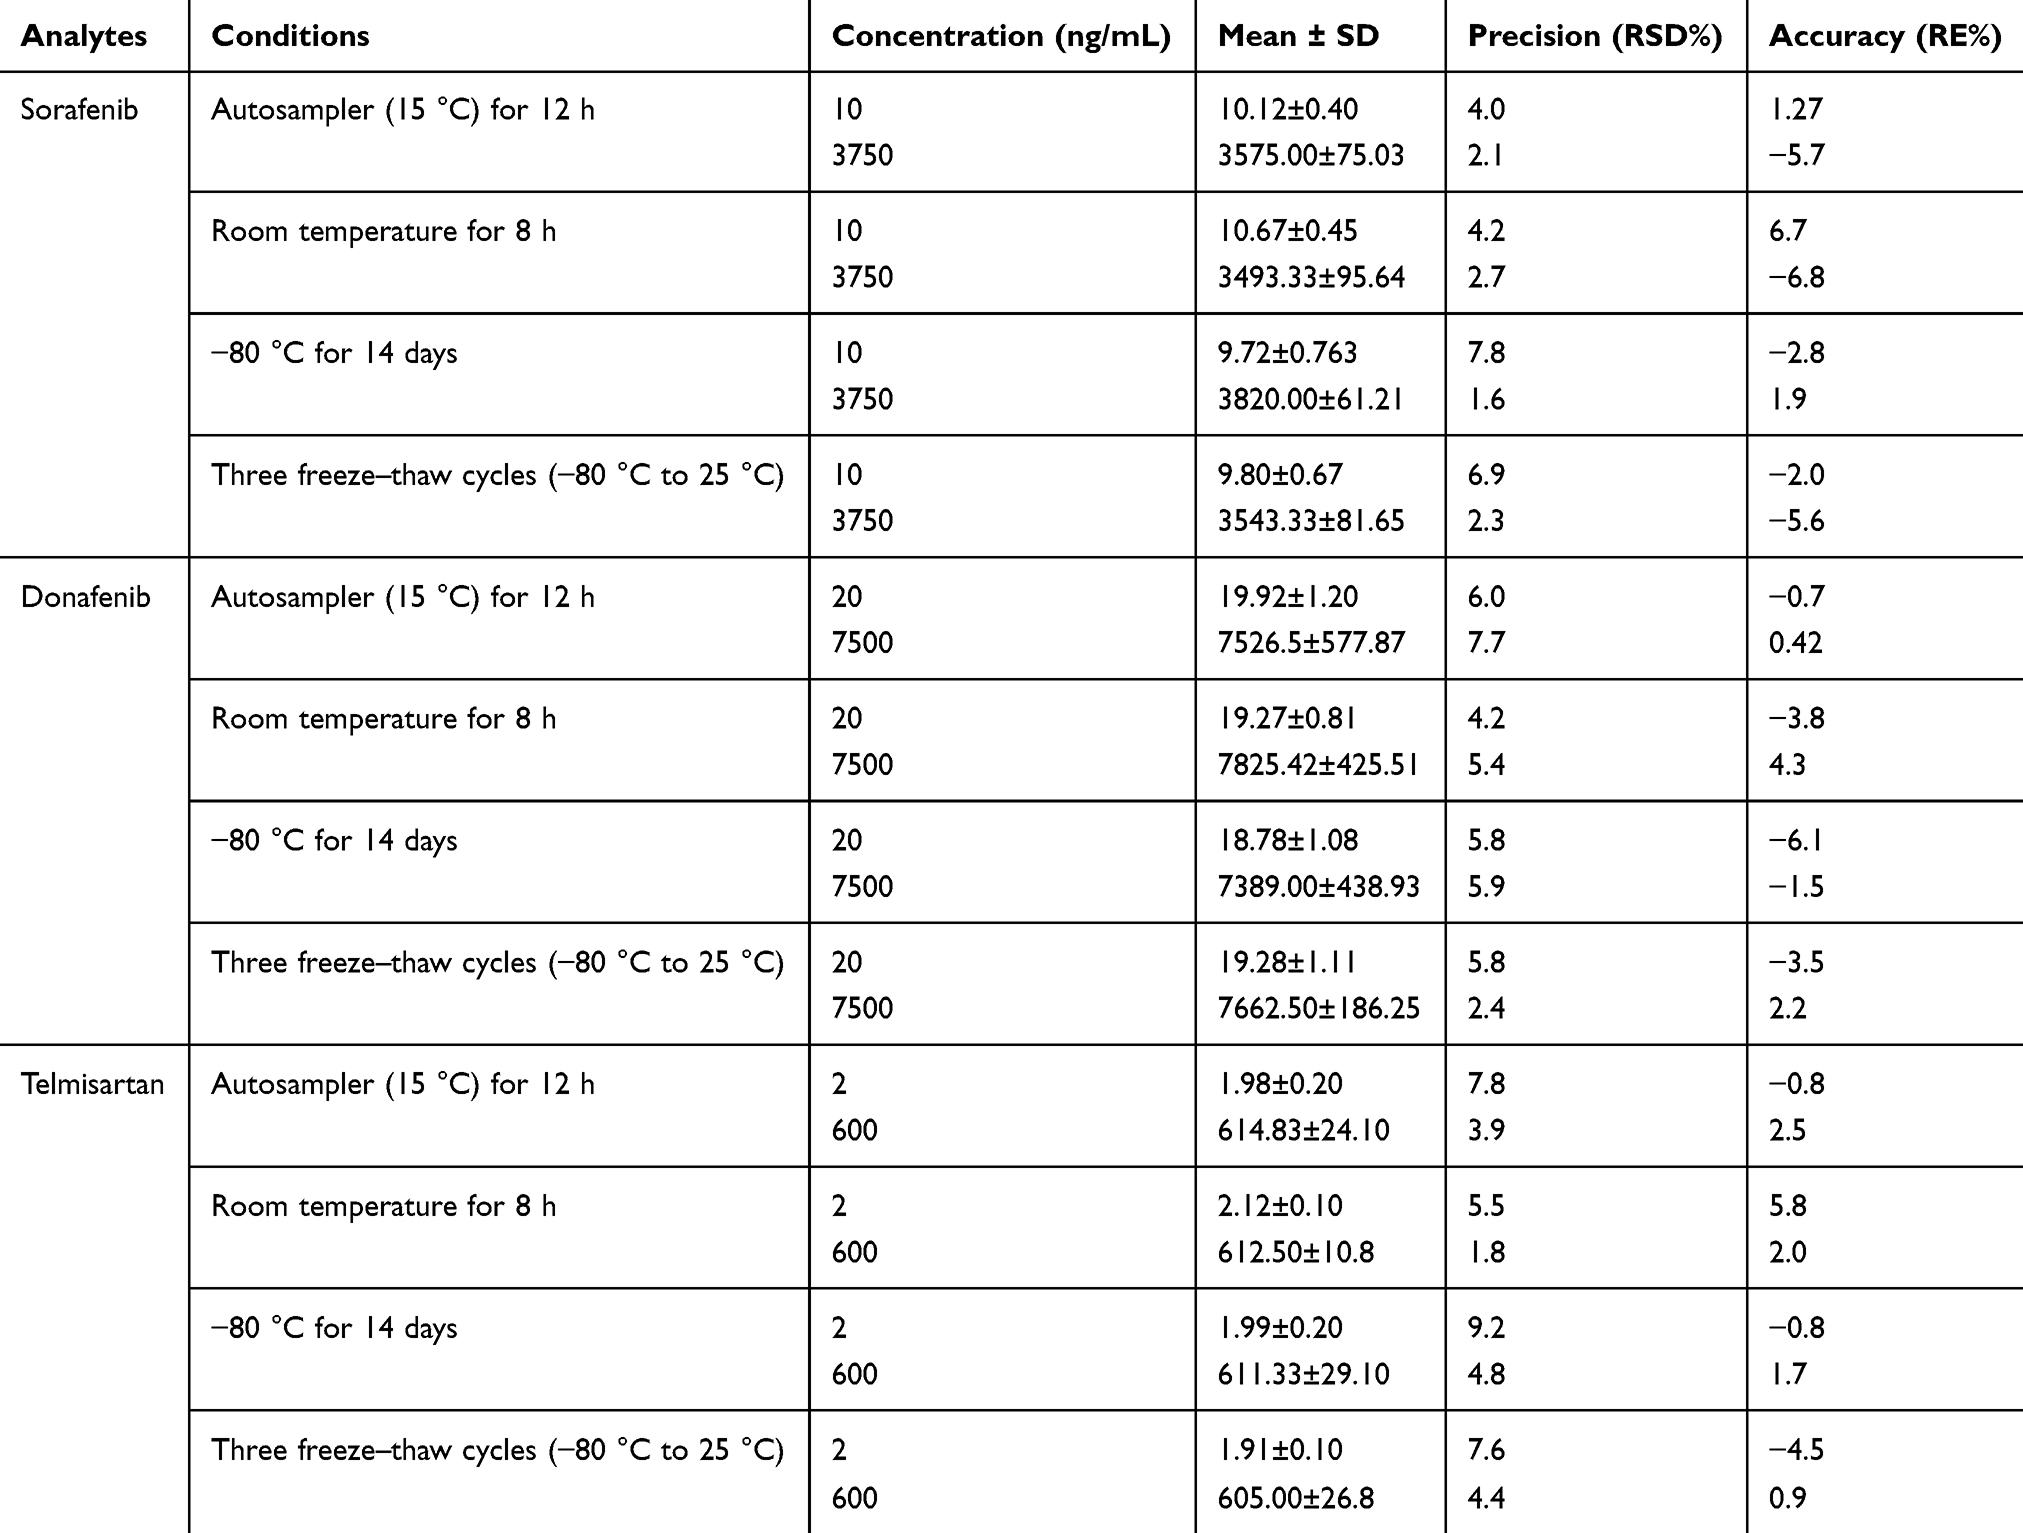 |
Table 4 Stability of Sorafenib, Donafenib and Telmisartan in Rat Plasma (n = 6) |
Pharmacokinetic Interactions
Influence of Sorafenib and Donafenib on the Pharmacokinetics of Telmisartan
Figure 3 shows the mean concentration–time curves of telmisartan administered alone and in combination with multiple doses of sorafenib or donafenib. The main pharmacokinetic parameters of telmisartan are summarized in Table 5. The data suggested that sorafenib does not significantly affect the pharmacokinetic parameters of telmisartan.
 |
Figure 3 Mean plasma concentration–time profiles of telmisartan after oral administration alone and following multiple doses of sorafenib or donafenib. |
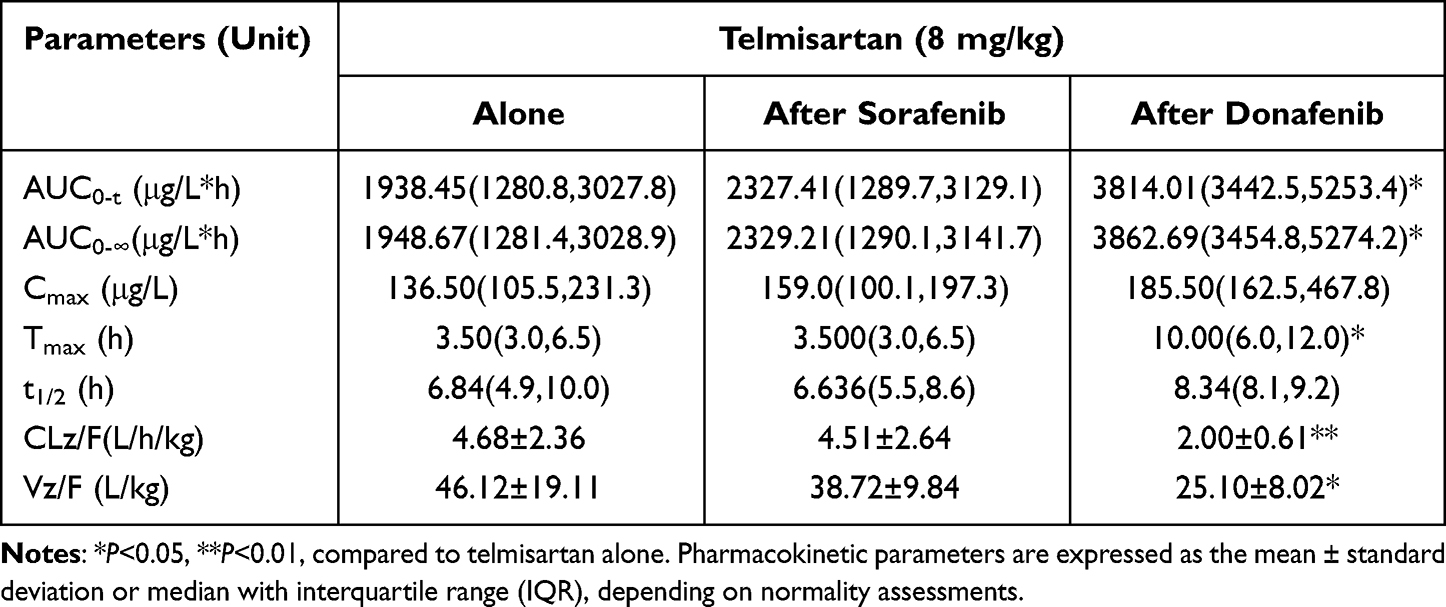 |
Table 5 Pharmacokinetic Parameters of Telmisartan in Rats When Administered Alone and Following Multiple Doses of Sorafenib or Donafenib |
Multiple doses of donafenib led to a 0.97-fold (P=0.010) and 0.98-fold (P=0.010) increase in the AUC0-t and AUC0–∞ values of telmisartan, respectively. In addition, the CLz/F and Vz/F of telmisartan significantly decreased by 57.3% (P=0.038) and 45.6% (P=0.032) and Tmax was prolonged by almost 6 h (P=0.017) when compared with that in the telmisartan-alone group. However, no significant differences were observed in Cmax or t1/2 between the telmisartan-alone and multi-dose donafenib + telmisartan groups.
Influence of Telmisartan on the Pharmacokinetics of Sorafenib
Figure 4 displays the average plasma concentration-time curves for sorafenib when given alone and after multiple doses of telmisartan, and Table 6 lists the main pharmacokinetic parameters of sorafenib. The pharmacokinetic parameters of sorafenib were significantly affected after its co-administration with telmisartan. In particular, the AUC0-t, AUC0-∞, and Cmax of sorafenib increased by 77.7% (P<0.001), 75.8% (P<0.001), and 60.9% (P=0.049), respectively, whereas Vz/F (50.4%, P=0.008) and CLz/F (46.0%, P=0.006) were significantly decreased. However, the Tmax and t1/2 of sorafenib did not show significant differences between the sorafenib-alone and multi-dose telmisartan + sorafenib groups.
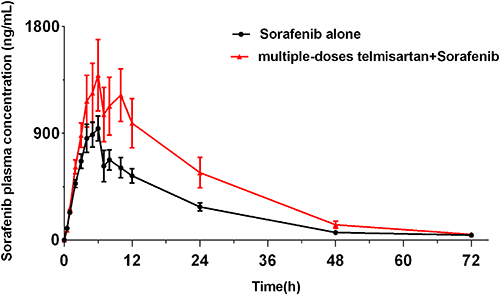 |
Figure 4 Mean plasma concentration–time profiles of sorafenib after oral administration alone and following multiple doses of telmisartan. |
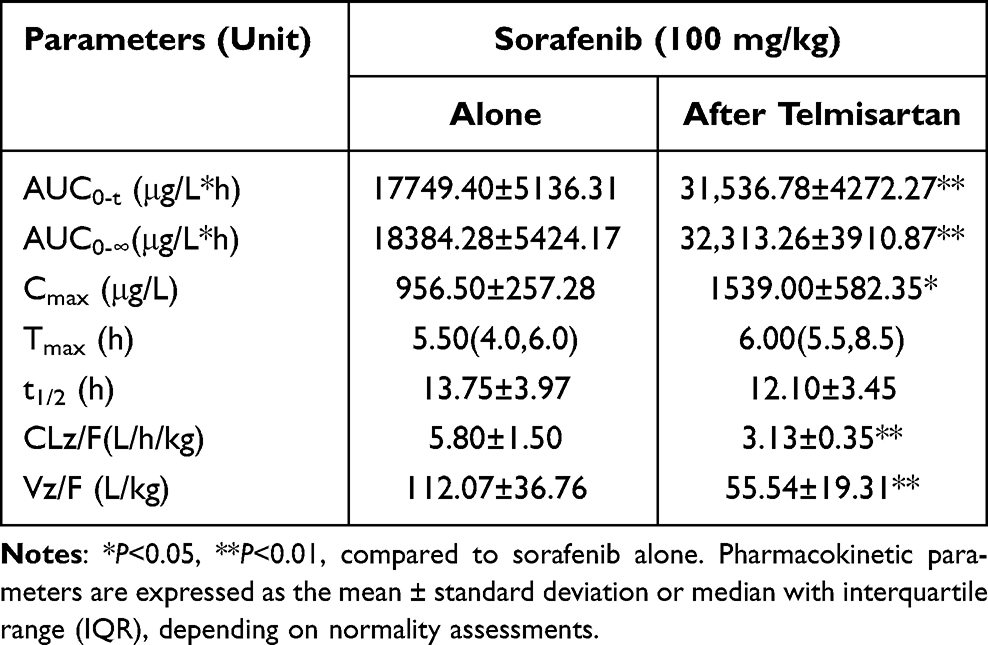 |
Table 6 Pharmacokinetic Parameters of Sorafenib in Rats After Oral Administration Alone and Following Multiple Doses of Telmisartan |
Influence of Telmisartan on the Pharmacokinetics of Donafenib
Figure 5 presents the mean plasma concentration-time curves of donafenib administered alone and after multiple doses of telmisartan. The main pharmacokinetic parameters of donafenib are shown in Table 7. When telmisartan and donafenib were co-administered, the CLz/F of donafenib significantly increased by 87.5% (P=0.019), whereas t1/2 decreased by 35.0% (P=0.020). The AUC0-t, AUC0-∞, and Cmax values of donafenib were lower in the multi-dose telmisartan + donafenib group than in the donafenib-alone group; however, the difference was not statistically significant.
 |
Figure 5 Mean plasma concentration–time profiles of donafenib after oral administration alone and following multiple doses of telmisartan. |
 |
Table 7 Pharmacokinetic Parameters of Donafenib in Rats After Oral Administration Alone and Following Multiple Doses of Telmisartan |
Discussion
An UPLC-MS/MS method was developed for the simultaneous quantification of sorafenib, donafenib, and telmisartan concentrations. The mobile phase, gradient elution steps, and mass spectrometry conditions were optimized in this study to allow for the simultaneous detection of three drugs in rat plasma. The addition of formic acid (0.1%) and 5 mM ammonium acetate to the water can diminish the tailing effects of sorafenib and donafenib, leading to distinct symmetric peaks, as well as decreased background noise. In gradient elution steps, establishing a higher initial proportion of mobile phase B effectively eliminated the carryover of sorafenib and donafenib. The optimization of mass spectrometry conditions resulted in an increased analyte response in positive ion mode. The [M + H]+ ion was selected as the parent ion for the analytes due to its superior response. The ion pairs obtained after the screening of sorafenib, donafenib, and telmisartan, and 2H3-telmisartan were as follows: 465.2→252.1, 468.1→255.1, 515.2→276.1, and 518.3→279.2. Optimization was also conducted for other mass conditions, namely declustering potential (DP), collision energy (CE), and ion source temperature (TEM).
Isotope-labeled internal standards are most commonly used in tandem mass spectrometry to eliminate errors due to matrix interference and differential ionization properties of the analytes. Donafenib, a deuterated derivative of sorafenib, was used as the internal standard for sorafenib, and conversely, sorafenib was used as the internal standard for donafenib. Additionally, 2H3-telmisartan was employed as the internal standard for telmisartan in this study. No significant matrix effects were observed at the retention times of the analytes. The protein precipitation method, known for its simplicity, speed, cost-effectiveness, and environmental friendliness, is considered more suitable for pharmacokinetic research when contrasted with liquid-liquid extraction and solid-phase extraction. Consequently, acetonitrile was utilized as the protein precipitant in this study.
This study reveals potential pharmacokinetic interactions between telmisartan and sorafenib or donafenib, characterized by a marked increase in sorafenib and telmisartan exposure. The AUC value of telmisartan was 0.97-fold higher in the multi-dose donafenib + telmisartan group than in the telmisartan-alone group, whereas the AUC value of sorafenib was 75.8% higher in the multi-dose telmisartan + sorafenib group than in the sorafenib-alone group. These results accentuate the possibility of increased adverse drug reactions when these drugs are used concurrently, highlighting need for further study in human to assess the translation of these interactions.
Multiple doses of sorafenib did not significantly impact the pharmacokinetic parameters of telmisartan. Research conducted in vitro has demonstrated that P-gp, BCRP, OATP1B3, and MRP2 are crucial in regulating the pharmacokinetics of telmisartan; however, in vivo only MRP2 is a known factor for human PK. Although sorafenib and telmisartan are substrates for MRP2, there is no direct evidence that either drug inhibits or induces intestinal MRP2, which may explain a lack of interaction of sorafenib on telmisartan pharmacokinetics.33 Telmisartan is also a substrate for UGT1A3, as a small proportion (11%) of telmisartan is metabolized to acyl-glucuronides by UGT1A3 for elimination from the body.34 Sorafenib has been identified as a potent inhibitor of human UGT1A1 and UGT1A9; however, it has no inhibitory effects on UGT1A3.14 This phenomenon may be another explanation for the absence of the effects of sorafenib on the pharmacokinetic characteristics of telmisartan.
Despite being a deuterated derivative of sorafenib, donafenib exerted different effects on the pharmacokinetic characteristics of telmisartan when compared with sorafenib. The concurrent administration of donafenib and telmisartan led to increased telmisartan exposure, characterized by a 0.97-fold increase in AUC and a 6-h prolongation in Tmax. We speculate that donafenib increases the absorption of telmisartan and/or inhibits its metabolism. The t1/2 of telmisartan showed no significant differences between the telmisartan-alone and multi-dose donafenib + telmisartan groups. This finding suggests that inhibition of metabolism may not be the primary factor contributing to the increased telmisartan exposure in rats. The increased exposure to telmisartan after donafenib administration may be attributed to the enhanced absorption of telmisartan. Telmisartan, classified as a BCS class II drug, exhibits markedly low water solubility and high permeability, with solubility potentially being a key factor in its reduced bioavailability. However, we speculate that donafenib may not enhance the bioavailability of telmisartan by influencing its solubility in the small intestine. It is unlikely to affect the bioavailability of telmisartan by influencing intestinal transporters. Moreover, its lower bioavailability may be associated with first-pass elimination via glucuronidation.33,35 Donafenib may further enhance telmisartan bioavailability through inhibition of intestinal UGT1A3-mediated metabolism, thereby reducing first-pass elimination in the small intestine. Owing to limited research on donafenib, the precise mechanism underlying its enhancement of telmisartan bioavailability remains unclear. Therefore, future research could focus on the impact of donafenib on metabolic enzymes and transporters to explore the mechanism of this interaction. Increasing the bioavailability of telmisartan may not only enhance its antihypertensive efficacy but also result in adverse reactions. Therefore, monitoring the adverse effects of telmisartan is essential when concurrently administering it with donafenib.
In this study, we found that the AUC and Cmax values of sorafenib markedly increased when it was administered after 7 days of treatment with telmisartan. However, the t1/2 of sorafenib did not show significant differences between the sorafenib-alone and multi-dose telmisartan + sorafenib groups. Unlike the co-administration of sorafenib and telmisartan, the co-administration of donafenib and telmisartan decreased the exposure to donafenib. Specifically, the AUC0-t value of donafenib decreased by 54.9%; however, this decrease was not statistically significant. Moreover, the t1/2 of donafenib was lower in the multi-dose telmisartan + donafenib group than in the donafenib-alone group (15.06 h versus 23.17 h).
The remarkable increase in sorafenib exposure after its co-administration with telmisartan may be attributed to the effects of the P-gp, BCRP, and UGT pathways in the intestine. Telmisartan, which inhibits P-gp, caused higher serum digoxin concentrations when administered with digoxin compared to digoxin alone.36,37 Studies have indicated that sorafenib is a substrate for P-gp and BCRP. Therefore, the increased sorafenib exposure in the presence of telmisartan can most likely be attributed to the inhibition of intestinal transport processes, which may increase the intestinal absorption of sorafenib. In addition, telmisartan may act as an inducer of UGTs, which can decrease the exposure to mycophenolic acid by activating PPAR-γ and enhancing UGT1A9 expression.38 Induction of UGTs leads to increased conjugation by UGT1A9 to produce sorafenib–glucuronide (SG) in the liver, which is extensively secreted into the bile. Upon secretion, SG enters the intestinal lumen and is cleaved by bacterial β-glucuronidases to sorafenib, which subsequently undergoes intestinal absorption and re-enters systemic circulation.39 Although induction of UGTs accelerates sorafenib metabolism and reduces its systemic exposure, the reabsorption of the drug may also increases its exposure in systemic circulation.40 However, the effects of UGTs on the increased systemic exposure to sorafenib remain unknown.
Donafenib is metabolized in a way similar to sorafenib, but the amounts of each metabolite differ. Research on the mass balance of oral sorafenib in humans revealed that 15% of the drug was eliminated as sorafenib-β-D-glucuronide (SG), compared to less than 5% as oxidative metabolites. In contrast, donafenib metabolism is dominated by N-oxidation (M2, 24.76% of total drug), with glucuronidation (M7) representing a minor pathway (4.82%).41 Furthermore, in vivo pharmacokinetic studies have demonstrated that UGT-mediated metabolism contributes substantially less to the overall clearance of donafenib compared to sorafenib.21 These distinct metabolic profiles suggest that UGT inhibitors/inducers may differentially affect the pharmacokinetics of these two drugs. Since telmisartan is not a modulator of CYP, it may not influence the metabolism of donafenib mediated by CYP. Although telmisartan may be an inducer of UGT, the relatively minor contribution of UGT to donafenib clearance suggests that telmisartan would have negligible effects on the exposure of donafenib by inducing UGT. To date, no studies have shown whether donafenib is a substrate for P-gp or BCRP and whether telmisartan-induced transporter inhibition influences the systemic exposure to donafenib. However, despite their structural similarities, sorafenib and donafenib exhibit distinct pharmacokinetic profiles, as evidenced by differences in their metabolite proportion and distributions. These observed variations likely stem from subtle structural modifications that differentially affect their binding affinities to metabolic enzymes and transporters. This mechanistic distinction also provides a plausible explanation for the contrasting effects of telmisartan on the two drugs’ pharmacokinetics.
The mechanisms underlying the differential pharmacokinetic effects of telmisartan on sorafenib and donafenib remain unclear. However, this study may provide valuable guidance for the co-administration of sorafenib or donafenib and telmisartan in clinical settings. For instance, the co-administration of telmisartan with sorafenib may increase sorafenib exposure, potentially leading to adverse effects. Therefore, monitoring the plasma concentration of sorafenib during combination therapy is necessary for the prompt detection of any alterations in sorafenib metabolism. Although telmisartan has minimal effects on donafenib exposure, these effects may become significant under certain conditions. Therefore, when telmisartan is used in combination with donafenib, monitoring the therapeutic efficacy of donafenib is necessary.
However, it is crucial to address these limitations of this study. First, no experimental animal models for cancer have been established to evaluate DDI. It is our understanding that the effect of cancer on hepatic and renal function might downregulate CYPs and UGTs, which may change drug pharmacokinetics, impair the clearance of drugs.42,43 In addition, species differences exist, which means that DDIs may differ between rats and humans. In summary, the results provide essential information about the DDI potential of investigational drugs and can inform future clinical DDI studies, and by the way, further clinical interaction studies are needed to conduct with these drugs to provide useful information.
Conclusion
This study established a validated UPLC-MS/MS approach for the simultaneous quantification of sorafenib, donafenib, and telmisartan in rat plasma. It was successfully utilized to explore pharmacokinetic interactions involving telmisartan and donafenib or sorafenib. The results showed that multiple doses of donafenib enhanced systemic exposure to telmisartan in rats. In addition, telmisartan enhanced the bioavailability of sorafenib but decreased that of donafenib. This increased exposure to telmisartan and sorafenib, as a result of DDI, may elevate the risk of adverse reactions with telmisartan and sorafenib. Additionally, the decreased exposure of donafenib may possibly diminishing its therapeutic benefits. The pharmacokinetic findings indicate that intense monitoring is necessary when these drugs are used together. However, the exact mechanisms mediating the observed pharmacokinetic interactions between these drugs require additional study and further verification should be confirmed through clinical trials.
Funding
Supported by Hebei Natural Science Foundation (H2022307063).
Disclosure
The authors declare that there are no conflicts of interest.
References
1. Organization, WH. Cancer. 2022. Available from: https://www.who.int/news-room/fact-sheets/detail/cancer.
2. Pottier C, Fresnais M, Gilon M, Jérusalem G, Longuespée R, Sounni NE. Tyrosine kinase inhibitors in cancer: breakthrough and challenges of targeted therapy. Cancers. 2020;12(3):3. doi:10.3390/cancers12030731
3. Hou W, Ding M, Li X, et al. Comparative evaluation of cardiovascular risks among nine FDA-approved VEGFR-TKIs in patients with solid tumors: a Bayesian network analysis of randomized controlled trials. J Cancer Res Clin Oncol. 2021;147(8):2407–2420. doi:10.1007/s00432-021-03521-w
4. Ding F, Liu B, Wang Y. Risk of hand-foot skin reaction associated with vascular endothelial growth factor-tyrosine kinase inhibitors: a meta-analysis of 57 randomized controlled trials involving 24,956 patients. J Am Acad Dermatol. 2020;83(3):788–796. doi:10.1016/j.jaad.2019.04.021
5. Budolfsen C, Faber J, Grimm D, et al. Tyrosine kinase inhibitor-induced hypertension: role of hypertension as a biomarker in cancer treatment. Curr Vasc Pharmacol. 2019;17(6):618–634. doi:10.2174/1570161117666190130165810
6. Maitland ML, Bakris GL, Black HR, et al. Initial assessment, surveillance, and management of blood pressure in patients receiving vascular endothelial growth factor signaling pathway inhibitors. J Natl Cancer Inst. 2010;102(9):596–604. doi:10.1093/jnci/djq091
7. Bottinor WJ, Shuey MM, Manouchehri A, et al. Renin-angiotensin-aldosterone system modulates blood pressure response during vascular endothelial growth factor receptor inhibition. JACC CardioOncol. 2019;1(1):14–23. doi:10.1016/j.jaccao.2019.07.002
8. Ming Y, Gong Y, Fu X, Ouyang X, Peng Y, Pu W. Small-molecule-based targeted therapy in liver cancer. Mol Ther. 2024;32(10):3260–3287. doi:10.1016/j.ymthe.2024.08.001
9. Kathuria-Prakash N, Drolen C, Hannigan CA, Drakaki A. Immunotherapy and metastatic renal cell carcinoma: a review of new treatment approaches. Life. 2021;12(1). doi:10.3390/life12010024
10. Li J, Zhang L, Ge T, Liu J, Wang C, Yu Q. Understanding sorafenib-induced cardiovascular toxicity: mechanisms and treatment implications. Drug Des Devel Ther. 2024;18:829–843. doi:10.2147/dddt.S443107
11. Edginton AN, Zimmerman EI, Vasilyeva A, Baker SD, Panetta JC. Sorafenib metabolism, transport, and enterohepatic recycling: physiologically based modeling and simulation in mice. Cancer Chemother Pharmacol. 2016;77(5):1039–1052. doi:10.1007/s00280-016-3018-6
12. Gong L, Giacomini MM, Giacomini C, Maitland ML, Altman RB, Klein TE. PharmGKB summary: sorafenib pathways. Pharmacogenet Genomics. 2017;27(6):240–246. doi:10.1097/fpc.0000000000000279
13. Josephs DH, Fisher DS, Spicer J, Flanagan RJ. Clinical pharmacokinetics of tyrosine kinase inhibitors: implications for therapeutic drug monitoring. Ther Drug Monit. 2013;35(5):562–587. doi:10.1097/FTD.0b013e318292b931
14. Rowland A, van Dyk M, Mangoni AA, et al. Kinase inhibitor pharmacokinetics: comprehensive summary and roadmap for addressing inter-individual variability in exposure. Expert Opin Drug Metab Toxicol. 2017;13(1):31–49. doi:10.1080/17425255.2016.1229303
15. Mross K, Steinbild S, Baas F, et al. Results from an in vitro and a clinical/pharmacological Phase I study with the combination irinotecan and sorafenib. Eur J Cancer. 2007;43(1):55–63. doi:10.1016/j.ejca.2006.08.032
16. He X, Li Y, Ma Y, et al. Development of UPLC-MS/MS method to study the pharmacokinetic interaction between sorafenib and dapagliflozin in rats. Molecules. 2022;27(19). doi:10.3390/molecules27196190
17. Keam SJ, Duggan S. Donafenib: first Approval. Drugs. 2021;81(16):1915–1920. doi:10.1007/s40265-021-01603-0
18. Zhong L, Hou C, Zhang L, Zhao J, Li F, Li W. Synthesis of deuterium-enriched sorafenib derivatives and evaluation of their biological activities. Molecular Diversity. 2019;23:341–50.
19. Liu J, Li X, Zhang H, et al. Safety, pharmacokinetics and efficacy of donafenib in treating advanced hepatocellular carcinoma: report from a phase 1b trial. Die Pharmazie Inter J Pharmaceu Sci. 2019;74(11):688–93.
20. Qin S, Bi F, Gu S, et al. Donafenib versus sorafenib in first-line treatment of unresectable or metastatic hepatocellular carcinoma: a randomized, open-label, parallel-controlled phase II-III Trial. J Clin Oncol. 2021;39(27):3002–3011. doi:10.1200/jco.21.00163
21. Li X, Qiu M, Wang SJ, Zhu H, Zheng L. A phase I dose-escalation, pharmacokinetics and food-effect study of oral donafenib in patients with advanced solid tumours. Cancer Chemother Pharmacol. 2020;85(3):593–604.
22. He X, Li Y, Li Y, et al. In vivo assessment of the pharmacokinetic interactions between donafenib and dapagliflozin, donafenib and canagliflozin in rats. Biomed Pharmacother. 2023;162:114663. doi:10.1016/j.biopha.2023.114663
23. Ayza MA, Zewdie KA, Tesfaye BA, Gebrekirstos ST, Berhe DF. Anti-diabetic effect of telmisartan through its partial PPARγ-agonistic activity. Diabetes Metabolic Syndrome Obesity. 2020;Volume 13:3627–3635. doi:10.2147/DMSO.S265399
24. Domenico G, Capogrosso C, Di Michele S, et al. New standards in hypertension and cardiovascular risk management: focus on telmisartan. Vascular Health Risk Manage. 2010;113.
25. Imenshahidi M, Roohbakhsh A, Hosseinzadeh H. Effects of telmisartan on metabolic syndrome components: a comprehensive review. Biomed Pharmacother. 2024;171:116169. doi:10.1016/j.biopha.2024.116169
26. Michel MC, Foster C, Brunner HR, Liu L. A systematic comparison of the properties of clinically used angiotensin II type 1 receptor antagonists. Pharmacol Rev. 2013;65(2):809–848. doi:10.1124/pr.112.007278
27. Hirvensalo P, Tornio A, Launiainen T, et al. UGT1A3 and sex are major determinants of telmisartan pharmacokinetics-A comprehensive pharmacogenomic study. Clin Pharmacol Ther. 2020;108(4):885–895. doi:10.1002/cpt.1928
28. Chang C, Bahadduri PM, Polli JE, Swaan PW, Ekins S. Rapid identification of P-glycoprotein substrates and inhibitors. Drug Metab Dispos. 2006;34(12):1976–1984. doi:10.1124/dmd.106.012351
29. Dubbelman AC, Rosing H, Thijssen B, et al. Development and validation of LC-MS/MS assays for the quantification of E7080 and metabolites in various human biological matrices. J Chromatogr B Analyt Technol Biomed Life Sci. 2012;887-888:25–34. doi:10.1016/j.jchromb.2012.01.004
30. Ogawa-Morita T, Sano Y, Okano T, et al. Validation of a liquid chromatography-tandem mass spectrometric assay for quantitative analysis of lenvatinib in human plasma. Int J Anal Chem. 2017;2017:2341876. doi:10.1155/2017/2341876
31. Zanchetta M, Iacuzzi V, Posocco B, et al. A rapid, simple and sensitive LC-MS/MS method for lenvatinib quantification in human plasma for therapeutic drug monitoring. PLoS One. 2021;16(10):e0259137. doi:10.1371/journal.pone.0259137
32. Arifin WN, Zahiruddin WM. Sample size calculation in animal studies using resource equation approach. Malays J Med Sci. 2017;24(5):101–105. doi:10.21315/mjms2017.24.5.11
33. Deppe S, Böger RH, Weiss J, Benndorf RA. Telmisartan: a review of its pharmacodynamic and pharmacokinetic properties. Expert Opin Drug Metab Toxicol. 2010;6(7):863–871. doi:10.1517/17425255.2010.494597
34. Stangier J, Schmid J, Türck D, Switek H, Jonkman JHG. Absorption, metabolism, and excretion of intravenously and orally administered [14C]telmisartan in healthy volunteers. J Clin Pharmacolog. 2015;40(12 Pt 1):1312–1322. doi:10.1177/009127000004001202
35. Kataoka M. Dynamic analysis of pharmacokinetics of orally administered drugs using positron emission tomography. Yakugaku Zasshi. 2012;132(8):911–917. doi:10.1248/yakushi.132.911
36. Stangier J, Su CA, Hendriks MG, et al. The effect of telmisartan on the steady-state pharmacokinetics of digoxin in healthy male volunteers. J Clin Pharmacol. 2000;40(12 Pt 1):1373–1379. doi:10.1177/009127000004001209
37. Weiss J, Sauer A, Divac N, et al. Interaction of angiotensin receptor type 1 blockers with ATP-binding cassette transporters. Biopharm Drug Dispos. 2010;31(2–3):150–161. doi:10.1002/bdd.699
38. Miura M, Satoh S, Kagaya H, et al. Effect of telmisartan, valsartan and candesartan on mycophenolate mofetil pharmacokinetics in Japanese renal transplant recipients. J Clin Pharm Ther. 2009;34(6):683–692. doi:10.1111/j.1365-2710.2009.01053.x
39. Vasilyeva A, Durmus S, Li L, et al. Hepatocellular shuttling and recirculation of sorafenib-glucuronide is dependent on Abcc2, Abcc3, and Oatp1a/1b. Cancer Res. 2015;75(13):2729–2736. doi:10.1158/0008-5472.Can-15-0280
40. Yao J, Ning B, Ding J. The gut microbiota: an emerging modulator of drug resistance in hepatocellular carcinoma. Gut Microbes. 2025;17(1):2473504. doi:10.1080/19490976.2025.2473504
41. Ma S, Yi L, Bian Y, et al. Absorption, metabolism, and excretion of oral [(14)C] radiolabeled donafenib: an open-label, Phase I, single-dose study in humans. Cancer Chemother Pharmacol. 2024;95(1):5. doi:10.1007/s00280-024-04725-w
42. Vasilogianni AM, Al-Majdoub ZM, Achour B, Peters SA, Rostami-Hodjegan A, Barber J. Proteomics of colorectal cancer liver metastasis: a quantitative focus on drug elimination and pharmacodynamics effects. Br J Clin Pharmacol. 2022;88(4):1811–1823. doi:10.1111/bcp.15098
43. Cvan Trobec K, Kerec Kos M, Trontelj J, et al. Influence of cancer cachexia on drug liver metabolism and renal elimination in rats. J Cachexia Sarcopenia Muscle. 2015;6(1):45–52. doi:10.1002/jcsm.12012
 © 2025 The Author(s). This work is published and licensed by Dove Medical Press Limited. The
full terms of this license are available at https://www.dovepress.com/terms
and incorporate the Creative Commons Attribution
- Non Commercial (unported, 4.0) License.
By accessing the work you hereby accept the Terms. Non-commercial uses of the work are permitted
without any further permission from Dove Medical Press Limited, provided the work is properly
attributed. For permission for commercial use of this work, please see paragraphs 4.2 and 5 of our Terms.
© 2025 The Author(s). This work is published and licensed by Dove Medical Press Limited. The
full terms of this license are available at https://www.dovepress.com/terms
and incorporate the Creative Commons Attribution
- Non Commercial (unported, 4.0) License.
By accessing the work you hereby accept the Terms. Non-commercial uses of the work are permitted
without any further permission from Dove Medical Press Limited, provided the work is properly
attributed. For permission for commercial use of this work, please see paragraphs 4.2 and 5 of our Terms.