Back to Journals » Medical Devices: Evidence and Research » Volume 9
D3D augmented reality imaging system: proof of concept in mammography
Authors Douglas D, Petricoin E, Liotta L, Wilson E
Received 17 April 2016
Accepted for publication 9 June 2016
Published 9 August 2016 Volume 2016:9 Pages 277—283
DOI https://doi.org/10.2147/MDER.S110756
Checked for plagiarism Yes
Review by Single anonymous peer review
Peer reviewer comments 3
Editor who approved publication: Dr Scott Fraser
David B Douglas,1 Emanuel F Petricoin,2 Lance Liotta,2 Eugene Wilson3
1Department of Radiology, Stanford University, Palo Alto, CA, 2Center for Applied Proteomics and Molecular Medicine, George Mason University, Manassas, VA, 3Department of Radiology, Fort Benning, Columbus, GA, USA
Purpose: The purpose of this article is to present images from simulated breast microcalcifications and assess the pattern of the microcalcifications with a technical development called “depth 3-dimensional (D3D) augmented reality”.
Materials and methods: A computer, head display unit, joystick, D3D augmented reality software, and an in-house script of simulated data of breast microcalcifications in a ductal distribution were used. No patient data was used and no statistical analysis was performed.
Results: The D3D augmented reality system demonstrated stereoscopic depth perception by presenting a unique image to each eye, focal point convergence, head position tracking, 3D cursor, and joystick fly-through.
Conclusion: The D3D augmented reality imaging system offers image viewing with depth perception and focal point convergence. The D3D augmented reality system should be tested to determine its utility in clinical practice.
Keywords: augmented reality, 3D medical imaging, radiology, depth perception
Introduction
In recent years, the field of radiology has advanced from reviewing films on a view box to a digital era with viewing on a computer monitor. The digital environment has opened the doors to new image processing techniques that have capitalized on the three-dimensional (3D) datasets of computed tomography, magnetic resonance imaging (MRI), and positron emission tomography. For example, maximum intensity projection and volume rendering provide a two-dimensional representation of the 3D volume and can better define some complex anatomy; however, these techniques are limited by overlapping structures1,2 (Figure 1).
 | Figure 1 The 3D imaging volume (eg, computed tomography dataset) demonstrates a dark gray voxel and a light gray voxel. The 3D volume is projected to the left onto a maximum intensity projection image. Since both voxels project onto the same pixel on the 2D image, the voxel with the maximum intensity (light gray) is displayed. The dark gray voxel is hidden on the 2D image. Abbreviations: 2D, two-dimensional; 3D, three-dimensional; MIP, maximum intensity projection. |
In this paper, we will discuss several features of the depth 3-dimensional (D3D) augmented reality imaging system. The D3D user wears a headset, similar to that used in 3D gaming, which provides a separate image to each eye, yielding binocular disparity and depth perception.3 D3D also provides convergence of the eyes to a particular focal point of interest, tracks the individual’s natural head movements, and provides corresponding images to each eye’s display; thus, an immerse environment is established. The D3D algorithm provides an enhanced discrimination of separated points in space that might otherwise appear to overlap when viewed by conventional methods. D3D’s enhanced visualization is accompanied by a joystick control system, similar to that of a pilot such that the radiologist can fly through the image while selecting objects of interest with a 3D cursor.
While D3D technology can be applied to multiple types of radiological imaging, the specific focus in the article will be related to viewing of microcalcifications in mammography. Breast cancer is one of the leading causes of death in women.4,5 Mammography can detect suspicious microcalcifications associated with preinvasive or invasive cancers.6 While breast calcifications are extremely common, and can be present in up to 86% of mammograms,7 a minority of calcifications biopsied tend to be preinvasive or invasive cancers in asymptomatic patients. Calcifications are often classified according to location, morphology, and distribution. A linear and branching distribution of microcalcifications is suspicious for ductal carcinoma in situ (DCIS).8,9 Standard mammographic views may not reveal the true linear and branching distribution due to a suboptimal viewpoint. From the wrong viewpoint, a linear distribution of calcifications can appear as an amorphous aggregate, leading to false negatives. On the other hand, depending on the angle of view, a cluster of calcifications can be wrongly interpreted to follow a linear pattern, causing false positives. Consequently, full 3D viewing of a group of calcifications has the potential advantage of reducing both false negatives and false positives. To test this hypothesis, in the present study, we generated image sets from a simulated dataset of microcalcifications and evaluated the discrimination of a branched or linear pattern when viewed with D3D.
Materials and methods
Subjects
No subjects were used in this study.
Procedures
A simulated 3D dataset of microcalcifications in a linear, branching pattern was created using a total of 34 voxels in a 64×64×64 matrix by an in-house script, with each microcalcification being of the same size. Using a Cartesian coordinate system, the simulated 3D dataset was uploaded such that each microcalcification was assigned to a unique (x, y, z) voxel within the volume of interest and a total of 262,144 (643) voxels were created of which 34 were assigned the value of “1” to represent calcification displayed as a white pixel. All other voxels within the volume of interest were assigned the value of “0” to represent noncalcified tissue. An initial left eye viewing perspective was assigned an (x, y, z) position outside the volume of interest. From the left eye viewing perspective, a series of cones, each being defined by the cone angle θ and the trajectory angles α and β, were sent into the volume of interest to record the highest voxel in its path, either a “0” or a “1” (Figure 2). A similar process was performed for the right eye viewing perspective. Finally, the values recorded for each cone were displayed in the head display unit with a unique image sent to each eye such that binocular disparity and depth perception are achieved (Figure 3). The number of cones for each eye viewing perspective is determined by factors including: size of the pixel array in the head display unit, acceptable latency time for the user, and the computer processor speed. After the initial left and right eye images are established (Figure 4A), a new image is provided to each eye display each time any of the following occurs: changing the interocular distance to provide greater binocular disparity (Figure 4B); changing the angular field of view (Figure 4C); volume of interest is translated or rotated (Figure 4D); user rotates their head with roll, pitch, or yaw maneuvers, by translation or combination thereof (Figure 4E).
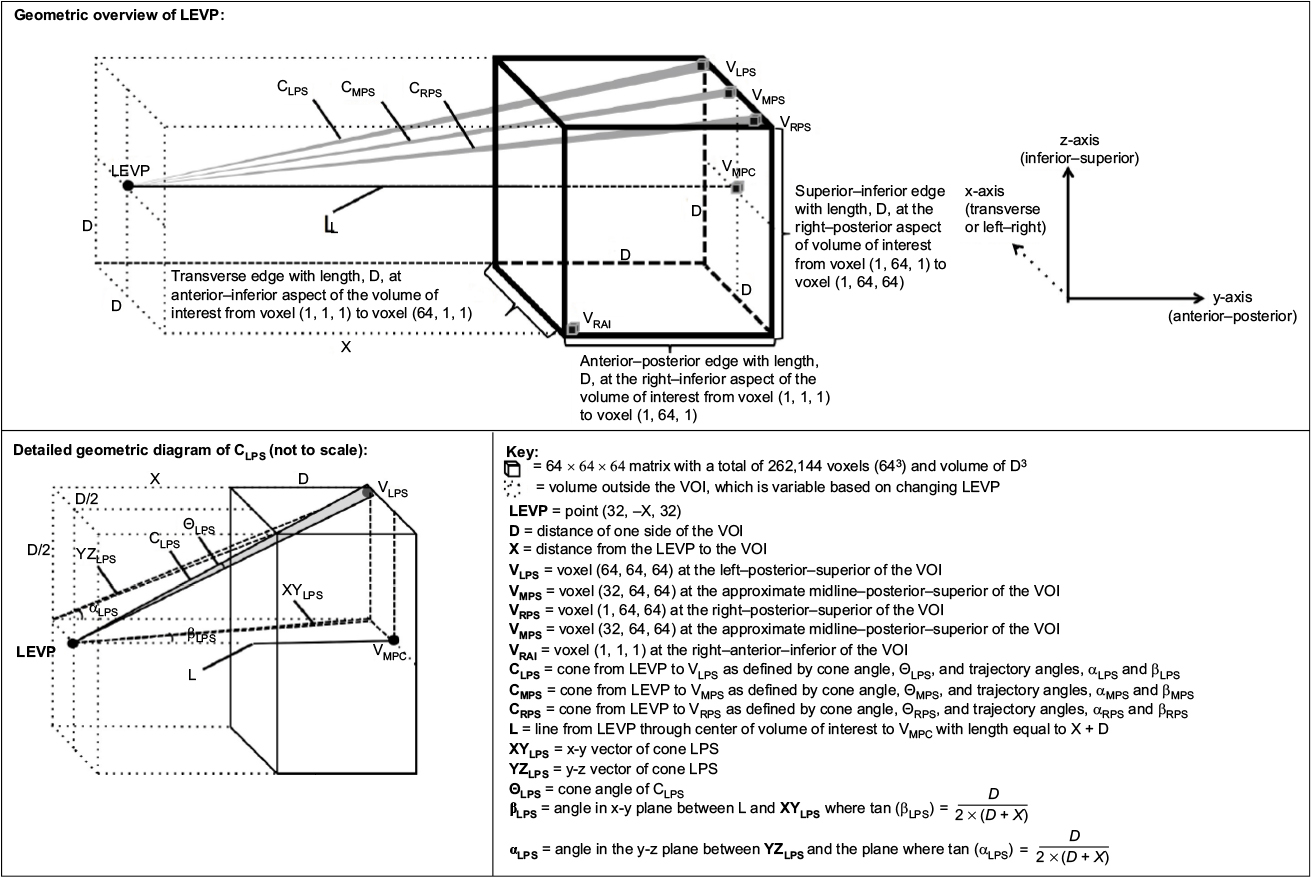 | Figure 2 Overview of the geometry of the D3D processing system for the LEVP. Abbreviations: D3D, depth 3-dimensional; LEVP, left eye viewing perspective; VOI, volume of interest. |
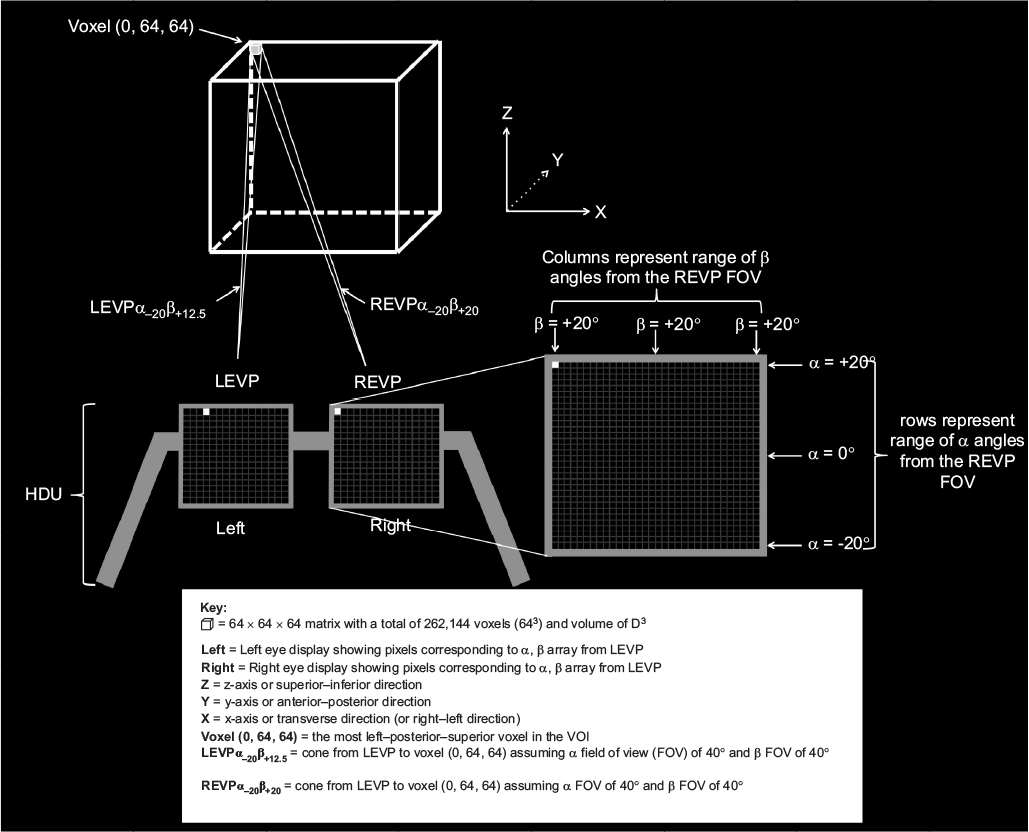 | Figure 3 Illustrates the correlation between the angles from the viewing perspective and the pixels in the HDU. A sample voxel (0, 64, 64) is shown. Note that the angles α and β from the LEVP to voxel (0, 64, 64) differ from the α and β angles from the REVP to the same voxel (0, 64, 64). Thus, the images to the left and right eyes will be different and true stereoscopic depth perception will be achieved. Abbreviations: FOV, field of view; HDU, head display unit; LEVP, left eye viewing perspective; REVP, right eye viewing perspective; VOI, volume of interest. |
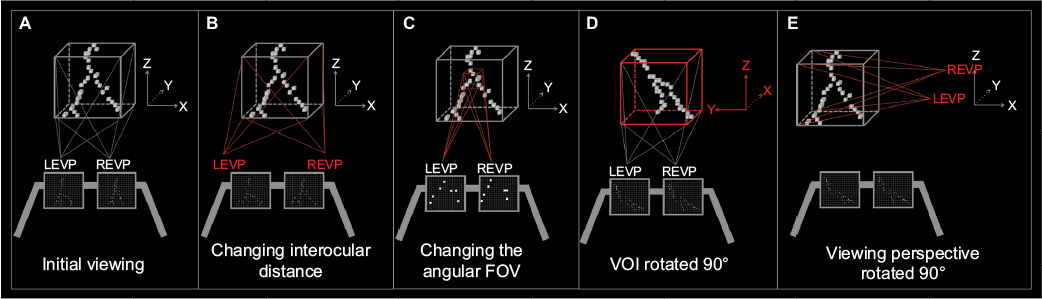 | Figure 4 Examples of viewing options with the D3D Technology Notes: (A) Initial viewing angle into the volume of interest. (B) Illustrates increasing the interocular distance, which provides for increased binocular disparity. (C) Illustrates changing of the angular FOV, so rather than an α FOV of 40°, it changes to an α FOV of 10° and rather than a β FOV of 40°, it changes to a β FOV of 10°. This serves to focus on a particular region within the volume. (D) Illustrates rotation of the VOI, so that the radiologist can have a different viewing perspective. (E) Illustrates rotation of the viewing perspective, which is similar to the radiologist turning the head to see new features of the image, allowing for improved HMI. Note that in (A–E), the center pixels (ie, α=0° and β=0°) for both LEVP and REVP converge at the center of the VOI (ie, voxel [32, 32, 32]), such that the VOI is optimally presented to the user. Abbreviations: FOV, field of view; HMI, human machine interface; LEVP, left eye viewing perspective; REVP, right eye viewing perspective; VOI, volume of interest. |
Terms and measures
Depth perception is the ability to distinguish the relative distance of an object in one’s visual field. Depth perception requires binocular disparity, which is the difference in image location seen by the left and right eyes.
Data collection
The simulated data were viewed with the D3D system by the author (EW), who is a board-certified radiologist with 11 years of experience in evaluating the distribution of the microcalcifications. Using simulated data allows one to visualize differing orientations and gain an appreciation of the importance of 3D visualization from multiple viewing points in obtaining an accurate diagnosis.
Statistical tests
No statistical tests were performed.
Results
When the author visualized the microcalcifications with a single viewing perspective, the microcalcifications were classified as a cluster, which is indeterminate for cancer (Figure 5A). When the author visualized the microcalcifications with D3D, the system was rotated and the microcalcifications were classified as a linear pattern (Figure 5B), which is suspicious for breast cancer. Finally, the image was rotated further and the microcalcifications were classified as a branching pattern, which is highly suspicious for DCIS breast cancer (Figure 5C).
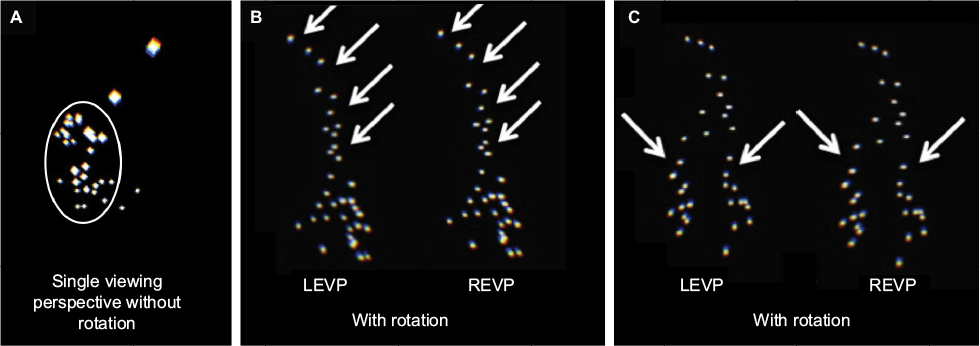 | Figure 5 Simulated breast microcalcifications as white dots on a black background viewed using the D3D system. Notes: The microcalcifications are shown in (A), (B), and (C), but in different projections. (A) Initial single projection viewed by the radiologist (EW) was thought to represent a cluster as indicated by the circle. Note that some of the dots are bigger, which is due to the fact that they are closer to the viewing perspective and the calcifications subtend a larger angular resolution from the viewing perspective. (B) The cluster is now rotated and viewed with both an LEVP and an REVP. The top portion (arrows) was thought to represent a linear pattern by the radiologist (EW) with the linear portion indicated by the arrows. (C) Same cluster as (A) and (B), but now rotated once again. The bottom portion (arrows) was thought to represent a branching pattern by the radiologist (EW), where two branches originate at the bottom of the image as indicated by the arrows. In retrospect, the viewing perspective (A) was closest to the top of the microcalcifications as if one were looking down on linear, branching pattern seen from the side view on (B) and (C). Abbreviations: D3D, depth 3-dimensional; LEVP, left eye viewing perspective; REVP, right eye viewing perspective. |
Discussion
The D3D’s augmented reality imaging technique is an extremely computationally demanding process that is operated only through the recent advances in computer processing and head display unit technology. Using a simulated image, D3D achieves a higher level of convergence and improved human machine interface (HMI) to discriminate linear or branching calcifications.
While conventional two-view mammography cannot assign microcalcifications to a specific 3D coordinate system, digital breast tomosynthesis and dedicated breast computed tomography are able to provide 3D spatial localization; thus, D3D can only be used for these types of breast imaging.10–15 D3D suggests that the preferred method of looking at calcifications is a fly-through such that the radiologist can better appreciate the 3D pattern. DCIS can be multifocal, with regional variation in the histologic grade that predicts the risk for progression to invasive cancer. Therefore, it is crucial to identify and treat all areas of DCIS for the best possible outcome. Whether viewing with contiguous slices or volume rendering, characterizing the 3D pattern of microcalcifications can be extremely difficult because there is no depth perception and no convergence of the viewing perspectives to a focal point. D3D provides an immersive fly-through perspective such that a 3D map of the suspicious microcalcifications can be drawn and highlighted.
Beyond improving the display of microcalcifications, D3D holds promise for enhanced visualization and discrimination of malignant breast masses within a dense breast or behind areas of benign pathology or previous surgery. In addition, D3D can give the viewer the ability to “fly-around” a breast mass and highlight the change in the shape or volume of the mass before and after therapy, by comparing the current mass to a 3D “ghost” of the mass recalled from a pretreatment baseline. This can provide a new class of information for evaluating the effectiveness of therapy.
There is strong rationale to support the value of dynamic 3D view of a tumor mass throughout the course of therapy. While the efficacy of neoadjuvant chemotherapy (NACT) in advanced breast cancer is known to correlate to tumor shrinkage,16 data from the recent Investigation of Serial Studies to Predict Your Therapeutic Response With Imaging and Molecular Analysis (I-SPY) trial demonstrated the importance in breast tumor morphology. In this study, the particular phenotype of the breast tumor, such as “well-defined” margins or “multilobulated” appearance, correlated with the pathologic response to NACT and contributed to the clinical recommendation for breast conservation therapy instead of mastectomy.17 In fact, the MRI findings were a better predictor of pathological response to NACT compared with clinical assessment.18 In addition to enhanced visualization of the changing 3D morphology of the tumor, D3D can also help make an accurate volume and shape comparison of the tumor at two or more time points as a quantitative measure of effectiveness of NACT. In the current practice, shifts in patient position from scan to scan can change the position and orientation of a breast tumor, which obscures subtle differences between treatment cycles. D3D can register the image to a 3D grid that is tied to an anatomic reference point. Proper position and orientation of the ghost images representing prior states of the mass can permit color-coding of the regions of the tumor that are expanding or shrinking with an automatic calculation of the volume of change.
In addition to mammography, the D3D’s augmented reality technique can be applied to many of the radiological subspecialties. In neuroradiology, characterization of a cerebral aneurysm’s morphology, orientation, neck, and relationship to other vessels is extremely important in both follow-up and in surgical planning. D3D can facilitate understanding the interrelationship of comminuted fracture fragments to guide surgery and to accurately orient the placement of prosthetic joints. In pulmonary imaging, the depth perception by D3D may help to better identify, characterize, and follow-up pulmonary nodules. In virtual colonoscopy, the improved HMI may speed up the examination and offer improved lesion detection. For all of these applications, and others to be conceived, the fact that D3D technology can input conventional digital radiologic images will permit thorough and rapid side-by-side comparison with the current standards.
New radiological advances such as additional MRI sequences, new contrast agents, and thinner imaging planes are expanding the information presented to the radiologist. It is becoming impractical for the radiologist to scroll through hundreds of slices to evaluate each item on the checklist. There is a growing need to optimize presentation of radiological images in a practical manner, whereby the radiologist can view the whole volume of data at once. Not only does D3D of the future offer such an improved visual display, but also it will provide nonvisual sensory information to the user, including auditory and tactile feedback. For example, MR elastography provides information on the stiffness of tissue and D3D’s augmented reality presents this as a tactile response to the stiffness by a glove. D3D’s augmented reality provides new opportunity for enhanced visualization and improved HMI, creating the potential for improved diagnosis and response to therapy.
Conclusion
D3D is an augmented reality medical imaging system that provides stereoscopic 3D imaging with binocular disparity. This generates depth perception, focal point convergence, and head tracking. Furthermore, D3D provides HMI in the form of a gaming joystick to “fly inside” the image and view the 3D lesion from any angle. We have illustrated, using a simulated dataset of breast microcalcifications, how the D3D system can reveal a linear branching morphology that would have otherwise been invisible under conventional imaging. Future testing of the D3D should be performed to determine the utility of the system in mammography and other radiological subspecialties.
Disclosure
DBD has a family member with a financial interest. EFP and LL have a financial interest. The authors report no other conflicts of interest in this work.
References
Fishman EK, Ney DR, Heath DG, Corl FM, Horton KM, Johnson PT. Volume rendering versus maximum intensity projection in CT angiography: what works best, when, and why. Radiographics. 2006;26(3):905–922. | ||
Johnson PT, Heath DG, Kuszyk BS, Fishman EK. CT angiography with volume rendering: advantages and applications in splanchnic vascular imaging. Radiology. 1996;200(2):564–568. | ||
Douglas D, Inventor; US Patent Office, assignee. Method and apparatus for three dimensional viewing of images. 2013. | ||
Ferlay J, Shin HR, Bray F, Forman D, Mathers C, Parkin DM. Estimates of worldwide burden of cancer in 2008: GLOBOCAN 2008. Int J Cancer. 2010;127(12):2893–2917. | ||
DeSantis C, Ma J, Bryan L, Jemal A. Breast cancer statistics, 2013. CA Cancer J Clin. 2014;64(1):52–62. | ||
Howell A. The emerging breast cancer epidemic: early diagnosis and treatment. Breast Cancer Res. 2010;12 (Suppl 4):S10. | ||
Kopans D. Analyzing the Mammogram – Calcifications. Philadelphia, PA: Lippincott-Raven; 1998. | ||
Lee KS, Han BH, Chun YK, Kim HS, Kim EE. Correlation between mammographic manifestations and averaged histopathologic nuclear grade using prognosis-predict scoring system for the prognosis of ductal carcinoma in situ. Clin Imaging. 1999;23(6):339–346. | ||
Burnside ES, Ochsner JE, Fowler KJ, et al. Use of microcalcification descriptors in BI-RADS 4th edition to stratify risk of malignancy. Radiology. 2007;242(2):388–395. | ||
Park JM, Franken EA Jr, Garg M, Fajardo LL, Niklason LT. Breast tomosynthesis: present considerations and future applications. Radiographics. 2007;27 (Suppl 1):S231–S240. | ||
Bernardi D, Ciatto S, Pellegrini M, et al. Application of breast tomosynthesis in screening: incremental effect on mammography acquisition and reading time. Br J Radiol. 2012;85(1020):e1174–e1178. | ||
Ho CP, Tromans C, Schnabel JA, Brady M. Classification of clusters of microcalcifications in digital breast tomosynthesis. Conf Proc IEEE Eng Med Biol Soc. 2010;2010:3166–3169. | ||
Gazi PM, Yang K, Burkett GW Jr, Aminololama-Shakeri S, Seibert JA, Boone JM. Evolution of spatial resolution in breast CT at UC Davis. Med Phys. 2015;42(4):1973–1981. | ||
Willekens I, Van de Casteele E, Buls N, et al. High-resolution 3D micro-CT imaging of breast microcalcifications: a preliminary analysis. BMC Cancer. 2014;14:9. | ||
Yang K, Burkett G, Boone JM. A breast-specific, negligible-dose scatter correction technique for dedicated cone-beam breast CT: a physics-based approach to improve Hounsfield Unit accuracy. Phys Med Biol. 2014;59(21):6487–6505. | ||
Khokher S, Qureshi MU, Chaudhry NA. Comparison of WHO and RECIST criteria for evaluation of clinical response to chemotherapy in patients with advanced breast cancer. Asian Pac J Cancer Prev. 2012;13(7):3213–3218. | ||
Mukhtar RA, Yau C, Rosen M, Tandon VJ, I-SPY 1 TRIAL and ACRIN 6657 Investigators, Hylton N, Esserman LJ. Clinically meaningful tumor reduction rates vary by prechemotherapy MRI phenotype and tumor subtype in the I-SPY 1 TRIAL (CALGB 150007/150012; ACRIN 6657). Ann Surg Oncol. 2013;20(12):3823–3830. | ||
Hylton NM, Blume JD, Bernreuter WK, et al. Locally advanced breast cancer: MR imaging for prediction of response to neoadjuvant chemotherapy – results from ACRIN 6657/I-SPY TRIAL. Radiology. 2012;263(3):663–672. |
 © 2016 The Author(s). This work is published and licensed by Dove Medical Press Limited. The
full terms of this license are available at https://www.dovepress.com/terms
and incorporate the Creative Commons Attribution
- Non Commercial (unported, 3.0) License.
By accessing the work you hereby accept the Terms. Non-commercial uses of the work are permitted
without any further permission from Dove Medical Press Limited, provided the work is properly
attributed. For permission for commercial use of this work, please see paragraphs 4.2 and 5 of our Terms.
© 2016 The Author(s). This work is published and licensed by Dove Medical Press Limited. The
full terms of this license are available at https://www.dovepress.com/terms
and incorporate the Creative Commons Attribution
- Non Commercial (unported, 3.0) License.
By accessing the work you hereby accept the Terms. Non-commercial uses of the work are permitted
without any further permission from Dove Medical Press Limited, provided the work is properly
attributed. For permission for commercial use of this work, please see paragraphs 4.2 and 5 of our Terms.