Back to Journals » Clinical Interventions in Aging » Volume 16
Cut-off Values for Lower Limb Muscle Thickness to Detect Low Muscle Mass for Sarcopenia in Older Adults
Authors Fukumoto Y ![]() , Ikezoe T, Taniguchi M, Yamada Y
, Ikezoe T, Taniguchi M, Yamada Y ![]() , Sawano S, Minani S, Asai T, Kimura M, Ichihashi N
, Sawano S, Minani S, Asai T, Kimura M, Ichihashi N ![]()
Received 2 February 2021
Accepted for publication 4 June 2021
Published 25 June 2021 Volume 2021:16 Pages 1215—1222
DOI https://doi.org/10.2147/CIA.S304972
Checked for plagiarism Yes
Review by Single anonymous peer review
Peer reviewer comments 3
Editor who approved publication: Prof. Dr. Nandu Goswami
Yoshihiro Fukumoto,1,2 Tome Ikezoe,2 Masashi Taniguchi,2 Yosuke Yamada,3 Shinichiro Sawano,4 Seigo Minani,5 Tsuyoshi Asai,6 Misaka Kimura,7,8 Noriaki Ichihashi2
1Department of Physical Medicine and Rehabilitation, Kansai Medical University, Hirakata, Japan; 2Human Health Sciences, Graduate School of Medicine, Kyoto University, Kyoto, Japan; 3National Institute of Health and Nutrition, National Institutes of Biomedical Innovation, Health and Nutrition, Tokyo, Japan; 4Rehabilitation Units, Shiga University of Medical Science Hospital, Otsu, Japan; 5Faculty of Rehabilitation, Osaka Kawasaki Rehabilitation University, Kaizuka, Japan; 6Faculty of Rehabilitation, Kobe Gakuin University, Kobe, Japan; 7Institute for Active Health, Kyoto University of Advanced Science, Kameoka, Japan; 8Graduate School of Nursing, Doshisha Women’s College of Liberal Arts, Kyotanabe, Japan
Correspondence: Yoshihiro Fukumoto
Department of Physical Medicine and Rehabilitation, Kansai Medical University, 2-5-1 Shin-Machi, Hirakata City, Osaka, Osaka, Japan
Tel +81-72-856-2307
Fax +81-72-856-2150
Email [email protected]
Purpose: Ultrasound-based prediction methods for the detection of low muscle mass for sarcopenia in older adults have been explored previously; however, the muscle that most accurately predicts it is unclear. This study aimed to clarify prediction accuracy and cut-off values for ultrasound-derived thigh and lower leg muscle thickness (MT) to detect low skeletal muscle mass index (SMI) in older adults and to estimate cut-off values based on two standard deviations (SD) below younger adult means for the corresponding muscles as an early detection tool for site-specific low muscle mass.
Methods: This study included 204 community-dwelling older (64 males, 140 females, mean age: 75.4 years) and 59 younger (31 males, 28 females, mean age: 22.3 years) adults. The MT of the rectus femoris, vastus intermedius, gastrocnemius, and soleus muscles was measured using ultrasound; SMI was measured using bioelectrical impedance analysis.
Results: The prevalence of a low SMI among older adults was 20.3% (n=13) for males and 21.4% (n=30) for females. The receiver operating characteristic analysis revealed that the total MT for the four muscles measured presented the highest area under the curve (AUC) value to predict low SMI for males (0.849) and females (0.776). The AUC value was the highest for the total MT of the gastrocnemius and soleus muscles for males and the gastrocnemius for females (0.836, 0.748; cut-off value: 5.67 cm, 1.42 cm, respectively). Muscle-specific differences between the low SMI-predicting and SD-based cut-off values were observed. The SD-based value for the rectus femoris (1.85 cm) was substantially higher than the low SMI-predicting value (1.51 cm) in males.
Conclusion: Ultrasound measurement of lower leg muscles may be a simple, robust measure to detect low muscle mass for sarcopenia. Additionally, cut-off values for site-specific muscle mass loss may not always agree with those for whole-limb muscle mass loss.
Keywords: area under the curve, bioelectric impedance, skeletal muscle, ultrasound
Introduction
Sarcopenia is characterized by low muscle strength, low muscle quantity/quality, and low physical performance,1 and is an increasingly prevalent problem in countries with an aging population, such as Japan. It is associated with adverse outcomes such as mortality, functional decline, a higher rate of falls, and a higher incidence of hospitalization.2 To prevent such outcomes, the early detection of sarcopenia is essential. Muscle mass (quantity) measurement is essential for diagnosing sarcopenia. For this, many global consensus statements for sarcopenia, including the Asian Working Group for Sarcopenia (AWGS), consider dual-energy X-ray absorptiometry (DXA) and bioelectrical impedance analysis (BIA) as the standard methods, and proposed cut-off values for low muscle mass.3,4
Ultrasound is a non-invasive, inexpensive, and portable method for assessing muscle size with the advantage of assessing an individual muscle. This cannot be achieved through DXA or BIA and allows the ultrasound to detect differences in loss of muscle size among muscles that are aging,5–7 diseased,8–10 or with skeletal disorders.11,12 Ultrasound-derived values of muscle thickness (MT) and cross-sectional area have been validated using magnetic resonance imaging (MRI), computed tomography (CT), and DXA.13 Therefore, ultrasound is now widely used for muscle assessments in clinical settings, communities, and research facilities. Recently, several studies explored the ultrasound-based prediction method for detecting low muscle mass in the diagnosis of sarcopenia in older adults.14–16 These studies proposed ultrasound-measured cut-off values of the thigh or lower leg muscles for predicting BIA-derived low skeletal muscle mass index (SMI). However, no study has evaluated the difference between the prediction accuracy of these cut-off values among leg muscles. Identifying the muscles that can predict low SMI accurately is important for the establishment of an ultrasound-based detection method for sarcopenia.
The definition of low muscle mass for sarcopenia using measurement techniques such as MRI, CT, DXA, and BIA is based on the muscle mass that is two standard deviations (SD) below the normal value of healthy young adults.1 Cut-off values of ultrasound-derived MT based on 2 SD below the younger adult mean values (SD-based cut-off values) of the corresponding muscles allow for the evaluation of the muscle mass of individual muscles in older adults. When SD-based cut-off values are applied, the prevalence of low muscle mass in older adults widely differs between muscles because the extent of age-related muscle size loss is site-specific.5–7 Thus, SD-based cut-off values could be a useful tool for the early detection of site-specific low muscle mass,17,18 which cannot be detected based on SMI-based cut-off values. Establishing SD-based cut-off values would not only predict low SMI but also provide valuable information for the ultrasound-based detection of both site-specific and whole-limb muscle loss of mass for sarcopenia in older adults.
This study aimed to clarify the prediction accuracy and cut-off values to detect low SMI for sarcopenia using ultrasound-derived thigh and lower leg MT in older adults, and to estimate the SD-based cut-off values for the MT of the thigh and lower leg based on values 2 SD below the young means. We hypothesized that the sum of the MT of several muscles represented SMI more accurately than the MT of a single muscle.
Materials and Methods
Participants
In this cross-sectional study, we recruited older (>60 years) and younger (20–39 years) adults who lived independently in the community. Older adults were recruited from those who participated in the annual free routine physical fitness test conducted in Kyoto.19 Younger adults were university students, graduate students, and researchers recruited from Kobe Gakuin University and Kyoto University. Participants who could not walk with or without a walking aid or had a severe neurological disorder, severe musculoskeletal disorder, cognitive dysfunction (judged by medical professions through communication during recruitment and while obtaining informed consent), or pacemaker implantation were excluded. Finally, 204 older (64 males, 140 females, mean age: 75.4 ± 5.6 years) and 59 younger (31 males, 28 females, mean age: 22.3 ± 2.8 years) adults were enrolled. Height (cm) and weight (kg) were obtained on physical examination, and body mass index (BMI, kg/m2) was calculated. The sample size was estimated for the receiver operating characteristic (ROC) analysis, with an area under the ROC curve (AUC) value of 0.7 or 0.8, an α error of 0.05, power of 0.9, and a prevalence of low SMI of 20%. The required sample size was estimated at 105 participants with an AUC value of 0.7, and was 45 participants with an AUC value of 0.8. The study protocol was approved by the Research Ethics Committee of Kobe Gakuin University (Approval No. HEB20160114-1). All participants provided written informed consent before participation. The study was conducted in accordance with the provisions of the Declaration of Helsinki.
Ultrasound Measurements
Ultrasound imaging was performed by a single assessor using a real-time B-mode ultrasound device (LOGIQ e, GE Healthcare UK, Chalfont, Buckinghamshire, UK) with a multifrequency linear probe (8–12 MHz). Participants were in a sitting position with 90° flexion at the hip and knee joints and their feet in contact with the ground. They were asked to relax during imaging. As the MT of the quadriceps femoris (QF) differed when the thighs of the participants were in contact with the chair (23% increase in thickness), only the buttocks were allowed to contact the chair in the sitting position.20 Transverse images of the QF and triceps surae (TS) on the right limb were obtained. For imaging the QF, the transducer was placed at the largest diameter of the rectus femoris (RF), determined as the mid-point of the distance from the greater trochanter to the lateral condyle of the femur. For imaging the TS, the transducer was placed at the largest diameter of the medial head of the gastrocnemius (GM), determined as 30% proximal of the distance from the lateral knee joint space to the lateral malleolus of the fibula. At each anatomical site, the transducer was positioned perpendicular to the longitudinal axis, without depressing the skin. The MT (cm) of the RF, vastus intermedius (VI), GM, and soleus (Sol) was measured using frozen images with an electric caliper. The MT of the RF and GM was defined as the distance between the superficial and deep fascia of the muscle and that of the VI and Sol was defined as the distance between the superficial fascia of the muscle and the upper margin of the femur or fibula, respectively. The MT of the QF was calculated by summing the MT of the RF and VI, and the MT of the TS was calculated by summing the MT of the GM and Sol. Furthermore, the MT of the QF and TS was summed and defined as the MT sum. To confirm the reliability of the ultrasound measurements, images of each muscle were obtained on two different days for eight younger participants, prior to other measurements, and intraclass correlation coefficients (ICC) were calculated. The ICC values for MT were 0.958, 0.871, 0.898, and 0.915 for RF, VI, GM, and Sol, respectively, suggesting an “almost perfect” reliability.21
Muscle Mass Estimations
Muscle mass was estimated using a multifrequency BIA instrument (Body Composition Analyzer MC-780A-N, TANITA, Tokyo, Japan). This system measures bioelectrical impedance (Z) at 5, 50, and 250 kHz (Z5, Z50, and Z250, respectively) using 8-electrodes in the standing position.22 Participants removed all metallic objects on their person, such as rings or earrings, and after 3–5 min resting periods in the sitting position, they stood barefoot on the toe and heel electrodes and held the handgrips with arms hanging low. The muscle masses (kg) of the upper and lower limbs on both sides were summed and divided by height squared (m2) to calculate SMI (kg/m2). A low SMI was defined according to the AWGS criteria,3 with reference values of 7.0 kg/m2 for males and 5.7 kg/m2 for females.
Statistical Analyses
All statistical analyses were performed using SPSS software version 22.0 for Windows (SPSS Inc., Tokyo, Japan). Differences in physical characteristics and MT between younger and older adults, and differences between low SMI and normal SMI in older adults were examined using the unpaired t-test. Two estimations for cut-off values of MT for low muscle mass were considered. One estimation for cut-off values was based on prediction for BIA-derived low SMI. Through the ROC analysis, cut-off values of MT, which predict low SMI, were estimated in older adults, and performance of the ROC analysis was evaluated with the AUC. Another estimation for cut-off values was calculated as 2 SD below the mean MT of the corresponding muscle in younger adults. The prevalence of low muscle mass for each MT in older adults was obtained using the corresponding SD-based cut-off value. A P value of <0.05 was considered significant.
Results
Among older adults, two males and one female could not be examined for MT of the RF, VI, and QF, and two males could not be examined for the MT of the GM, Sol, and TS because of failure to store ultrasound images. Hence, these four males and one female could not be examined for the MT sum.
Table 1 shows the characteristics of the younger and older adults. The height, weight, and SMI of older adults were significantly less than those of younger adults for both sexes (p<0.05). The MT of all muscles other than the Sol of older adults was significantly thinner than that of younger adults for both sexes (p<0.001).
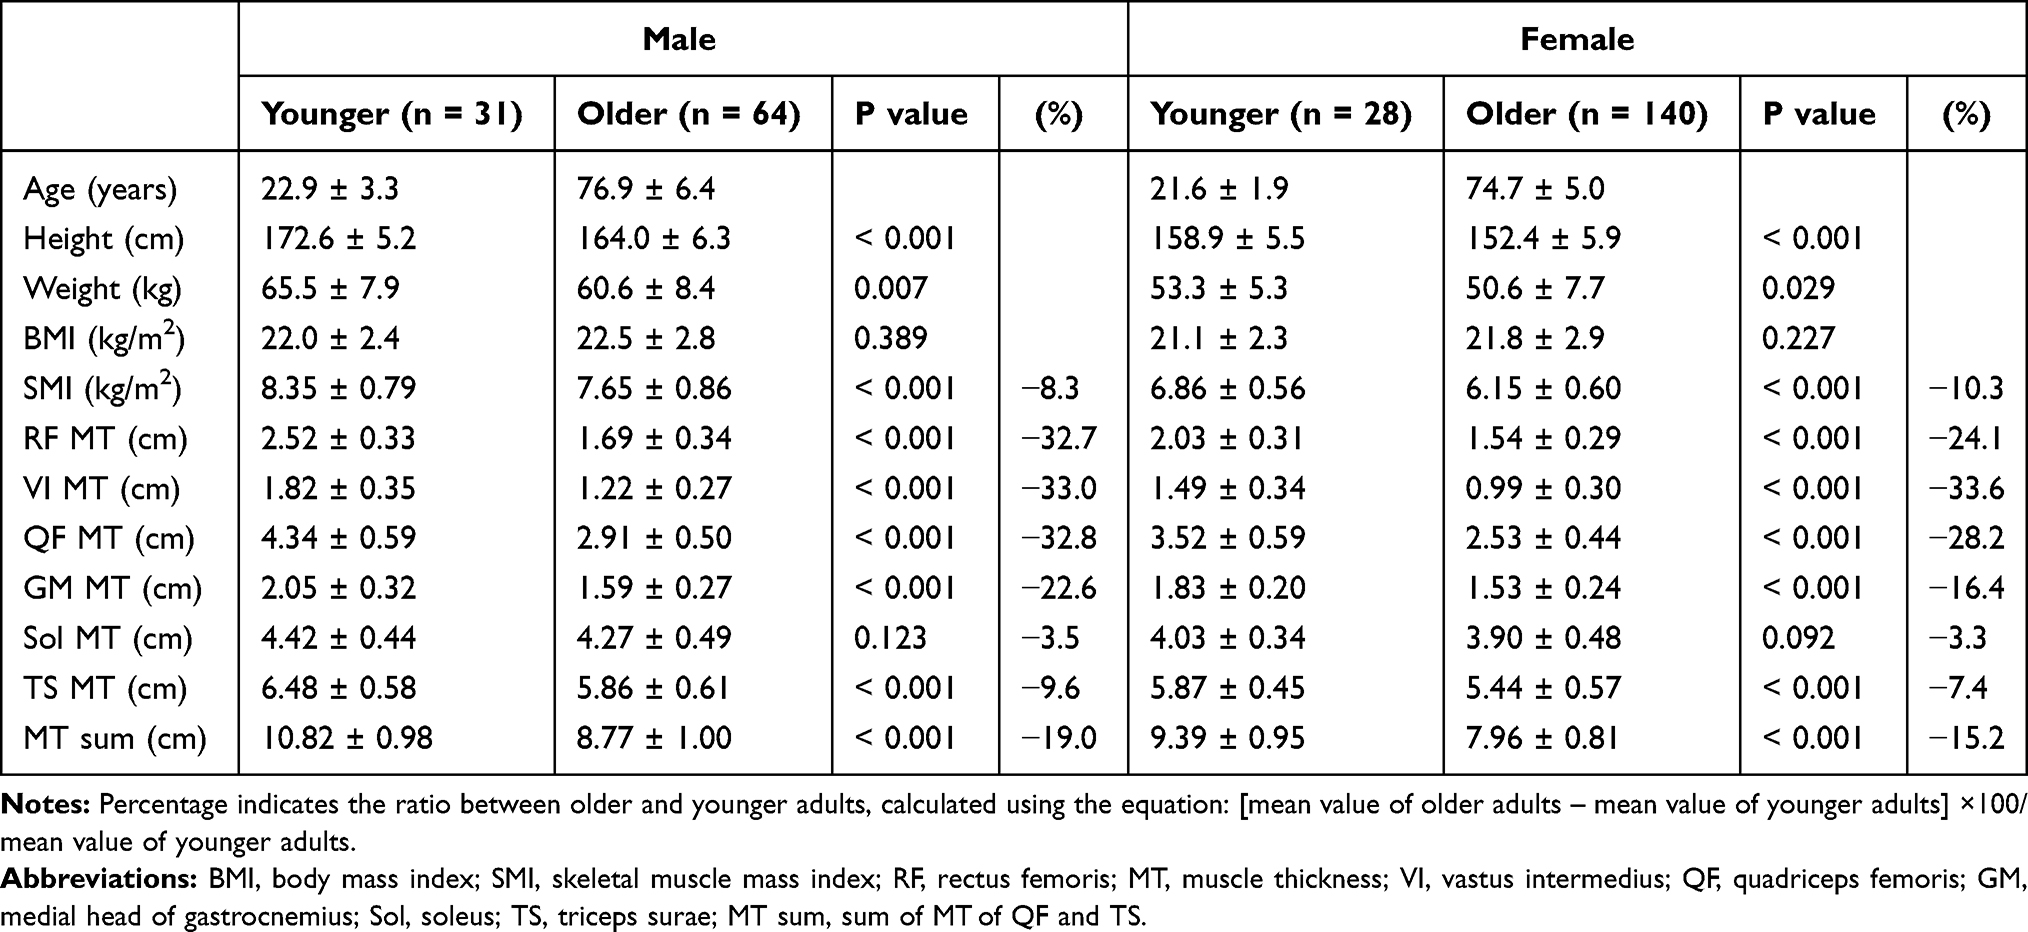 |
Table 1 Characteristics of Study Participants |
The prevalence of a low SMI among older adults was 20.3% (n=13) for males and 21.4% (n=30) for females. Table 2 shows the difference in older adults with low and normal SMI and the results of the ROC analyses to predict low SMI. The weight, BMI, SMI, and MT of all muscles measured in older adults with a low SMI were significantly lower than those in older adults with a normal SMI (p<0.05) for both sexes. Females with a low SMI were significantly older than those with a normal SMI (p=0.049). ROC analyses revealed significant associations between low SMI and MT measurements, except for the MT of the VI in males. For males, the AUC value was the highest in the MT sum followed by the MT of the TS, and for females, it was the highest in the MT sum followed by the MT of the GM (Figure 1).
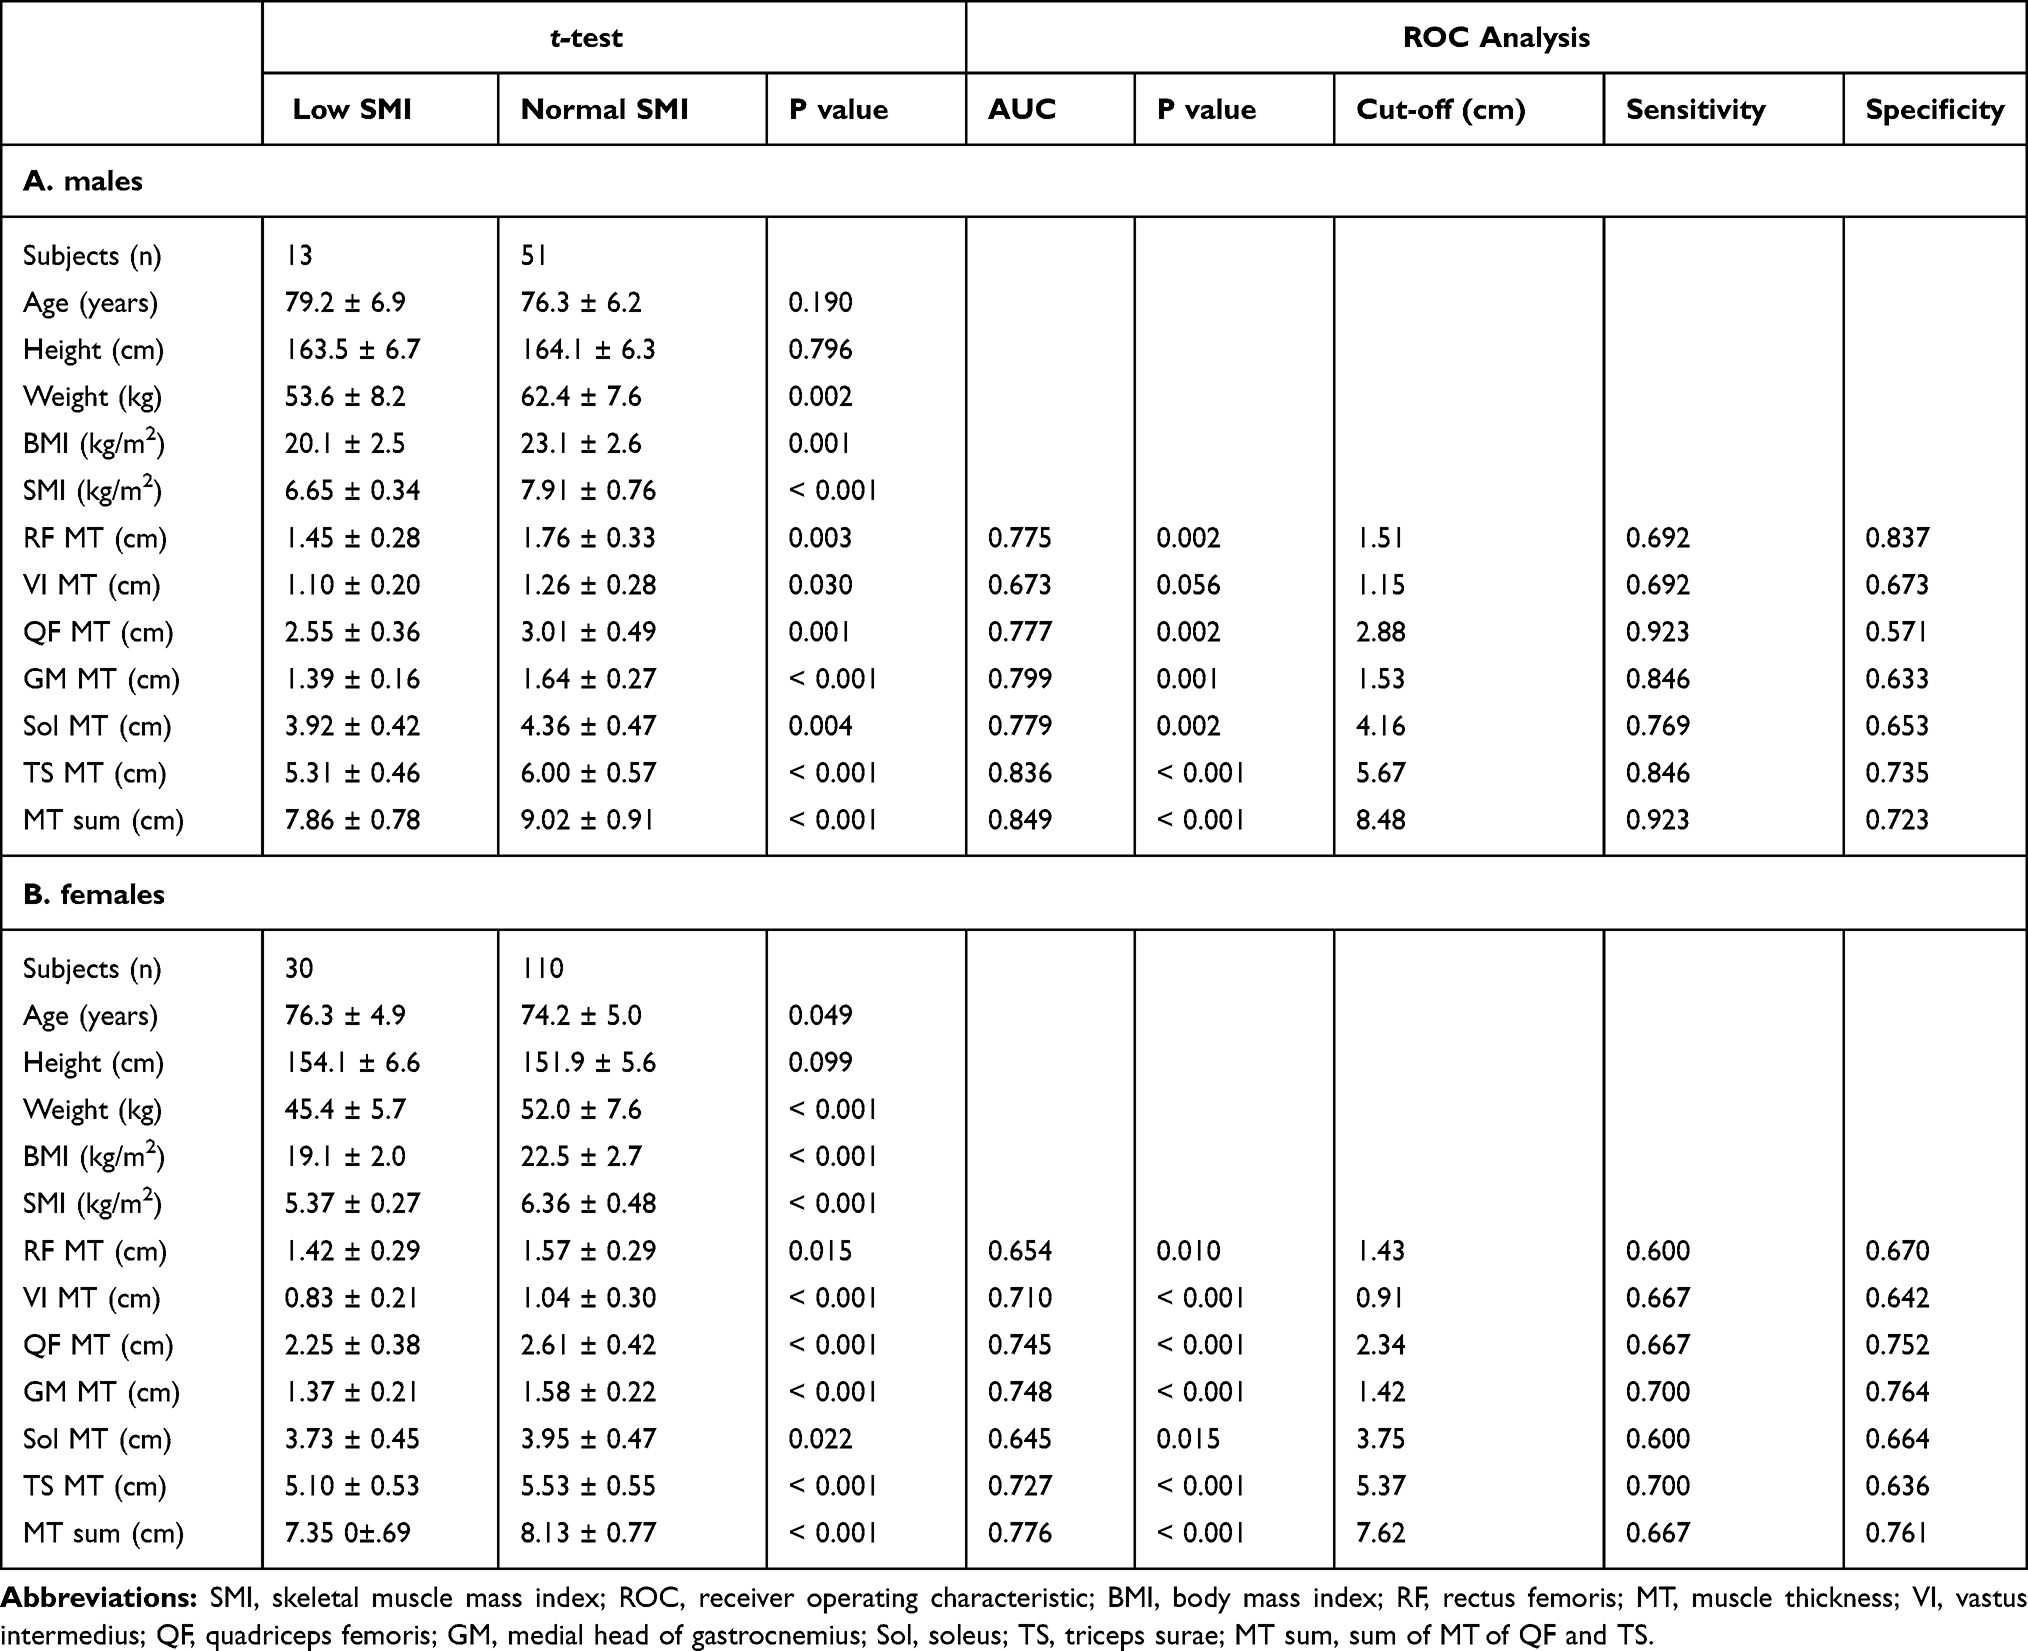 |
Table 2 Comparison of Older Adults with and without Low SMI and ROC Analysis for Low SMI |
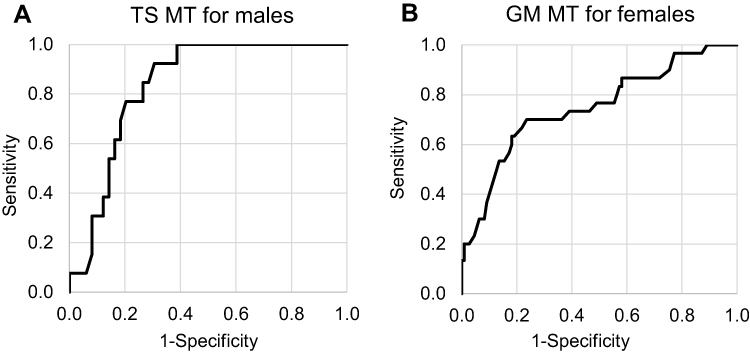 |
Figure 1 Receiver operating characteristic curve analysis of MT for predicting low SMI. (A) males. AUC: 0.836, cut-off value: 5.67 cm. (B) females. AUC: 0.748, cut-off value: 1.42 cm. Abbreviations: MT, muscle thickness; SMI, skeletal muscle mass index; AUC, area under the curve; TS, triceps surae; GM, medial head of gastrocnemius. |
Table 3 shows SD-based MT cut-off values. Overall, muscle-specific differences were observed between low SMI-predicting and SD-based cut-off values. Table 3 also shows the prevalence of low muscle mass for each MT in older adults when these cut-off values were applied. Corresponding to the muscle-specific differences in cut-off values, prevalence widely differed between muscles, with a range of 4.8–72.6% for older males and 12.1–36.7% for older females.
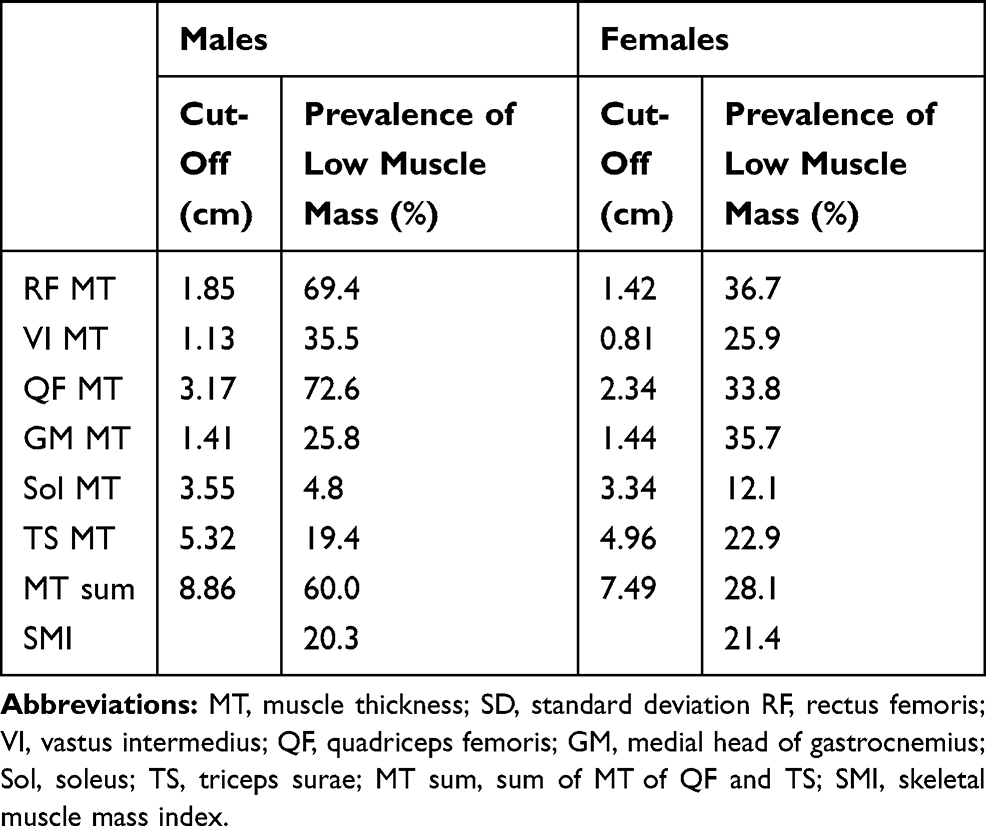 |
Table 3 Cut-off Values of MT Based on 2 SD Below the Young Adult Means for Corresponding Muscles |
Discussion
This study was the first to clarify the prediction accuracy and cut-off values to detect low SMI for sarcopenia using ultrasound-derived thigh and lower leg MT in older adults. Consistent with our hypothesis, MT sum showed the highest AUC value for predicting low SMI in both males (0.849) and females (0.776). Among other MTs, the TS of males (0.836) and GM of females (0.748) showed the highest AUC values for predicting low SMI. In females, the AUC value of the MT of the QF (0.745) was almost the same as that of the MT of the GM. However, measuring lower leg MT can be quicker than measuring thigh MT because it is easy to expose the lower leg for imaging. Thus, ultrasound measurement of lower leg muscles is a simple and robust method to detect low muscle mass for sarcopenia that can be applied in busy clinical settings or during large population-based screenings. Ultrasound has the advantage of assessing each muscle individually. This study also suggested that ultrasound could be a sensitive measuring tool to predict whole-limb muscle mass loss for sarcopenia by assessing lower leg muscles; thus, ultrasound can be used as a screening test where BIA is not available or cannot be performed due to the presence of a pacemaker or metals.
A possible explanation for the inter-muscle differences in prediction accuracy could be site-specific loss of muscle mass with aging. Previous studies have suggested that, among limb muscles, age-related muscle mass loss is greatest in the QF.5,7,18 In fact, the age-related decline of MT, calculated as a ratio between older and younger adults, was greater in the QF (24.1–33.6%) than in the TS (3.3–22.6%) in this study. Thus, a muscle highly specific to loss of muscle mass may not adequately predict low SMI, as SMI includes muscles that show less age-related muscle mass loss such as the upper limb muscles. The difference in the MT of the Sol between younger and older adults was very small (3.3–3.5%) and less significant in both sexes, suggesting that this muscle is less sensitive to aging. This finding corroborates a previous study6 demonstrating that the Sol is the only muscle not showing a significant reduction of MT with aging among the hip, thigh, and lower leg muscles. The mechanism underlying this site-specific difference in muscle mass loss with aging is not fully understood; however, differences in the loss of motor neuron innervation,23 fiber-type distribution, and insulin-sensitivity23–25 are possibly associated with site-specific loss of muscle mass.
This study also estimated the SD-based cut-off values for MT. Differences between the SD-based and low SMI-predicting cut-off values were observed for several muscles, suggesting that cut-off values for site-specific muscle mass loss may not always agree with those for whole-limb muscle mass loss. Especially for males, the SD-based cut-off values for the MT of the RF or QF were substantially higher than the low SMI-predicting values. Consequently, with SD-based cut-off values, approximately 70% of older males in this study were classified with low muscle mass of the RF or QF, while the prevalence of a low SMI was only 20.3%. This result seems to represent specific QF MT loss with aging, and agrees with a previous study by Abe et al17 suggesting that “site-specific sarcopenia” appears in the thigh before detection at the whole body level. Therefore, when low muscle mass is assessed for sarcopenia, site-specific muscle mass loss along with SMI, especially for the QF, should be assessed.
The difference between the two cut-off values for MT of the QF was not observed in females in this study. This discrepancy may be because the age-related loss of MT of the RF was greater in older males (32.7%) than in older females (24.1%). The older males were significantly older than the older females by 2.2 years (p=0.008). Our previous longitudinal study demonstrated that older adults experience a decrease in the MT of the QF up to 11.5% during 4-year observation periods (approximately 3% per year).19 Thus, the specific loss of the MT of the RF due to aging progressed in older males more than in older females in this study; therefore, the low SMI-predicting cut-off value of the MT of the RF in older males was lowered. However, age-related VI MT loss was comparable between the older males (33.0%) and females (33.6%), despite the age difference. There may be a difference in the age-related MT loss among the four muscles of the QF; this difference should be clarified in a future study. For SD-based cut-off values, the prevalence of low muscle mass was the smallest in the MT of the Sol for both older males (4.8%) and females (12.1%); thus, agreeing with the observation that the difference in the MT of the Sol between younger and older adults was the smallest for both sexes.
The present study estimated two cut-off values for ultrasound-derived MT for low muscle mass. The low SMI-predicting cut-off values can be useful for detecting a low muscle mass of the entire limb, which is important for diagnosing sarcopenia. However, MT assessment using SMI-predicting cut-off values may overlook the regional muscle mass loss that occurs earlier than whole-body muscle mass loss with aging. Therefore, for the early detection of the site-specific loss of muscle mass, SD-based cut-off values may be applied prior to the SMI-predicting cut-off values in clinical assessment. In addition, a recent study26 reported that the regional MT may be more important for walking performance than SMI measured using BIA. The results of this previous study may suggest that SD-based (instead of SMI-predicting) cut-off values can also be used for detecting a decline in physical performance. Further research is required to determine the cut-off value that would be most appropriate to predict a decline in physical performance.
This study had several limitations. First, the sample size was small, especially for younger adults (31 males, 28 females). The SD-based cut-off values depended on the younger sample. It is possible that the small sample size of younger adults is one of the reasons for the difference between the SMI-predicting and SD-based cut-off values. Future large-scale studies are warranted to verify the external validity of our results. Second, while ultrasound imaging is now widely available, and the high repeatability of the imaging technique has been established previously, ultrasound imaging needs a degree of expertise to acquire reliable results. In addition, ultrasound imaging was performed under the sitting position in this study, as this position does not require large spaces or beds, and allows quick assessments in busy clinical settings or large population-based screenings. Thus, cut-off values obtained in this study may not be fully applied for MT measured on positions other than sitting. Third, SMI was defined as the muscle mass of four limbs adjusted for height squared, whereas MT was not adjusted for any body constitution. To the best of our knowledge, a standard, appropriate method for adjusting MT to body constitution measurements has not been established yet, and raw MT data has been used in most studies that attempted to estimate cut-off values. Further studies are needed to explore an optimal correction method for constitution-dependent differences in MT for predicting SMI.
Conclusion
The MT sum is the most accurate predictor of low SMI for sarcopenia, with cut-off values of 8.48 cm in males and 7.62 cm in females. We propose using the MT of the TS and the MT of the GM in males and females, respectively (cut-off value: 5.67 cm, 1.42 cm, respectively), as they predict low SMI more accurately than the QF and can be measured easily using lower leg ultrasound imaging. Muscle-specific differences between low SMI-predicting and SD-based cut-off values were observed. Although further studies are needed, our results provide important information to establish ultrasound-based detection of low SMI for sarcopenia and site-specific loss of MT for older adults.
Acknowledgments
The authors would like to thank all volunteers for participating in the study.
Funding
This research did not receive any funding from agencies in the public, commercial, or not-for-profit sectors.
Disclosure
The authors declare no conflicts of interest.
References
1. Cruz-Jentoft AJ, Bahat G, Bauer J, et al. Sarcopenia: revised European consensus on definition and diagnosis. Age Ageing. 2019;48(4):601. doi:10.1093/ageing/afz046
2. Beaudart C, Zaaria M, Pasleau F, Reginster JY, Bruyere O. Health Outcomes of Sarcopenia: a Systematic Review and Meta-Analysis. PLoS One. 2017;12(1):e0169548. doi:10.1371/journal.pone.0169548
3. Chen LK, Woo J, Assantachai P, et al. Asian Working Group for Sarcopenia: 2019 Consensus Update on Sarcopenia Diagnosis and Treatment. J Am Med Dir Assoc. 2020;21(3):300–307 e302. doi:10.1016/j.jamda.2019.12.012
4. Studenski SA, Peters KW, Alley DE, et al. The FNIH sarcopenia project: rationale, study description, conference recommendations, and final estimates. J Gerontol A Biol Sci Med Sci. 2014;69(5):547–558. doi:10.1093/gerona/glu010
5. Abe T, Sakamaki M, Yasuda T, et al. Age-related, site-specific muscle loss in 1507 Japanese men and women aged 20 to 95 years. J Sports Sci Med. 2011;10(1):145–150.
6. Ikezoe T, Mori N, Nakamura M, Ichihashi N. Age-related muscle atrophy in the lower extremities and daily physical activity in elderly women. Arch Gerontol Geriatr. 2011;53(2):e153–157. doi:10.1016/j.archger.2010.08.003
7. Ikezoe T, Nakamura M, Shima H, Asakawa Y, Ichihashi N. Association between walking ability and trunk and lower-limb muscle atrophy in institutionalized elderly women: a longitudinal pilot study. J Physiol Anthropol. 2015;34(1):31. doi:10.1186/s40101-015-0069-z
8. Fukumoto Y, Ikezoe T, Tateuchi H, et al. Muscle mass and composition of the hip, thigh and abdominal muscles in women with and without hip osteoarthritis. Ultrasound Med Biol. 2012;38(9):1540–1545. doi:10.1016/j.ultrasmedbio.2012.04.016
9. Taniguchi M, Fukumoto Y, Kobayashi M, et al. Quantity and Quality of the Lower Extremity Muscles in Women with Knee Osteoarthritis. Ultrasound Med Biol. 2015;41(10):2567–2574. doi:10.1016/j.ultrasmedbio.2015.05.014
10. Monjo HFY, Asai T, Kubo H, Oshima K, Tajitsu H, Koyama S. Differences in muscle thickness and echo intensity between stroke survivors and age- and sex- matched healthy older adults. Phys Ther Res. 2020;23(2):188–194. doi:10.1298/ptr.E10018
11. Masaki M, Ikezoe T, Fukumoto Y, et al. Association of sagittal spinal alignment with thickness and echo intensity of lumbar back muscles in middle-aged and elderly women. Arch Gerontol Geriatr. 2015;61(2):197–201. doi:10.1016/j.archger.2015.05.010
12. Fukumoto Y, Asai T, Ichikawa M, et al. Navicular drop is negatively associated with flexor hallucis brevis thickness in community-dwelling older adults. Gait Posture. 2020;78:30–34. doi:10.1016/j.gaitpost.2020.03.009
13. Nijholt W, Scafoglieri A, Jager-Wittenaar H, Hobbelen JSM. van der Schans CP. The reliability and validity of ultrasound to quantify muscles in older adults: a systematic review. J Cachexia Sarcopenia Muscle. 2017;8(5):702–712. doi:10.1002/jcsm.12210
14. Yamada M, Kimura Y, Ishiyama D, et al. Differential Characteristics of Skeletal Muscle in Community-Dwelling Older Adults. J Am Med Dir Assoc. 2017;18(9):807e809–807 e816. doi:10.1016/j.jamda.2017.05.011
15. Hida T, Ando K, Kobayashi K, et al. Editors’ Choice Ultrasound measurement of thigh muscle thickness for assessment of sarcopenia. Nagoya J Med Sci. 2018;80(4):519–527. doi:10.18999/nagjms.80.4.519
16. Isaka M, Sugimoto K, Yasunobe Y, et al. The Usefulness of an Alternative Diagnostic Method for Sarcopenia Using Thickness and Echo Intensity of Lower Leg Muscles in Older Males. J Am Med Dir Assoc. 2019;20(9):1185e1181–1185 e1188. doi:10.1016/j.jamda.2019.01.152
17. Abe T, Thiebaud RS, Loenneke JP, Loftin M, Fukunaga T. Prevalence of site-specific thigh sarcopenia in Japanese men and women. Age. 2014;36(1):417–426. doi:10.1007/s11357-013-9539-6
18. Minetto MA, Caresio C, Menapace T, et al. Ultrasound-Based Detection of Low Muscle Mass for Diagnosis of Sarcopenia in Older Adults. PM R. 2016;8(5):453–462. doi:10.1016/j.pmrj.2015.09.014
19. Fukumoto Y, Yamada Y, Ikezoe T, et al. Association of physical activity with age-related changes in muscle echo intensity in older adults: a 4-year longitudinal study. J Appl Physiol. 2018;125(5):1468–1474. doi:10.1152/japplphysiol.00317.2018
20. Fukumoto YIT, Taniguchi M, Sawano S, et al. Influence of patient position on ultrasonography-derived muscle thickness and echo intensity measurements. J Phys Fit Sports Med. 2019;8(6):291.
21. Landis JR, Koch GG. The measurement of observer agreement for categorical data. Biometrics. 1977;33(1):159–174. doi:10.2307/2529310
22. Yamada Y, Nishizawa M, Uchiyama T, et al. Developing and Validating an Age-Independent Equation Using Multi-Frequency Bioelectrical Impedance Analysis for Estimation of Appendicular Skeletal Muscle Mass and Establishing a Cutoff for Sarcopenia. Int J Environ Res Public Health. 2017;14(7):Jul. doi:10.3390/ijerph14070809
23. Aagaard P, Suetta C, Caserotti P, Magnusson SP, Kjaer M. Role of the nervous system in sarcopenia and muscle atrophy with aging: strength training as a countermeasure. Scand J Med Sci Sports. 2010;20(1):49–64. doi:10.1111/j.1600-0838.2009.01084.x
24. Johnson MA, Polgar J, Weightman D, Appleton D. Data on the distribution of fibre types in thirty-six human muscles. An autopsy study. J Neurol Sci. 1973;18(1):111–129. doi:10.1016/0022-510X(73)90023-3
25. James DE, Jenkins AB, Kraegen EW. Heterogeneity of insulin action in individual muscles in vivo: euglycemic clamp studies in rats. Am J Physiol. 1985;248(5 Pt 1):E567–574. doi:10.1152/ajpendo.1985.248.5.E567
26. Ata AM, Kara M, Kaymak B, et al. Regional and total muscle mass, muscle strength and physical performance: the potential use of ultrasound imaging for sarcopenia. Arch Gerontol Geriatr. 2019;83:55–60. doi:10.1016/j.archger.2019.03.014
 © 2021 The Author(s). This work is published and licensed by Dove Medical Press Limited. The
full terms of this license are available at https://www.dovepress.com/terms
and incorporate the Creative Commons Attribution
- Non Commercial (unported, 3.0) License.
By accessing the work you hereby accept the Terms. Non-commercial uses of the work are permitted
without any further permission from Dove Medical Press Limited, provided the work is properly
attributed. For permission for commercial use of this work, please see paragraphs 4.2 and 5 of our Terms.
© 2021 The Author(s). This work is published and licensed by Dove Medical Press Limited. The
full terms of this license are available at https://www.dovepress.com/terms
and incorporate the Creative Commons Attribution
- Non Commercial (unported, 3.0) License.
By accessing the work you hereby accept the Terms. Non-commercial uses of the work are permitted
without any further permission from Dove Medical Press Limited, provided the work is properly
attributed. For permission for commercial use of this work, please see paragraphs 4.2 and 5 of our Terms.