Back to Journals » Eye and Brain » Volume 8
Cue combination encoding via contextual modulation of V1 and V2 neurons
Authors Zarella MD, Ts'o DY
Received 2 February 2016
Accepted for publication 21 April 2016
Published 21 October 2016 Volume 2016:8 Pages 177—193
DOI https://doi.org/10.2147/EB.S105616
Checked for plagiarism Yes
Review by Single anonymous peer review
Peer reviewer comments 3
Editor who approved publication: Professor Margaret Wong-Riley
Supplementary video 1 shows the homogeneous stimulus for a bar orientation of 45° and motion direction of 90°.
Views: 300
Mark D Zarella, Daniel Y Ts’o
Department of Neurosurgery, SUNY Upstate Medical University, Syracuse, NY, USA
Abstract: Neurons in early visual cortical areas encode the local properties of a stimulus in a number of different feature dimensions such as color, orientation, and motion. It has been shown, however, that stimuli presented well beyond the confines of the classical receptive field can augment these responses in a way that emphasizes these local attributes within the greater context of the visual scene. This mechanism imparts global information to cells that are otherwise considered local feature detectors and can potentially serve as an important foundation for surface segmentation, texture representation, and figure–ground segregation. The role of early visual cortex toward these functions remains somewhat of an enigma, as it is unclear how surface segmentation cues are integrated from multiple feature dimensions. We examined the impact of orientation- and motion-defined surface segmentation cues in V1 and V2 neurons using a stimulus in which the two features are completely separable. We find that, although some cells are modulated in a cue-invariant manner, many cells are influenced by only one cue or the other. Furthermore, cells that are modulated by both cues tend to be more strongly affected when both cues are presented together than when presented individually. These results demonstrate two mechanisms by which cue combinations can enhance salience. We find that feature-specific populations are more frequently encountered in V1, while cue additivity is more prominent in V2. These results highlight how two strongly interconnected areas at different stages in the cortical hierarchy can potentially contribute to scene segmentation.
Keywords: striate, extrastriate, extraclassical, texture, segmentation
Introduction
Cells at the level of V1 receive inputs from higher cortical areas, which prove instrumental in shaping their response properties.1,2 These connections have the capacity to serve a number of different functions, but particular interest has been paid to the contextual influences they impart in the presence of feature contrast. When the stimulus falling in a cell’s extraclassical surround differs from the stimulus within the classical receptive field, the firing rate of the cell is often enhanced relative to the response to a homogeneous field. This enhancement is thought to underlie the visual system’s ability to segment a scene, where abrupt differences in visual features can serve as markers of surface boundaries.
The visual system is capable of using cues from many different feature dimensions to aid in scene segmentation. Natural scenes often contain multiple cues, and the visual system draws from each cue to form the percept of distinct surfaces and textures. Attempts to understand this behavior at the neurophysiological level have usually relied on the presentation of abutting textures or gratings composed of one or several of these cues. With this approach, a number of different visual features have been shown to exert modulatory effects on early visual cortical cells, including color and luminance,3 motion,4,5 disparity,6 orientation,7,8 and other spatial properties.9,10 Although many studies have shown how feature contrast within these dimensions is represented by cortical neurons early in the visual hierarchy, we have only a limited understanding of how these cells, often with classical receptive fields tuned to only certain features, contribute to a segmentation process that is ultimately considered cue-invariant (CI).11,12
It has further been shown that a combination of cues within different feature domains forms a more salient percept than the component cues alone.13–17 Similar properties have been observed in the physiological response properties of V1 to checkerboard patterns defined by differences in the orientation or spatial frequency of the texture elements between adjacent checks. Bach et al18 discovered that visual evoked potentials generated by V1 in response to these stimuli were stronger than those evoked by the uniform control. When the two features were combined, so that checks were defined by differences in both orientation and spatial frequency, the evoked potentials were stronger than for the individual cues presented alone. These results introduced a potential neural correlate of the visual system’s tendency to be dually activated by multiple cues simultaneously, although the mechanism by which the synergistic interaction of cues leads to enhanced activation remains unclear.
We investigated the neurophysiological foundation by which cues are combined in the visual system by examining the behavior of individual neurons in the early visual cortical areas V1 and V2. We included units from V2 in the study to further elucidate the role that feedback may play in this process, as V2 is a prominent source of feedback to V1. We developed a stimulus set that allowed us to independently manipulate cues within the orientation and motion domains while keeping the central stimulus that falls within the classical receptive field the same for all conditions. This provided us the opportunity to examine extraclassical modulatory effects in isolation and confined to their respective feature dimensions, as well as to study the interactions of cues across different feature dimensions. Here we show that feature-specific (FS) modulation is well represented at the single-cell level, especially in V1, which provides a substrate for segmentation mechanisms to incorporate FS contrast computations. We reasoned that the presence of several FS populations representing each cue expands the pool from which to draw feature contrast information when multiple cues are available, potentially explaining the additive properties described in the psychophysical and visual evoked potential studies. In such an arrangement, however, the contribution of cells that are modulated by multiple features would be redundant in the presence of multiple cues, unless such cells individually responded more strongly to cue combinations than to single cues. We tested these alternate, but not mutually exclusive, hypotheses and confirmed that both can potentially serve as neuronal mechanisms that underlie the additive enhancement of segmentation cues within distinct feature dimensions.
Methods
Animal preparation
We recorded from 291 single units in areas V1 and V2 of 13 anesthetized macaque monkeys. Monkeys were anesthetized and paralyzed with an intravenous infusion of sodium thiopental and vecuronium bromide. Heart rate, expired CO2, and body temperature were monitored throughout the experiment. All animal procedures were approved by the Institutional Review Board at SUNY Upstate Medical University. All animal-handling procedures were performed according to the Guide for the Care and Use of Laboratory Animals of the National Institutes of Health and followed the guidelines of the Animal Welfare Act.
Electrophysiology procedure
Craniotomy and duratomy were performed to expose a ~1 cm2 region of cortex just posterior to the lunate sulcus to reveal areas V1 and V2. Agar was applied to the surface of the cortex and allowed to dry to reduce the movement of the brain with respect to the stabilized head and recording apparatus. We inserted 1.0–1.5 MΩ tungsten electrodes through the agar and into the cortex to record extracellular potentials. We noted the initial depth of penetration and used a microdrive to slowly advance the electrode along the penetration direction in controlled steps with micrometer precision.
The visual area from which we recorded was determined by a number of different procedures. First, when available, we used ocular dominance patterns derived from parallel optical imaging experiments obtained in the same session to visually identify the location of the V1/V2 border. Using the surface vasculature as landmarks, we chose penetration sites that were a safe distance away from the border, and we ensured that the angle of penetration was perpendicular to the surface of the cortex. This procedure proved to be a very reliable method for distinguishing between visual areas. In cases where ocular dominance maps were not obtained, we confined our V1 recordings to the most posterior portion of the craniotomy site, typically several millimeters away from the lunate sulcus. We reached V2 by traversing through the upper layer of cortex and the underlying white matter, and into the ventral cortex below. We avoided inadvertent recording from area V3 by placing these penetrations closer to the lunate sulcus, and allowing for only one white matter transition. Using this strategy, we avoided ambiguous regions of cortex that we would less confidently be able to identify. In addition, we considered other factors, such as the differences in binocularity and receptive field sizes that can serve as distinguishing features between V1 and V2.
We collected data from 240 sites from 58 penetrations in seven monkeys using a window discriminator that captured spike times when the signal crossed a user-defined threshold. This method required careful adjustment to ensure that the spikes being captured were all produced by the same unit and not by nearby units. To help verify post hoc that the recorded spikes were in fact produced by a single unit, we measured the interspike intervals for each recording to ascertain whether spike times violated the refractory period. We discarded any recordings where the spikes within 1 ms of the previously occurring spike exceeded 5%, a threshold consistent with that used in Gur et al.19
For later experiments, we constructed a custom electrophysiology acquisition and analysis system that digitized and recorded the signals in their entirety, providing the capability of using more sophisticated spike sorting procedures offline. This system was comprised of custom-written MATLAB software that sampled the input waveform at 22.05 kHz from a commercial USB recording device (M-Audio, Cumberland, RI). We developed an offline spike sorting procedure that identified spike waveforms and categorized them based on waveform shape.20 The primary advantage gained with this procedure was that it provided a higher level of certainty that the spikes attributed to a unit were in fact coming only from that unit and not multiple units. A secondary advantage was that it made data acquisition more efficient, sometimes allowing us to record from two or three individual units simultaneously. We collected data from an additional 58 sites from 44 penetrations in six monkeys using this modified procedure. Analysis of the recordings from the two different procedures yielded similar results.
Visual stimuli
Monkeys viewed stimuli presented at nearly 100% contrast on a monitor positioned a distance of 114 cm away. The eyes were converged to a point on the center of the screen with the aid of a Risley prism. Eyelids were sutured open, and atropine and neosynephrine drops were applied to the eyes to dilate the pupils and resist accommodation. Contact lenses were fitted with the appropriate refractive power to ensure that the stimulus falling on the retina was in focus. Stimuli were constructed using custom MATLAB software written with the Cambridge Research Systems VSG toolbox. The Cambridge Research Systems VSG 2/5 video card was synchronized with the acquisition system so that the start of acquisition for each trial began with the appearance of the first video frame.
The stimuli in this experiment were designed to accomplish two goals: elicit the percept of a figural region superimposed on a large background, and isolate the cues that are responsible for the percept. We used orientation and motion cues for the purposes of this study, and developed a stimulus set that met the following criteria: 1) only orientation and motion could serve as cues; 2) a “cue” consisted of changing only the background texture field, leaving the central region unchanged for each condition; and 3) cues could be combined independently of one another. We met these criteria by constructing a stimulus composed of an array of drifting bars, forming a texture pattern. Each bar was confined to a movement area, several of which formed a large grid of bars (Figure 1). Each bar moved in a defined direction, and repeated from the starting edge of its movement area when it reached the end. The initial position of any given bar within its movement area was randomized, so that the disappearance of bars at the end of their movement areas occurred at different times. This prevented cues that normally accompany disappearance effects and aligned discontinuities from confounding the results.12,21
 | Figure 1 Schematic depicting each stimulus condition used in this study. Notes: A 3×3 grid of bars comprises the center figural region. Each bar is confined to a movement field, depicted by the dashed parallelogram. Direction of bar movement is shown by gray arrows. The bar repeats from the beginning of the movement field when it reaches the end. The phases of the bars within the display are randomly jittered (not pictured). The homogeneous (Hom) full-field stimulus consists of bars of equal orientation and motion direction throughout the entirety of the display. Orientation contrast (Ori) or motion contrast (Mot) configurations are created by changing the orientation or direction of the bars in the surround, respectively. Ori/Mot represents a stimulus composed of both cues, in which the bars in the surround differ in orientation and motion direction from those in the center. An annulus (Ann) condition and center-alone (Ctr) condition were also included, in which no bars were present in the center or in the surround, respectively. |
Motion contrast stimuli were formed by changing the direction of motion of the bars in the surround with respect to the center, but leaving the orientation of the bars unchanged. In order to accomplish this effect, the bars moved at oblique angles to their orientation. For example, to produce 90° of motion contrast in a set of 0° bars, the opposing motion components might be 45° and 135° (DMot =90°). Orientation contrast stimuli, on the other hand, were formed by changing the orientation of the bars in the surround with respect to the center. The direction of motion, however, was kept identical in both regions to isolate the orientation cue. Maximum orientation contrast could be achieved by using orthogonal bar orientations. However, in order to achieve equal motion directions in center and surround, the motion vectors had to be at oblique angles to the bar orientations. As an example, 0° and 90° bars could comprise an orientation contrast stimulus, but in order to remove the motion component, both sets of bars would have to drift in the 45° direction, for instance.
A full stimulus set designed to test the influence of individual orientation and motion cues contained the following conditions: 1) a full-field homogeneous stimulus that encompassed the entire display, where all bars had the same orientation and motion direction; 2) a small central stimulus, usually composed of a 3×3 or 5×5 array of bars, positioned over the classical receptive field of the cell; 3) an orientation contrast stimulus, with a central region the same size as in 2; 4) a motion contrast stimulus, with a central region the same size as in 2; 5) a cue combination stimulus, composed of the combination of 90° orientation contrast and 180° motion contrast; and 6) an annulus condition, consisting only of bars in the surround region. This stimulus set is illustrated schematically in Figure 1, and representative videos of the homogeneous orientation contrast, motion contrast, and cue combination stimuli are provided in the Supplementary videos V1, V2, V3, and V4, respectively. Importantly, the stimulus within the central region was the same for all conditions (except the annulus) so that a comparison could be made between the various surround manipulations. The annulus condition was included in order to verify that the surround portion of the stimulus did not directly activate the cell. Units that were significantly activated by the annulus condition relative to a blank condition (Mann–Whitney U-test, P<0.05) were excluded from all further analyses. This ensured that the manipulations applied to the surround region affected only the cell’s extraclassical receptive field.
Stimuli were presented binocularly and in a randomly interleaved fashion, with an interstimulus interval of 3–5 seconds. Stimulus duration varied from session to session (range: 1.25–3.0 seconds), after which the screen would become blank. Typically, 10–40 trials were repeated for the full set of randomized stimuli.
Receptive field mapping and stimulus positioning
We initially hand-mapped the receptive field of each cell with simple bar stimuli. During this step, we were able to confirm that the eyes remained converged and had not drifted apart during the course of the experiment. For a subset of cells, we further measured the minimum response field individually for each eye by presenting a sparse noise stimulus and applying a reverse correlation procedure.22,23 This produced a receptive field map that we could then use to determine the position and size parameters of the texture stimulus set.
After we mapped the minimum response field of the cell, we positioned the central region of the texture stimulus so that it encompassed the classical receptive field in its entirety. Our goal was to produce the smallest central region possible while, at the same time, making sure that the surround did not encroach upon the receptive field. We aimed to produce a central array size that consisted of nine bars (3×3 grid), though occasionally had to expand it to 25 bars (5×5) for cells that had larger receptive fields or were more strongly activated by smaller bar sizes. It was important that the individual bars were not larger than the receptive field to avoid the aperture effect.24 At the same time, we attempted to minimize the extent of the central patch, as extraclassical responses tend to be most pronounced when texture borders are in close proximity to the classical receptive field.5,25,26 These constraints provided a rather narrow choice of bar sizes that were typically in the range of 0.2°–0.5° in length. As noted in the “Results” section, these stimulus parameters yielded similar mean spike rates and levels of surround suppression for both visual areas tested.
Orientation and direction tuning
After deriving a suitable estimate of the basic parameters for the stimulus, we measured the orientation and direction tuning of the cell. We presented ten trials of the central texture stimulus at four different bar orientations, each drifting in four different directions. To compute the orientation and direction tuning strength, we created a set of vectors that corresponded to the orientations and directions tested. The length of each vector was determined from the firing rate evoked by that orientation or direction. We then summed the vectors, producing a single vector in which the normalized length represented the strength of tuning and angle indicated the preferred orientation or direction. Since a complete set of directions was obtained for each orientation tested, and a complete set of orientations was obtained for each direction tested, the opposing feature averaged out in the sum. Therefore, the vector we obtained in an orientation tuning calculation, for instance, was independent from the directional information in the data. We used the computed orientation and direction preference of each cell to determine the stimulus parameters in the subsequent center–surround presentations.
In some analyses, it became necessary to determine whether the tuning was significantly different from what one might expect from chance. To calculate the significance, we again applied this vector analysis. Using a bootstrap procedure, we generated 10,000 such vectors by randomly assigning the firing rates we obtained to the same set of vector directions, producing a completely different set of vectors and thus a different vector sum. By destroying the structure of the orientation and direction information, we expected these vectors to be considerably closer to zero for units that were significantly tuned. We derived P-values by dividing the number of simulated vector sums that exceeded the measured vector’s magnitude by the total number of bootstrap iterations.
Contrast enhancement index
The response evoked by the center stimulus presented alone indicated the activation of the cell due to classical receptive field stimulation. When a full-field version of the stimulus was presented by expanding the size of the array, surround suppression was expected to be maximal.27 Together, these conditions served as a baseline from which to measure the modulation exerted on a cell by extraclassical stimulation. We introduced an index (the contrast enhancement index [CEI]) that described the difference in suppression produced by changing a feature in the surround:
|
|
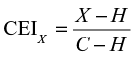
where X refers to the mean spike rate evoked by the feature contrast condition, H describes the same quantity for the homogeneous condition, and C is the response to the center-alone condition. For intermediate levels of suppression, the index returns a value between 0 and 1, where higher values indicate a reduction in suppression due to extraclassical feature contrast. Indices less than 0 or greater than 1 indicate increased suppression or facilitation by extraclassical feature contrast, respectively.
Cue invariance simulations
We performed simulations to determine whether the observation of dually enhanced neurons was the byproduct of having two independent factors randomly distributed among a set number of neurons, or whether there was tendency for neurons that were enhanced by one feature to also be enhanced by the other. To test this, we randomly assigned M orientation contrast and N motion contrast enhanced responses across P neurons, and counted the number of neurons that exhibited both orientation and motion contrast enhancement. By performing this simulation 1,000 times, we were able to apply a permutation test to reveal whether the measured proportions of dually enhanced neurons were significantly different from those expected by random assignment.
Results
To understand the orientation- and motion-specific extraclassical surround effects exhibited by neurons in V1 and V2, we used a stimulus carefully designed to isolate those cues in figure–ground arrangements. The stimulus conditions, shown schematically in Figure 1, were composed of orientation and motion contrast textures containing a central patch of drifting bars that differed in their orientation or direction of motion, respectively, in comparison to the much larger field of bars surrounding it. This configuration gives rise to the percept of a small textural region superimposed on a much larger background, a percept elicited by cues only within the orientation or motion domain. The central patch was placed over the receptive field of the cell under study. The size of the patch was chosen so that none of the bars belonging to the surround region encroached upon the classical receptive field. This was verified by incorporating an annulus condition into the stimulus set, where no center patch was present, and discarding units whose response to this condition was significantly different from the background firing rate (P<0.05, Mann–Whitney U-test). We were therefore able to test the purely modulatory extraclassical receptive field influences while leaving the central stimulus identical throughout all conditions. We hypothesized that cue combinations enhance cell firing rates in V1 and V2 beyond the enhancement to single cues, consistent with the perceptual phenomenon in which the salience of targets embedded within a set of distractors is increased with the addition of cues from multiple feature domains.17
Cue combinations activate the neuronal population more strongly than single cues
There was a general tendency for neurons in both V1 and V2 to be suppressed by large fields in comparison to the center patch presented alone. As indicated in Figure 2A, 54% of the single units from which we recorded were significantly suppressed by the presence of a homogeneous surround in their extraclassical fields (Ctr+), while only 6% were significantly enhanced by this configuration (Ctr–) (P<0.05, Mann–Whitney U-test). However, feature contrast within either the orientation or motion domains often enhanced the firing rate of these cells relative to the homogeneous field (to a significant extent in ~30% of Ctr+ cells; shown for each stimulus configuration in Figure 2B). An example of a cell enhanced by feature contrast in both dimensions is shown in Figure 3. This cell responded briskly to a 2° center patch presented alone (with a mean spike rate represented by the arrow at the right), but exhibited a much weaker response when the array covered the entire 16° display (DOri =0°). The magnitude of this suppression, however, depended on the difference between the orientations or the directions of motion between center and surround. This neuron was suppressed less by orthogonal orientations (DOri =90°) and directions (DMot =180°) than by smaller differences in those features. For the remainder of our analyses, we used only orthogonal feature contrast conditions rather than intermediate differences so that we could maximize the magnitude of the effect to reveal the extent of modulation across our sample.
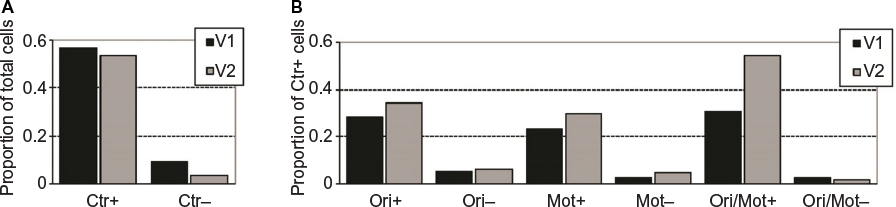 | Figure 2 Proportions of cells significantly modulated by center alone (Ctr), orientation contrast (Ori), motion contrast (Mot), and cue combination (Ori/Mot) conditions. Notes: (A) Units that were significantly enhanced by Ctr stimuli are designated by Ctr+, while units that were significantly suppressed by Ctr stimuli are designated by Ctr– (P<0.05, Mann–Whitney U-test). This demonstrates that cells in both visual areas tended to be suppressed by the presence of stimulation in the surround. (B) A similar analysis was performed on surround-suppressed cells (those in the Ctr+ group) for orientation contrast, motion contrast, and cue combination conditions. These results demonstrate that single units tended to be enhanced rather than suppressed by feature contrast stimuli and that this tendency was more pronounced in V2 than in V1. |
 | Figure 3 Mean spike rates evoked by orientation and motion contrast for a single unit in V2. Notes: Spikes were tallied for the first 1 second of stimulation. DOri and DDir represent the difference in orientation and direction, respectively, between the center and surround regions. A difference of zero is referred to as the homogeneous condition (depicted twice in the plot for clarity). For this cell, incrementally increasing contrast within either feature domain enhanced the firing rate. The response to center-alone stimulation is depicted by the arrowhead. The response to the annulus condition is not significantly different from the blank unstimulated condition, suggesting that the modulation observed is purely extraclassical. *P<0.01, **P<0.001. |
Overall, cells frequently exhibited significantly less suppression from orientation or motion contrast configurations than from homogeneous fields. In Figure 4A, the mean time course for all 231 recordings in V1 and V2 is shown, stratified by stimulus type. The center-alone condition (depicted by the bolded line) evoked the greatest response. The homogeneous condition (depicted by the thin line) evoked a much smaller response on average, consistent with the notion of surround suppression. The difference was immediate and persisted throughout the response. The orientation contrast, motion contrast, and cue combination conditions, on the other hand, exhibited time courses similar to the homogeneous condition throughout the earliest part of the response, but soon after showed a relative enhancement that persisted until the stimulus was turned off. This behavior is similar to time courses observed in previous studies, in which full-field activation, regardless of the precise center–surround stimulus configuration, universally suppressed the early part of the response but exhibited segmentation-specific modulation shortly thereafter.11,28 Importantly, we find that cue combinations more strongly activate the population than orientation and motion contrast stimuli alone, consistent with the results from Bach et al.18 We have demonstrated this effect in a purely modulatory sense, as the mean response to the annulus condition (denoted by the gray line) did not show any activation by the stimulus.
 | Figure 4 Population firing rates and statistics. Notes: (A) Mean firing rate time courses obtained from center-alone (Ctr), homogeneous (Hom), orientation contrast (Ori), motion contrast (Mot), and cue combination (Ori/Mot) stimuli, as well as the blank unstimulated condition (Blank) for all recordings. Recordings in which the surround elicited a response or that were not responsive to visual stimulation were excluded. Multiunit recordings were included. The response is shown up to 1 second following stimulus onset. For time points beyond 1 second, the response is aligned to stimulus offset to account for different recordings having different stimulus durations (the minimum duration was 1.5 seconds). (B) CEI distributions obtained from orientation contrast (top), motion contrast (middle), and cue combinations (bottom) for the 108 surround-suppressed cells in our sample. Cells in which the surround presented by itself elicited a response, and cells that were not responsive to visual stimulation were excluded. Filled bars represent responses significantly different from Hom. The last bin in each histogram represents CEI values ≥1.75. The first two distributions, corresponding to the single cue stimuli, have a median of 0.21 and are not significantly different from each other. The bottom distribution, however, has a median of 0.42 and is significantly greater than the other two (P<0.01; Mann–Whitney U-test). Abbreviations: CEI, contrast enhancement index; Med, median. |
To further elaborate on this finding, we introduce a measure, the CEI (Equation 1), to describe the proportion of the spike rate recovered from suppression when introducing a feature discontinuity in the extraclassical surround. This measure treats the center-alone condition as an unsuppressed baseline, and is calibrated with the assumption that a large homogeneous surround maximally suppresses the response of the cell. Therefore, for a given condition, a CEI of zero indicates that the feature contrast stimulus is unable to enhance the cell beyond the response of the homogeneous condition. A CEI of 1, on the other hand, indicates an enhancement in the response to the same level produced by the center-alone condition. Values beyond the range 0–1 are permissible, and indicate a further reduction in the response due to feature contrast (negative CEIs) or facilitation beyond the center-alone stimulus (CEIs >1). Using this measure, we find that single units in V1 and V2 tend to have greater CEIs for cue combinations than for the individual cues. In Figure 4B, we show the CEI distributions for orientation contrast, motion contrast, and for the two cues combined. Most of the CEI values for all three stimulus conditions fell between 0 and 1 (Ori: 70.3%; Mot: 67.3%; Ori/Mot: 69.3%), indicating that extraclassical feature contrast often enhanced the responses relative to homogeneous fields, but usually not beyond the responses to the center condition alone. Median CEI values for orientation contrast and motion contrast conditions were both 0.21. The two distributions were not significantly different from one another (P=0.65, Wilcoxon signed-rank test). On the other hand, the median CEI for the cue combination condition was 0.42, and this distribution was significantly greater than each of the distributions produced by the orientation and motion contrast conditions (Ori: P=0.0003, Mot: P=0.0023, Wilcoxon signed-rank test). This measure revealed that the overall enhancement of the population due to cue combinations significantly increased responsivity relative to that produced by the individual cues.
As a final measure of the effectiveness of cue combinations to enhance the neuronal response, we determined on a cell-by-cell basis whether orientation contrast, motion contrast, and orientation–motion combination stimuli significantly enhanced firing rates in comparison to the homogeneous stimulus. We applied a Mann–Whitney U-test to the individual spike counts derived from each trial for each condition. Of 108 surround-suppressed single units, we found that 33 were significantly enhanced by orientation contrast in comparison to the homogeneous stimulus, 30 were enhanced by motion contrast, and 47 were enhanced by cue combinations (Figure 2B). Cue combinations significantly enhanced the responses of cells in the population much more frequently than either of the single cue conditions. Together, these population measures confirm that cue combinations more strongly activate the cells in our sample than the same cues presented individually.
Possible mechanisms of cue combination enhancement
Increased enhancement of the population response to cue combinations could arise from two different sources. First, these observations might be a consequence of FS response enhancement among neurons. That is, some cells may be enhanced by cues in only one feature domain, and co-activation of such cells in the presence of multiple cues could be responsible for the enhanced population response. We tested whether a stimulus containing both orientation and motion cues could potentially activate cells enhanced only by orientation contrast and cells enhanced only by motion contrast (as well as those enhanced by both cues), thereby deriving overall enhancement from several distinct populations of cells. We present this as the FS hypothesis. A second possibility is that cells enhanced by multiple cues are themselves enhanced more strongly by cue combinations than by individual cues, and their response enhancement alone may be responsible for cue combination enhancement at the population level. We present this as the additivity hypothesis.
FS contextual modulation
Figure 5A plots the CEI values computed from motion contrast against the corresponding CEI values computed from orientation contrast for all 108 surround-suppressed cells. Each cell was categorized as generally suppressive (following the nomenclature in the study by Nothdurft et al29), FS, or CI based on the number of features that evoked significantly greater firing rates than the homogeneous condition (P<0.05, Mann–Whitney U-test). As evident in the figure, the CEIs between orientation contrast and motion contrast were significantly correlated, but perhaps only because the indices shared the same center-only and homogeneous values for each cell. The high level of variability in relation to the unity line in this plot implies that some cells, although strongly modulated in one feature domain, may be unaffected by cues within another feature domain. Such a FS neuron would remain blind to the presence of a cue in the insensitive feature domain, instead encoding the stimulus the same way it encodes a homogeneous field. An example of the response of a FS cell is shown in Figure 5B (contrasted with the time course of a CI cell in Figure 5C). This cell is enhanced by motion contrast, but does not exhibit an enhancement to orientation contrast, as the firing rates evoked by the orientation contrast and homogeneous conditions are not significantly different. It is important to note that this tendency held across two different center directions tested (data not shown). Motion contrast stimuli, regardless of their absolute direction of motion, enhanced the firing rate of the cell. A similar response profile exists for the FS cell in Figure S1, which exhibits motion contrast enhancement that persists across four different center directions. This demonstrates that the responses we describe are not linear receptive field properties per se. Rather, this finding underscores that the computation being performed by these neurons is a relative measure of the difference between that which is in the classical receptive field and that which is in the extraclassical surround. These observations confirm that the preference for one cue over another cue in FS neurons is prevalent in V1 and V2, suggesting a combined effect at the population level in the presence of both cues simultaneously.
 | Figure 5 Feature-specific and cue-invariant response profiles. Notes: (A) Scatterplot of orientation and motion contrast modulation strength for surround-suppressed cells. Each point represents the CEI value for orientation contrast and motion contrast for an individual cell. Units from both visual areas are included, but not distinguished. Filled circles represent units that are not significantly modulated by either orientation or motion contrast. Gray circles represent units that are significantly modulated by only one of the features (FS cells). Open circles represent units that are significantly modulated by both features (CI cells). (B) Time course for a FS cell, denoted by the arrow marked “B” in (A). (C) Time course for a CI cell, denoted by the arrow marked “C” in (A). Abbreviations: CEI, contrast enhancement index; CI, cue-invariant; FS, feature-specific; GS, general suppression; Hom, homogeneous; Ori, orientation contrast; Mot, motion contrast; Stim, stimulus. |
The additivity hypothesis
The enhancement of the population response to cue combinations can be explained not only by the co-activation of FS units responsive to different cues but also potentially by additive enhancement by CI units. We asked how cells that are enhanced by orientation and motion cues respond to stimuli composed of both cues.
We measured the impact of cue combinations on 16 single units that were significantly enhanced by both orientation contrast stimuli and motion contrast stimuli. Of those 16 CI cells, 14 were also significantly enhanced by a stimulus containing both cues. The remaining two cells both exhibited CEI values greater than 0 for the cue combination stimulus, but failed to reach significance. The CEI values corresponding to the 14 units were significantly higher (P<0.01, Mann–Whitney U-test) for the cue combination stimulus than for the most effective individual cue (ie, the greater of the two single-cue CEI values). In Figure 6A, the CEI values for cue combinations are plotted against those for the most effective cue. Notably, most of the data points lie above the unity line, particularly those with the highest CEIs. This observation demonstrates that response rates of cue-invariant neurons are generally enhanced in the presence of multiple cues, supporting the additivity hypothesis. An example of this behavior is shown in the response profile of the CI cell in Figure 6B. For this cell, the firing rates evoked by cue combinations were significantly higher than both single cue firing rates.
 | Figure 6 Cue combination additivity. Notes: (A) Scatterplot comparing CEIs for cue combinations and for the preferred single cue. Most points lie above the unity line. (B) Time course of a CI V2 cell. The cue combination stimulus elicits a significantly greater spike rate than both single-cue stimuli throughout the duration of the response. Shown in the lower panels are the raster plots depicting spikes evoked for all ten trials individually. Abbreviations: CEI, contrast enhancement index; CI, cue-invariant; EFF, effective; FS, feature-specific; Hom, homogeneous; Mot, motion contrast; Ori, orientation contrast; Stim, stimulus. |
Differences in the contextual responses between V1 and V2 units
The existence of neurons that are modulated in a FS manner – either by being responsive to only one cue but not another or by being independently modulated by multiple cues – has important implications. This finding represents a departure from the notion that the signal imparted to early cortical neurons merely reflects the outcome of perceptual segmentation. It might be expected that a signal representing a segmented figure would be modulated in a CI manner, since a segmented texture is itself CI. Instead, our results suggest that extraclassical enhancement could be important for computing feature contrast over a much broader scale than what is available to the cell within its classical receptive field, and that these computations might be confined to only certain feature domains. This discovery helps define a role for early cortical areas in scene segmentation. Of particular interest are the differences we find between V1 and V2. As feedback has been implicated as one of the dominant mechanisms for contextual modulation beyond the classical receptive field,29,30 an understanding of the differences between V1 and one of its most prominent sources of feedback31,32 can potentially describe the role of feedback in scene segmentation.
We primarily find two differences in the contextual responses of neurons in V1 and V2 in our sample. First, the orientation and motion contrast effects are stronger and more prevalent in V2 than in V1. A total of 33% of surround-suppressed neurons in V2 are significantly enhanced by orientation contrast compared to 26% in V1. Similarly, 31% are enhanced by motion contrast in V2 compared to 23% in V1. CEI values in V2 were also consistently higher than in V1. For orientation contrast, median values of 0.24 and 0.17 were found in V2 and V1, respectively, and for motion contrast, 0.23 and 0.19. The differences in the responses to the combination stimulus were even more striking. Nearly twice as many units in V2 were significantly modulated by the combination stimulus than in V1 (54% vs 31%), and median CEI values of 0.50 and 0.35 were found, respectively, in V2 and V1. This stronger effect in V2 was found despite the fact that V2 classical receptive fields were generally not more strongly tuned for orientation and direction than V1. In fact, our V2 sample consisted of a slightly higher proportion of untuned cells than V1 (16% for V1, 20% for V2). While it might be expected that the spatial scale of the center patch could have been more effective at activating V2 neurons than V1 neurons, and was therefore responsible for the discrepancy observed, some evidence suggests otherwise. The size of the center patch was tailored to activate individual neurons maximally. This was very likely achieved, as the distributions of spike rates evoked by the central stimulus presented alone did not differ significantly between the two visual areas (P=0.38, Mann–Whitney U-test). In fact, the median spike rate recorded from our V1 sample was greater than that recorded from V2 (14.4 vs 13.5 spikes/s). Taken together, the data suggest that the stronger modulation observed in V2 is not a byproduct of classical receptive field responsivity or tuning.
The second difference we found between the two areas is that FS response profiles were more prevalent in V1 than in V2. In V1, 13 of the 42 surround-suppressed cells were significantly modulated in only one feature dimension (FS responses, 31.0%), while only four were modulated by cues from both dimensions (CI responses, 9.5%). However, in V2, a smaller proportion of surround-suppressed cells (18 of 66, 27.3%) exhibited FS modulation, while 12 (18.2%) were CI. Therefore, neurons in V1 had a stronger tendency to be modulated by only one feature or the other, while V2 had a much higher incidence of CI responses. We asked whether this finding was merely the result of the higher proportions of orientation and motion contrast responses in V2. One would expect that, if orientation and motion contrast enhancement were more prevalent in V2, then the likelihood of discovering neurons enhanced by both cues would be greater. We performed a simulation to determine the number of CI and FS cells expected by chance, given the number of orientation contrast, motion contrast, and surround-suppressed cells found in V1 and V2. This simulation revealed that in V1 there should be 15.8 FS and 2.6 CI cells, similar to the 13-4 distribution we found. In V2, however, the same analysis predicted 28.7 FS and 6.7 CI cells, a significant departure from the 18-12 distribution that we found (P<0.005, permutation test). This result confirmed that the greater proportion of cue-invariant responses observed in V2 cannot simply be attributed to the increased number of orientation and motion contrast responses in V2, but instead implies a coordinated tendency for V2 neurons to be enhanced by multiple features.
We also considered whether the differences could be the result of a different distribution of orientation and direction tuning between V1 and V2. If cells in V2 were more likely to be tuned to both orientation and direction, for instance, then it is conceivable that they would be capable of CI contextual processing more readily than cells in V1. We found two lines of evidence to suggest that differences in classical receptive field tuning properties were not responsible for the observed results. First, the proportion of cells with classical receptive fields tuned to both orientation and direction were actually slightly greater in V1 than in V2 (16.9%–11.4%). Second, there was no evidence that contextual properties were correlated with classical receptive field tuning properties at all (consistent with the findings from Kastner et al33). Units with orientation- and direction-tuned classical receptive fields each had similar proportions of orientation and motion contrast cells (Ori-tuned units: 33% Ori contrast, 25% Mot contrast; Dir-tuned units: 19% Ori contrast, 19% Mot contrast), indicating that there was no feature bias for either type of tuning. The distribution of orientation and direction tuning strengths, evaluated by vector analysis, as a function of orientation and motion CEIs is shown in Figure 7A. There is very little correlation present in either scatterplot. In fact, there are several instances where high CEI values for one feature corresponded to high tuning strengths in the other feature. In Figure 7B, one such cell is shown (denoted by the arrow in Figure 7A). This cell was strongly orientation-tuned but not direction-tuned, yet it was modulated by motion contrast and not orientation contrast. Although this cell was not tuned for direction, it was capable of discriminating between motion contrast stimuli and homogeneous fields. Despite its sharp orientation tuning, however, it was unable to encode orientation contrast stimuli. Altogether, these results make it unlikely that differences in the classical receptive field tuning properties between V1 and V2 cells could account for the disparity in the prevalence of FS cells in the two areas.
 | Figure 7 Classical receptive field tuning does not determine extraclassical behavior. Notes: (A) Orientation and direction tuning strengths as a function of CEI value for units significantly enhanced by orientation contrast (Ori) and motion contrast (Mot), as well as units that are not significantly modulated by either feature (generally suppressive). Orientation and direction tuning strengths are computed as the normalized magnitude of the tuning vector. (B) An orientation-tuned motion contrast-enhanced cell. (Left polar plot) Orientation tuning profile for the cell denoted by the arrow in (A). The direction of the vector in the center indicates the preferred orientation of the cell. Its length represents the strength of tuning, analogous to the vector sum of the spike rates in each direction tested (0°–135°, increments of 45°). Since this cell is orientation-tuned, the vector is nonzero. (Right polar plot) Direction tuning profile for the same cell. Since this cell is not tuned for direction, the vector produced is very close to zero and therefore not shown. (Right panel) The response of this cell to full-field homogeneous (Hom), orientation contrast (Ori), and motion contrast (Mot) conditions. The responses are normalized by the mean spike rate evoked by the center-alone condition. The homogeneous condition suppresses the firing rate of this cell to 59% of its center-alone value. The orientation contrast condition does not significantly reduce the suppression, but the motion contrast condition does (*P<0.01, Mann–Whitney U-test). Abbreviations: CEI, contrast enhancement index; GS, generally suppressive. |
Discussion
Cue combinations are known to enhance discriminability,13 reduce reaction times,34 and increase the salience of pop-out elements in an array.17 To this point, the precise locus in which independent cues are merged and contribute to the single CI percept is not known. Our findings reveal that cue combinations activate cortical areas as early as V1 in a much different way than a single cue alone. Based on the widespread presence of FS units, we surmised that increased enhancement to cue combinations would be present in the population as a whole, arising as the natural consequence of feature specificity. In addition, we found that individual cues presented in combinations independently influenced single cells responsive to both, potentially contributing to the psychophysical facilitations that have been discussed.
The implication from our findings is that, even at the level of the single cell, a feature specificity exists by virtue of the independent actions that each cue has on the behavior of the cell. The observation that the introduction of either cue independently affects the firing rate of dually activated cells implies that the information imparted to and computed by these cells operates, in large part, independently within different feature domains. Nothdurft referred to such behavior within the context of the “overlap between [feature-specific] mechanisms,”17 and that this overlap could be described as a function of the amount of nonlinearity in the response. If cue combinations failed to enhance the response beyond that of their component cues alone, the mechanisms responsible for each cue would be considered wholly overlapping. That is, the same mechanism could be responsible for enhancement within either feature domain. At the other extreme, if the response to cue combinations was the linear combination of the two single-cue responses, the mechanisms responsible for enhancement of the individual cues would be considered completely independent of one another.
Relation to previous studies
Properties similar to those reported here have been observed in area V1 of the monkey3 and area 17 of the cat.33 Both studies identified cells that were modulated by some features more strongly than others, similar to our characterization of feature specificity, although both groups reported vastly different proportions. Kastner et al reported that a large proportion of cells in their sample of 119 area 17 neurons exhibited feature specificity: 11% were enhanced only by orientation contrast, 25% only by motion contrast, and an additional 11% were enhanced by both features.8 While the overall proportion of FS to CI responses was somewhat similar in the cat to those reported here, there appeared to be a clear bias in favor of motion contrast in their sample. We, on the other hand, show more even proportions. This could be the result of the fact that the classical receptive fields were stimulated differently in their orientation and motion tests (the former consisted of static displays), perhaps resulting in diminished modulatory activity for orientation contrast conditions. Alternatively, it could simply indicate a fundamental difference between species.
Zipser et al recorded from 64 sites in V1 of the awake monkey using multiple cues.3 They reported a very large proportion of single units (61%) that were enhanced by at least one of the five different cues they tested but were not equivalently enhanced by all cues. It is difficult to compare their results with ours, as they described feature specificity in a much more liberal way by including cells in the group that were significantly modulated by all cues but to different extents. Nevertheless, their results clearly indicate differential activity between stimulus conditions that differed primarily between the cues present (although there were some shared cues among the conditions, as their chosen stimulus prevented them from isolating individual cues). We have extended their results by introducing a stimulus that evoked cue-specific segmentation and describing the lack of responsivity to some cues, expanding on the idea of differential activity to include a full FS property exhibited by some cells. We find that several neurons are simply unaffected by feature contrast within particular feature domains, despite being enhanced by a stimulus that ultimately evokes the same percept but via cues in a different feature domain.
In the same paper, these authors also examined the effect of combining cues across multiple feature dimensions and found that cue combinations failed to evoke greater responses in most cells than the strongest single cue. However, their single-cue stimuli were in fact composed of several different cues (eg, some of their stimuli included phase discontinuities, which can serve as cues through the alignment of discontinuities), giving rise to the possibility that their tests were not confined to specific feature channels. This may have had the effect of introducing redundant cues in different stimulus conditions, potentially veiling strong differences between cue combination and single-cue responses. Furthermore, their analysis was applied to all cells in their sample, whether or not they exhibited any modulatory effects, whereas we looked only at cells that were modulated by the extraclassical surround (determined by whether or not they were significantly suppressed by homogeneous fields). By pooling the responses of all cells, the cue combination responses that they observed may have been further diluted.
Electrophysiological responses to cue combinations in other feature dimensions
Previous work has examined the neuronal underpinnings of perceptual pop-out within different isolated feature dimensions – specifically, orientation and luminance.11 Like our experimental paradigm, these authors measured single-unit responses to oriented line segments that differed from an array of elements in the surround region by either single cues or cue combinations. They discovered that cue combinations within these feature dimensions failed to produce increased enhancement in the pooled firing rates of 43 superficial V1 neurons in monkeys. Their results imply that not only are cells equally responsive to the combination of orientation and luminance cues than to either cue alone but also that cells do not exhibit FS responses within these two feature domains. Recall that the consequence of feature specificity is that the averaged population response becomes more enhanced to cue combinations because both groups of FS cells are simultaneously activated. However, they refer to their own previous results,35 where the response to the combination of orientation and color cues exhibits linear summation. In contrast, our results in the orientation and motion domains exhibit sublinear summation properties. Their findings, together with ours, suggest that different cue combinations exhibit different degrees of enhancement, which in turn implies that cues within different feature domains operate within partially overlapping (orientation/motion), wholly overlapping (orientation/luminance), or nonoverlapping (orientation/color) channels.
Nothdurft17 reached a similar conclusion based on psychophysics. The salience of single bars embedded in homogeneous arrays (nearly identical in structure to the stimuli in the study by van der Smagt et al11) was measured in human observers as a function of the cue that produced it. When pairs of cues within different feature dimensions were used, salience was generally increased but only sublinearly, and to different extents based on the choice of cue pairing. Nothdurft concluded that FS mechanisms overlap to different extents, and reasoned that the most linear responses corresponded to the least amount of channel overlap. Based on these results, he concluded that orientation and motion mechanisms strongly overlapped (estimating roughly 50% shared processing). Curiously, he found that orientation and luminance cues only weakly overlapped in their effectiveness, while orientation and color cues showed the strongest overlap among the cues he tested – perceptual properties that are opposite to the behavior of single units reported by van der Smagt et al. This apparent discrepancy is a potential avenue for future investigation.
Contour and surface encoding
Marcus and Van Essen36 revealed contextual modulation in both areas V1 and V2 in monkeys, demonstrating that figure–ground arrangements defined by orthogonal orientations or by aligned line discontinuities both evoked enhanced responses within the population of cells they tested. They found two particularly noteworthy properties in the mean response of their sample. First, modulation tended to be stronger in V2 than in V1 for both conditions tested. This finding is similar to our results that showed stronger and more prevalent modulation in V2 than in V1. Second, these authors showed that both cues enhanced cell responses, but that the orientation-based cue was, on average, more effective than the cue based on aligned discontinuities. Electroencephalography source imaging reveals a similar tendency.37 It is possible that orientation is simply a stronger cue than the phase discontinuity cue. However, it is worth examining the stimuli more closely. Marcus and Van Essen used concentric line gratings for both conditions tested. The phase discontinuity cue was introduced by simply shifting the phase of the grating within the center patch relative to the surround region so that the border between the two regions was revealed by the break in the line. An illusory contour is thus formed by virtue of the alignment of the discontinuities. Conversely, the orientation cue was produced by the difference in orientation between center and surround. In addition to orientation, this condition also contains aligned discontinuity effects because the edges of the center patch end in abrupt line terminations aligned to form a contour. Therefore, it is possible that the stronger enhancement observed for this condition could have been the result of the summation of independent cues – one based on orientation and the other on aligned discontinuities – consistent with our cue combination enhancement experiments.
Furthermore, these two cues act in very different ways. The phase cue operates solely on the contours of the figure; the only information signifying the presence of two distinct regions exists at their boundary.38 Orientation contrast, on the other hand, permeates the entire figure and background regions. Information at any point within this image, including the boundaries, has the potential of signaling the difference between the center patch and the surround region. This becomes an issue of boundary versus surface encoding. Grinvald et al39 showed, using optical imaging with the aid of high-temporal-resolution voltage-sensitive dyes, that information arising from a contour, absent any distinguishing surface features, creates a wavefront of activation that laterally spreads into the figural region. The cues in Marcus and Van Essen’s experiment potentially acted through two different streams of neuronal activation – one underlying the contour and slowly activating the interior as in Grinvald’s experiment, and another originating within the figure interior itself. There is some behavioral evidence in support of this idea. Harrison and Keeble40 discovered that information present within the figure interior can facilitate detection, even when that information alone is not required to correctly distinguish figure from ground.
To further expand on this idea, it has been hypothesized that illusory contours of this form are produced from the convergence of aligned end-stopped cells in V1 onto their V2 targets,41 which integrate the signals of the V1 constituents and produce a response in V2 indistinguishable from that of a real contour.42,43 This has provided support for the general finding that illusory contour responses are present in V2, but not V1 (but refer Sheth et al44). However, Marcus and Van Essen’s results show that figure–ground configurations formed from aligned discontinuities can modulate cells at the level of V1 through their extraclassical surrounds. This could be the result of feedback originating from V2 cells responsive to illusory contours onto their V1 targets. Therefore, Marcus and Van Essen’s results may not have been merely a difference in the precise cue used, or even the result of the more effective stimulus being composed of multiple cues. Instead, the different response properties they observed could have been the outcome of two entirely different mechanisms.
We avoided this ambiguity in our experiments by choosing cues that were based on the texture properties themselves rather than strictly the geometry of the transition between regions. Orientation and motion contrast effects are considered to operate by similar mechanisms45 and, according to our results, in similar quantities and strengths in V1. Although our results do not provide any information about contour processing (and, in fact, do not necessarily require the explicit representation of contours at any point in the processing chain), they have provided insight into the role of discontinuities between the different features that make up the statistics of adjacent surfaces. From a circuitry standpoint, we suspect that segmentation by surface properties uses conserved mechanisms that operate (at least partially) within distinct FS channels.
Similarity between cortical responses and percept
Several studies have attempted to tie together the contextual modulations observed at the level of V1 and the perceptual capabilities of the visual system to perform surface segmentation. In a series of studies,46–49 one group demonstrated that the contextual properties of V1 cells are a strong predictor of the ability of a monkey to detect texture figures presented on a background. These authors found a striking correlation between the strength of the contextual response of cells and the monkey’s performance. This has led many to speculate that the modulatory properties observed in V1 cells reflect a top-down influence originating in higher cortical areas that informs V1 of the salience of the figure in preparation of making a saccade. This attributes to V1 a more passive role in surface segmentation.
FS contextual responses are significant as they relate to surface segmentation, because their existence implies that cells in V1 may not be signaling segmentation, per se, but instead are involved in the computation of feature contrast, which serves as a necessary building block for segmentation. This conclusion is consistent with the observation made by Hegdé and Felleman50 that single units in V1 respond differently to conjunction stimuli than to uniform fields, even though this stimulus configuration does not evoke perceptual “pop out”. Their demonstration, like ours, serves as evidence that the salience of the figure and the behavior of single units are not entirely correlated.
Curiously, V2 cells tended to respond in a less FS manner than V1 cells. This is an important observation because V2 serves as one of the primary sources of feedback to V1, and is generally considered to be “downstream” in the visual hierarchy.51 If feedback mechanisms are at least partially responsible for contextual modulation in lower visual areas, then it is reasonable to assume that V2 units may be imparting substantial contextual information to V1 cells. Since FS cells are less prevalent in V2, then a certain amount of feature specificity in V1 is not coming from the information imparted to the cell but rather from computations performed by the cell. In other words, V1 cells are likely filtering out certain information available to them. Alternatively, only a subset of V2 cells could be providing feedback to area V1, in which FS units in V2 preferentially provide a contextual influence to V1 cells. These two alternatives are candidates for further exploration.
The effect of anesthesia on the observations reported
The experiments described here were performed in anesthetized macaque monkeys. Anesthesia is well known to substantially affect single unit contextual responses in areas V1 and V2.52 Nevertheless, we feel that the results obtained describe an intrinsic cortical mechanism serving as a crucial stage of the global analysis of scenes important for image segmentation and the extraction of figure from ground. Other studies have also described contextual modulation in anesthetized animals.28,53 The appearance of modulatory effects even in anesthetized animals demonstrates not only that the state of the animal is incapable of stifling the ability of early cortical neurons from responding preferentially to figures defined by orientation or motion but also that this function does not require attention. Attention may in fact play a role in the contextual responses of early cortical cells,54–57 but many reports have found that it is not a necessary component.36,58,59 This is in contrast to results described in area V4, where the allocation of attention elsewhere in the visual field completely eliminates similar forms of enhancement.60
Acknowledgments
The authors thank Dorothy Joiner and Sandra McGillis for technical support and Anthony Norcia for helpful comments on the manuscript.
Author contributions
Both MDZ and DYT designed and performed the experiments; MDZ analyzed the data and drafted the manuscript; both the authors revised the manuscript and approved the final version.
Disclosure
The authors report no conflicts of interest in this work.
References
Hupé JM, James AC, Girard P, Lomber SG, Payne BR, Bullier J. Feedback connections act on the early part of the responses in monkey visual cortex. J Neurophysiol. 2001;85(1):134–145. | ||
Hupé JM, James AC, Payne BR, Lomber SG, Girard P, Bullier J. Cortical feedback improves discrimination between figure and background by V1, V2 and V3 neurons. Nature. 1998;394(6695):784–787. | ||
Zipser K, Lamme VA, Schiller PH. Contextual modulation in primary visual cortex. J Neurosci. 1996;16(22):7376–7389. | ||
Li CY, Lei JJ, Yao HS. Shift in speed selectivity of visual cortical neurons: a neural basis of perceived motion contrast. Proc Natl Acad Sci U S A. 1999;96(7):4052–4056. | ||
Lamme VA. The neurophysiology of figure-ground segregation in primary visual cortex. J Neurosci. 1995;15(2):1605–1615. | ||
Bakin JS, Nakayama K, Gilbert CD. Visual responses in monkey areas V1 and V2 to three-dimensional surface configurations. J Neurosci. 2000;20(21):8188–8198. | ||
Li CY, Li W. Extensive integration field beyond the classical receptive field of cat’s striate cortical neurons – classification and tuning properties. Vision Res. 1994;34(18):2337–2355. | ||
Kastner S, Nothdurft HC, Pigarev IN. Neuronal correlates of pop-out in cat striate cortex. Vision Res. 1997;37(4):371–376. | ||
Akasaki T, Sato H, Yoshimura Y, Ozeki H, Shimegi S. Suppressive effects of receptive field surround on neuronal activity in the cat primary visual cortex. Neurosci Res. 2002;43(3):207–220. | ||
Bach M, Meigen T. Electrophysiological correlates of human texture segregation, an overview. Doc Ophthalmol. 1998;95(3–4):335–347. | ||
van der Smagt MJ, Wehrhahn C, Albright TD. Contextual masking of oriented lines: interactions between surface segmentation cues. J Neurophysiol. 2005;94(1):576–589. | ||
Nothdurft HC. Feature analysis and the role of similarity in preattentive vision. Percept Psychophys. 1992;52(4):355–375. | ||
Croner LJ, Albright TD. Image segmentation enhances discrimination of motion in visual noise. Vision Res. 1997;37(11):1415–1427. | ||
Krummenacher J, Müller HJ, Heller D. Visual search for dimensionally redundant pop-out targets: evidence for parallel-coactive processing of dimensions. Percept Psychophys. 2001;63(5):901–917. | ||
Krummenacher J, Müller HJ, Heller D. Visual search for dimensionally redundant pop-out targets: parallel-coactive processing of dimensions is location specific. J Exp Psychol Hum Percept Perform. 2002;28(6):1303–1322. | ||
Morgan MJ. Positional acuity without monocular cues. Perception. 1986;15(2):157–162. | ||
Nothdurft H. Salience from feature contrast: additivity across dimensions. Vision Res. 2000;40(10–12):1183–1201. | ||
Bach M, Schmitt C, Quenzer T, Meigen T, Fahle M. Summation of texture segregation across orientation and spatial frequency: electrophysiological and psychophysical findings. Vision Res. 2000;40(26):3559–3566. | ||
Gur M, Beylin A, Snodderly DM. Physiological properties of macaque V1 neurons are correlated with extracellular spike amplitude, duration, and polarity. J Neurophysiol. 1999;82(3):1451–1464. | ||
Zarella MD, Ts’o DY. An automated approach to spike sorting using a discontinuity measure. Abstract presented at: 2009 Neuroscience Meeting Planner: Society for Neuroscience; October 21; 2009; Chicago, IL. | ||
Adelson EH, Farid H, Lee S-H, Blake R. Filtering reveals form in temporally structured displays. Science. 1999;286(5448):2231. | ||
Cai D, DeAngelis GC, Freeman RD. Spatiotemporal receptive field organization in the lateral geniculate nucleus of cats and kittens. J Neurophysiol. 1997;78(2):1045–1061. | ||
Jones JP, Palmer LA. The two-dimensional spatial structure of simple receptive fields in cat striate cortex. J Neurophysiol. 1987;58(6):1187–1211. | ||
Wuerger S, Shapley R, Rubin N. “On the visually perceived direction of motion” by Hans Wallach: 60 years later. Perception. 1996;25(11):1317–1367. | ||
Gallant JL, Essen DCV, Nothdurft HC. Two-dimensional and three-dimensional texture processing in visual cortex of the macaque monkey. In: Papathomas TV, Chubb C, editors. Early Vision and Beyond. Cambridge, MA: Massachusetts Institute of Technology; 1995:89–98. | ||
Lee TS, Mumford D, Romero R, Lamme VA. The role of the primary visual cortex in higher level vision. Vision Res. 1998;38(15–16):2429–2454. | ||
Walker GA, Ohzawa I, Freeman RD. Suppression outside the classical cortical receptive field. Vis Neurosci. 2000;17(3):369–379. | ||
Nothdurft HC, Gallant JL, Van Essen DC. Response modulation by texture surround in primate area V1: correlates of “popout” under anesthesia. Vis Neurosci. 1999;16(1):15–34. | ||
Bair W, Cavanaugh JR, Movshon JA. Time course and time-distance relationships for surround suppression in macaque V1 neurons. J Neurosci. 2003;23(20):7690–7701. | ||
Ichida JM, Schwabe L, Bressloff PC, Angelucci A. Response facilitation from the “suppressive” receptive field surround of macaque V1 neurons. J Neurophysiol. 2007;98(4):2168–2181. | ||
Rockland KS, Virga A. Terminal arbors of individual “Feedback” axons projecting from area V2 to V1 in the macaque monkey: a study using immunohistochemistry of anterogradely transported Phaseolus vulgaris-leucoagglutinin. J Comp Neurol. 1989;285(1):54–72. | ||
Budd JM. Extrastriate feedback to primary visual cortex in primates: a quantitative analysis of connectivity. Proc Biol Sci. 1998;265(1400):1037–1044. | ||
Kastner S, Nothdurft HC, Pigarev IN. Neuronal responses to orientation and motion contrast in cat striate cortex. Vis Neurosci. 1999;16(3):587–600. | ||
Koene AR, Zhaoping L. Feature-specific interactions in salience from combined feature contrasts: evidence for a bottom-up saliency map in V1. J Vis. 2007;7(7):6.1–14. | ||
van der Smagt MJ, Wehrhahn C, Albright TD. Contextual masking effects of color and orientation on Macaque V1 responses. Paper presented at: Society for Neuroscience; 2002; Washington, DC. | ||
Marcus DS, Van Essen DC. Scene segmentation and attention in primate cortical areas V1 and V2. J Neurophysiol. 2002;88(5):2648–2658. | ||
Appelbaum LG, Wade AR, Pettet MW, Vildavski VY, Norcia AM. Figure-ground interaction in the human visual cortex. J Vis. 2008;8(9):8.1–19. | ||
Spillmann L, Werner JS. Long-range interactions in visual perception. Trends Neurosci. 1996;19(10):428–434. | ||
Grinvald A, Lieke EE, Frostig RD, Hildesheim R. Cortical point-spread function and long-range lateral interactions revealed by real-time optical imaging of macaque monkey primary visual cortex. J Neurosci. 1994;14(5 pt 1):2545–2568. | ||
Harrison SJ, Keeble DR. Within-texture collinearity improves human texture segmentation. Vision Res. 2008;48(19):1955–1964. | ||
Peterhans E, von der Heydt R. Mechanisms of contour perception in monkey visual cortex. II. Contours bridging gaps. J Neurosci. 1989;9(5):1749–1763. | ||
Ramsden BM, Hung CP, Roe AW. Real and illusory contour processing in area V1 of the primate: a cortical balancing act. Cereb Cortex. 2001;11(7):648–665. | ||
von der Heydt R, Peterhans E. Mechanisms of contour perception in monkey visual cortex. I. Lines of pattern discontinuity. J Neurosci. 1989;9(5):1731–1748. | ||
Sheth BR, Sharma J, Rao SC, Sur M. Orientation maps of subjective contours in visual cortex. Science. 1996;274(5295):2110–2115. | ||
Nothdurft HC. The conspicuousness of orientation and motion contrast. Spat Vis. 1993;7(4):341–363. | ||
Supèr H, Spekreijse H, Lamme VA. Two distinct modes of sensory processing observed in monkey primary visual cortex (V1). Nat Neurosci. 2001;4(3):304–310. | ||
Supèr H, Spekreijse H, Lamme VA. Figure-ground activity in primary visual cortex (V1) of the monkey matches the speed of behavioral response. Neurosci Lett. 2003;344(2):75–78. | ||
Supèr H, van der Togt C, Spekreijse H, Lamme VA. Internal state of monkey primary visual cortex (V1) predicts figure-ground perception. J Neurosci. 2003;23(8):3407–3414. | ||
Lamme VA, Zipser K, Spekreijse H. Masking interrupts figure-ground signals in V1. J Cogn Neurosci. 2002;14(7):1044–1053. | ||
Hegdé J, Felleman DJ. How selective are V1 cells for pop-out stimuli? J Neurosci. 2003;23(31):9968–9980. | ||
Felleman DJ, Van Essen DC. Distributed hierarchical processing in the primate cerebral cortex. Cereb Cortex. 1991;1(1):1–47. | ||
Lamme VA, Zipser K, Spekreijse H. Figure-ground activity in primary visual cortex is suppressed by anesthesia. Proc Natl Acad Sci U S A. 1998;95(6):3263–3268. | ||
Webb BS, Tinsley CJ, Barraclough NE, Parker A, Derrington AM. Gain control from beyond the classical receptive field in primate primary visual cortex. Vis Neurosci. 2003;20(3):221–230. | ||
Casco C, Grieco A, Campana G, Corvino MP, Caputo G. Attention modulates psychophysical and electrophysiological response to visual texture segmentation in humans. Vision Res. 2005;45(18):2384–2396. | ||
Cheal M, Lyon DR. Allocation of attention in texture segregation, visual search, and location-precuing paradigms. Q J Exp Psychol A. 1994;47(1):49–70. | ||
Heinrich SP, Andrés M, Bach M. Attention and visual texture segregation. J Vis. 2007;7(6):6. | ||
Hindi Attar C, Hamburger K, Rosenholtz R, Götzl H, Spillmann L. Uniform versus random orientation in fading and filling-in. Vision Res. 2007;47(24):3041–3051. | ||
Appelbaum LG, Norcia AM. Attentive and pre-attentive aspects of figural processing. J Vis. 2009;9(11):18.11–12. | ||
Scholte HS, Witteveen SC, Spekreijse H, Lamme VAF. The influence of inattention on the neural correlates of scene segmentation. Brain Res. 2006;1076(1):106–115. | ||
Burrows BE, Moore T. Influence and limitations of popout in the selection of salient visual stimuli by area V4 neurons. J Neurosci. 2009;29(48):15169–15177. |
Supplementary material
 | Figure S1 Response of a feature-specific cell in V1. Notes: PSTHs depict spikes for all trials of the condition specified on the left of each row with a center direction specified at the top of each column. Bar orientation within the central region was 45 degrees for all conditions. The histogram on the right represents the mean spike rates (blank subtracted) summed over all directions. The histogram at the bottom represents the mean spike rates of the Ctr condition only, illustrating the direction-tuning properties of the cell. Mot stimuli evoked increases in firing rates in comparison to the Hom stimulus for all four center directions tested. Abbreviations: Ctr, center-alone; Hom, homogeneous; Ori, orientation contrast; Mot, motion contrast; Ann, annulus; PSTHs, peri-stimulus time histograms. |
 © 2016 The Author(s). This work is published and licensed by Dove Medical Press Limited. The
full terms of this license are available at https://www.dovepress.com/terms
and incorporate the Creative Commons Attribution
- Non Commercial (unported, 3.0) License.
By accessing the work you hereby accept the Terms. Non-commercial uses of the work are permitted
without any further permission from Dove Medical Press Limited, provided the work is properly
attributed. For permission for commercial use of this work, please see paragraphs 4.2 and 5 of our Terms.
© 2016 The Author(s). This work is published and licensed by Dove Medical Press Limited. The
full terms of this license are available at https://www.dovepress.com/terms
and incorporate the Creative Commons Attribution
- Non Commercial (unported, 3.0) License.
By accessing the work you hereby accept the Terms. Non-commercial uses of the work are permitted
without any further permission from Dove Medical Press Limited, provided the work is properly
attributed. For permission for commercial use of this work, please see paragraphs 4.2 and 5 of our Terms.