Back to Journals » HIV/AIDS - Research and Palliative Care » Volume 11
Covariate random effects on the CD4 count variation during HIV disease progression in women
Authors Tinarwo P ![]() , Zewotir T
, Zewotir T ![]() , North D
, North D
Received 8 November 2018
Accepted for publication 5 February 2019
Published 20 May 2019 Volume 2019:11 Pages 119—131
DOI https://doi.org/10.2147/HIV.S193652
Checked for plagiarism Yes
Review by Single anonymous peer review
Peer reviewer comments 2
Editor who approved publication: Professor Bassel Sawaya
Partson Tinarwo, Temesgen Zewotir, Delia North
School of Mathematics, Statistics and Computer Science, University of KwaZulu-Natal, Durban, South Africa
Purpose: To investigate the variation in CD4 count between HIV positive patients due to clinical covariates at each phase of the HIV disease progression.
Patients and methods: The Centre for the AIDS Programme of Research in South Africa (CAPRISA) conducted different studies in which female patients were initially enrolled in HIV negative cohorts (phase 1). Seroconverts were further followed-up weekly to fortnightly visits up to 3 months (phase 2: acute infection), monthly visits from 3 to 12 months (phase 3: early infection), quarterly visits thereafter (phase 4: established infection) until antiretroviral therapy (ART) initiation (phase 5).
Results: Eighteen out of the 46 CD4 count covariates investigated were significant. Low average CD4 counts at acute and early phase entry improved at a faster rate than entries at higher average CD4 count. During therapy, all the 18 covariates induced significantly different patients’ average CD4 counts. The rate of change of CD4 count greatly varied in response to lactate dehydrogenase during the acute phase. Red blood cells increase resulted in the patients’ CD4 counts approaching a common higher level during the early phase. During therapy, the already high CD4 counts improved faster than lower ones in response to the red blood cells increase. As the monocytes increased, patients with lower average CD4 counts became worse than those with higher average CD4 counts.
Conclusion: Changes in the covariates measurements either induced no variation effects in certain phases or improved the CD4 count at a faster rate for those patients whose average CD4 was already high or worsen the CD4 level which was already low or caused the patients’ CD4 counts to approach the same level – higher or lower than the general cohort. The studied covariates induced wide variations in the CD4 count between HIV positive patients during the ART phase.
Keywords: parallel plot, redundant features, partial least squares, mixOmics, mixed models, between variation
Introduction
A human body is a complex machine that usually responds automatically to the changing internal and outside environments.1 Although there are measurement reliabilities2,3 in recording patient information, by nature, the repeated measurements from the same individual are bound to vary. Inasmuch as this variation exists within an individual and so does between any two given individuals. Regardless of this inter-individual variation, the health care fraternity generally administers an average dose of medication to patients irrespective of their differences in either the body tolerances, specific needs, or preferred medical treatment. However, there ought to be some medical measurements that are likely to remain fairly the same across patients whilst others greatly fluctuating to bring about the individual or time uniqueness. There is a need to understand these components that vary widely among individuals to streamline the focus areas in providing specific treatment needs during patients’ care.
Cohort studies,4,5,6 especially in the context of HIV/AIDS, commonly record the CD4 cell count, the prime target of HIV,7 for monitoring the HIV disease progression,8 and hence the CD4 count being regarded as a health indicator.8 Alongside the CD4 count, many other covariates have also been recorded and these include the full blood count,9–15 lipids,16–18 sugar,19–21 blood chemistry,10,22–39 and clinical examination.40–49 However, an evaluation to determine the clinical covariates that bring the variation in the CD4 count between HIV patients during the disease progression has not been well documented. This gives an insight on the potential to manipulate and incorporate these influential CD4 count covariates to streamline the pathway to tailored medical attention for HIV-infected individuals at a specific HIV infection phase.
Previously, the associations of these covariates with the CD4 count have been analyzed with statistical methods that ranged from Pearson or Spearmen correlation analysis,50,51 sensitivity, specificity and positive prediction,52,53 linear regression54,55 multivariate regression,18 logistic regression,26,45 Chi-Square tests,28,29,56 non-parametric tests,34,39 independent student t-tests,57,58 confidence intervals,40 the analysis of variance59,60 to generalized estimating equations.27 Their limitations include the inability to give the covariates an opportunity to compete in a single multidimensional model to identify the most influential ones and consequently assessing their effects on the CD4 count variation.
This study aimed to pool the covariates from five clinical platforms in order to identify the ones that bring the CD4 count variation between HIV positive patients at each phase of the HIV disease progression. Our first objective was to minimize multicollinearity among the covariates by using correlation analysis and the application of partial least squares as a multidimensional analysis approach to obtain the most salient CD4 covariates. A mixed model approach was then applied as the second objective to investigate the CD4 count variation between HIV positive patients in response to the covariate induced random effects using the data from CAPRISA studies.
Materials and methods
The study design
The CAPRISA 002 enrolled 245 HIV negative (Phase I: pre-HIV infection) female sex workers into an Acute Infection study. The establishment of the acute infection study, cohort screening and seroconverts; routine evaluation procedures, CAPRISA–participant interaction, and data management have been previously documented,61 and was conducted in accordance with the Declaration of Helsinki. The study protocol and informed consent documents were reviewed and approved by the local ethics committees of the University of KwaZulu-Natal, the University of Cape Town, the University of the Witwatersrand in Johannesburg, and by the Prevention Sciences Review Committee (PSRC) of the Division of AIDS (DAIDS, National Institutes of Health, USA). The consent forms were translated into vernacular language, isiZulu and written informed consent obtained at each stage of the study. All the minors, under the age of 18 years were excluded from the study as part of the screening procedure. The HIV negative cohort was followed up and upon HIV infection, they were further followed-up weekly to fortnightly visits up to 3 months (Phase II: acute infection), monthly visits from 3 to 12 months (Phase III: early infection), quarterly visits thereafter (Phase IV: established infection) until antiretroviral therapy (ART) initiation (Phase V). Eventually, 27 seroconversions were recorded at the end of the study of an average period of 4.5 years. In addition to the 27 seroconverts, 210 more patients who seroconverted from other CAPRISA studies were also enrolled and similarly followed up postinfection from acute to ART phase. Figure 1 summarizes how the total sample size of 237 seroconverts for this study was obtained.
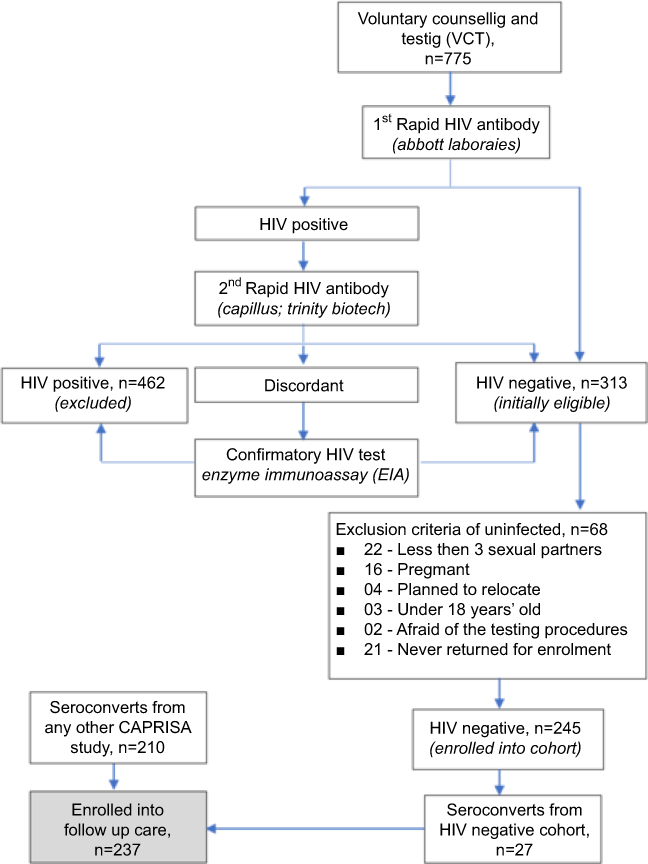 | Figure 1 The recruitment of the 237 study participants. The HIV negative cohort screening involved 775 voluntary potential candidates of which 462 were already HIV positive and 313 initially eligible. Of the 313 HIV negative, only 245 were enrolled and the rest excluded for various reasons according to the eligibility criteria. Eventually, 27 out of the 245 seroconverted and enrolled into follow-up care. Seroconverts from other CAPRISA studies (210) were also included in the follow-up care that resulted in a total of 237 patients for this study. |
The data
Table 1 shows the studied repeated number of measurements per individual at each phase. Four-time points prior to each phase transition were selected and that resulted in a total of 16 repeated measurements being investigated for each patient. The baseline, pre-HIV (Phase I) repeated measurements were scarce and hence, this study focused on Phases II–V only. The CD4 count is the response variable and the routinely collected information on the covariates (c1–c46) consists of full blood count, biochemistry, sugar, lipids, physical examination, and anthropometric measurements. The raw data for the study are available as Supplementary material (
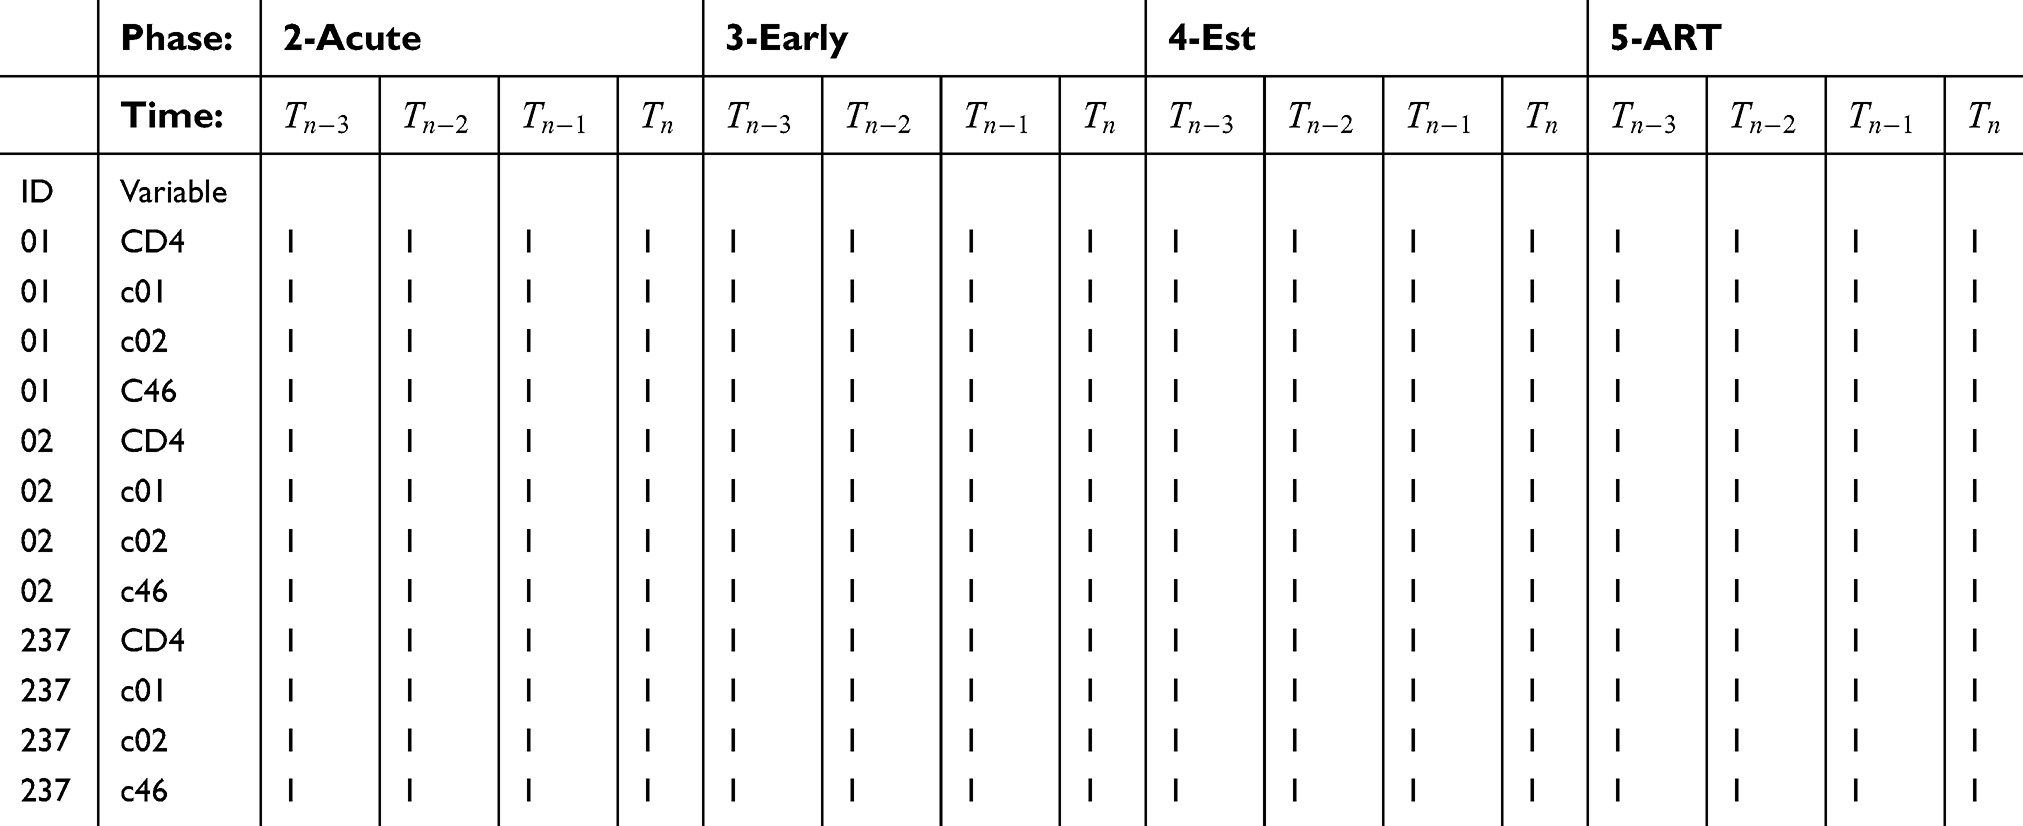 | Table 1 The studied number of repeated measurements per individual |
Statistical analysis
The statistical analysis first considered a parallel plot overview of the variations in the repeated measurements around their respective means within each phase followed by dropping off of redundant features. This involved dropping off the variables with the highest mean absolute correlation using the find correlation function at the initial variable reduction stage and then another further second variable reduction stage involving the selection of the important variables using the PLS with the application of the split function in the library mixOmics. The library mixOmics is capable of handling the complex structure of repeated measurements and incorporates a design matrix to account for variation in the multilevel structure of the longitudinal data. Both the variable reduction functions were used in open source R software, version 3.5.0. Finally, a mixed model was applied using SAS 9.4 PROC HPMIXED and PROC MIXED to a reduced set of the CD4 count covariates. The model with an unstructured variance was appropriate to estimate the intercept-slope covariance and the repeated measurements took an autoregressive moving average correlation structure of [ARMA (1,1)]. Each covariate in the reduced set of the covariates was mean centered to obtain the intercepts for the average patient and scaled for estimates comparison.
Results
The variations in the cohort’s repeated measurements
Around the mean within each phase were presented in a parallel plot for phase comparison (Figure 2). The greatest variation in the CD4 count was observed during the established phase and the lowest during therapy. The higher CD4 count variation was associated with the highest variation in all the white blood cells. However, when the CD4 count varied the least during the ART phase, there was a corresponding low variation in all the red blood cell count components. Our data seem to show complex relationships and variations in the CD4 count and its covariates during the different phases of the HIV disease progression.
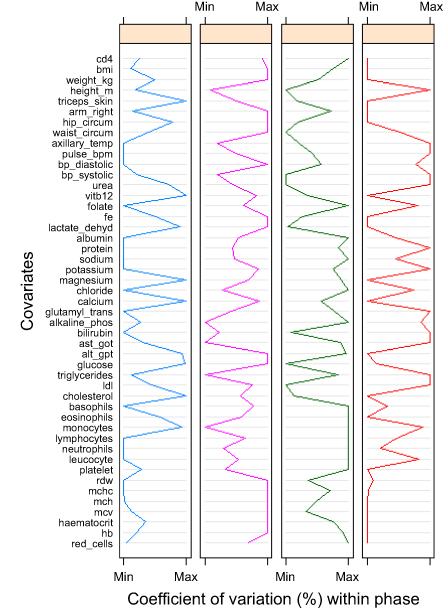 | Figure 2 The coefficients of variation (CV). The CVs give information about the spread of the repeated measurements around the mean. The colour codes represent Phase II (blue), Phase III (pink), Phase IV (green) and Phase V (red). Abbreviations: BMI, body mass indixex; bp, blood pressure; ALT_GPT, Alamine Aminotransferase_Glutamate Pyruvate Transaminase; AST_GOT, Aspartate Aminotransferase_Glutamate Oxaloactate Transaminase; LDL, Low density lipoprotein; RDW, red blood cell distribution width; MCHC, mean corpuscular haemoglobin concentration; MCH, mean corpuscular haemoglobin; MCV, mean corpscular volume; Hb, haemoglobin. |
Variable reduction
The results showed that of the 46 covariates that were available for investigation,18 were found to be the strongest and none of these were from lipids, physical examination nor anthropometric category (
General trends within the phase
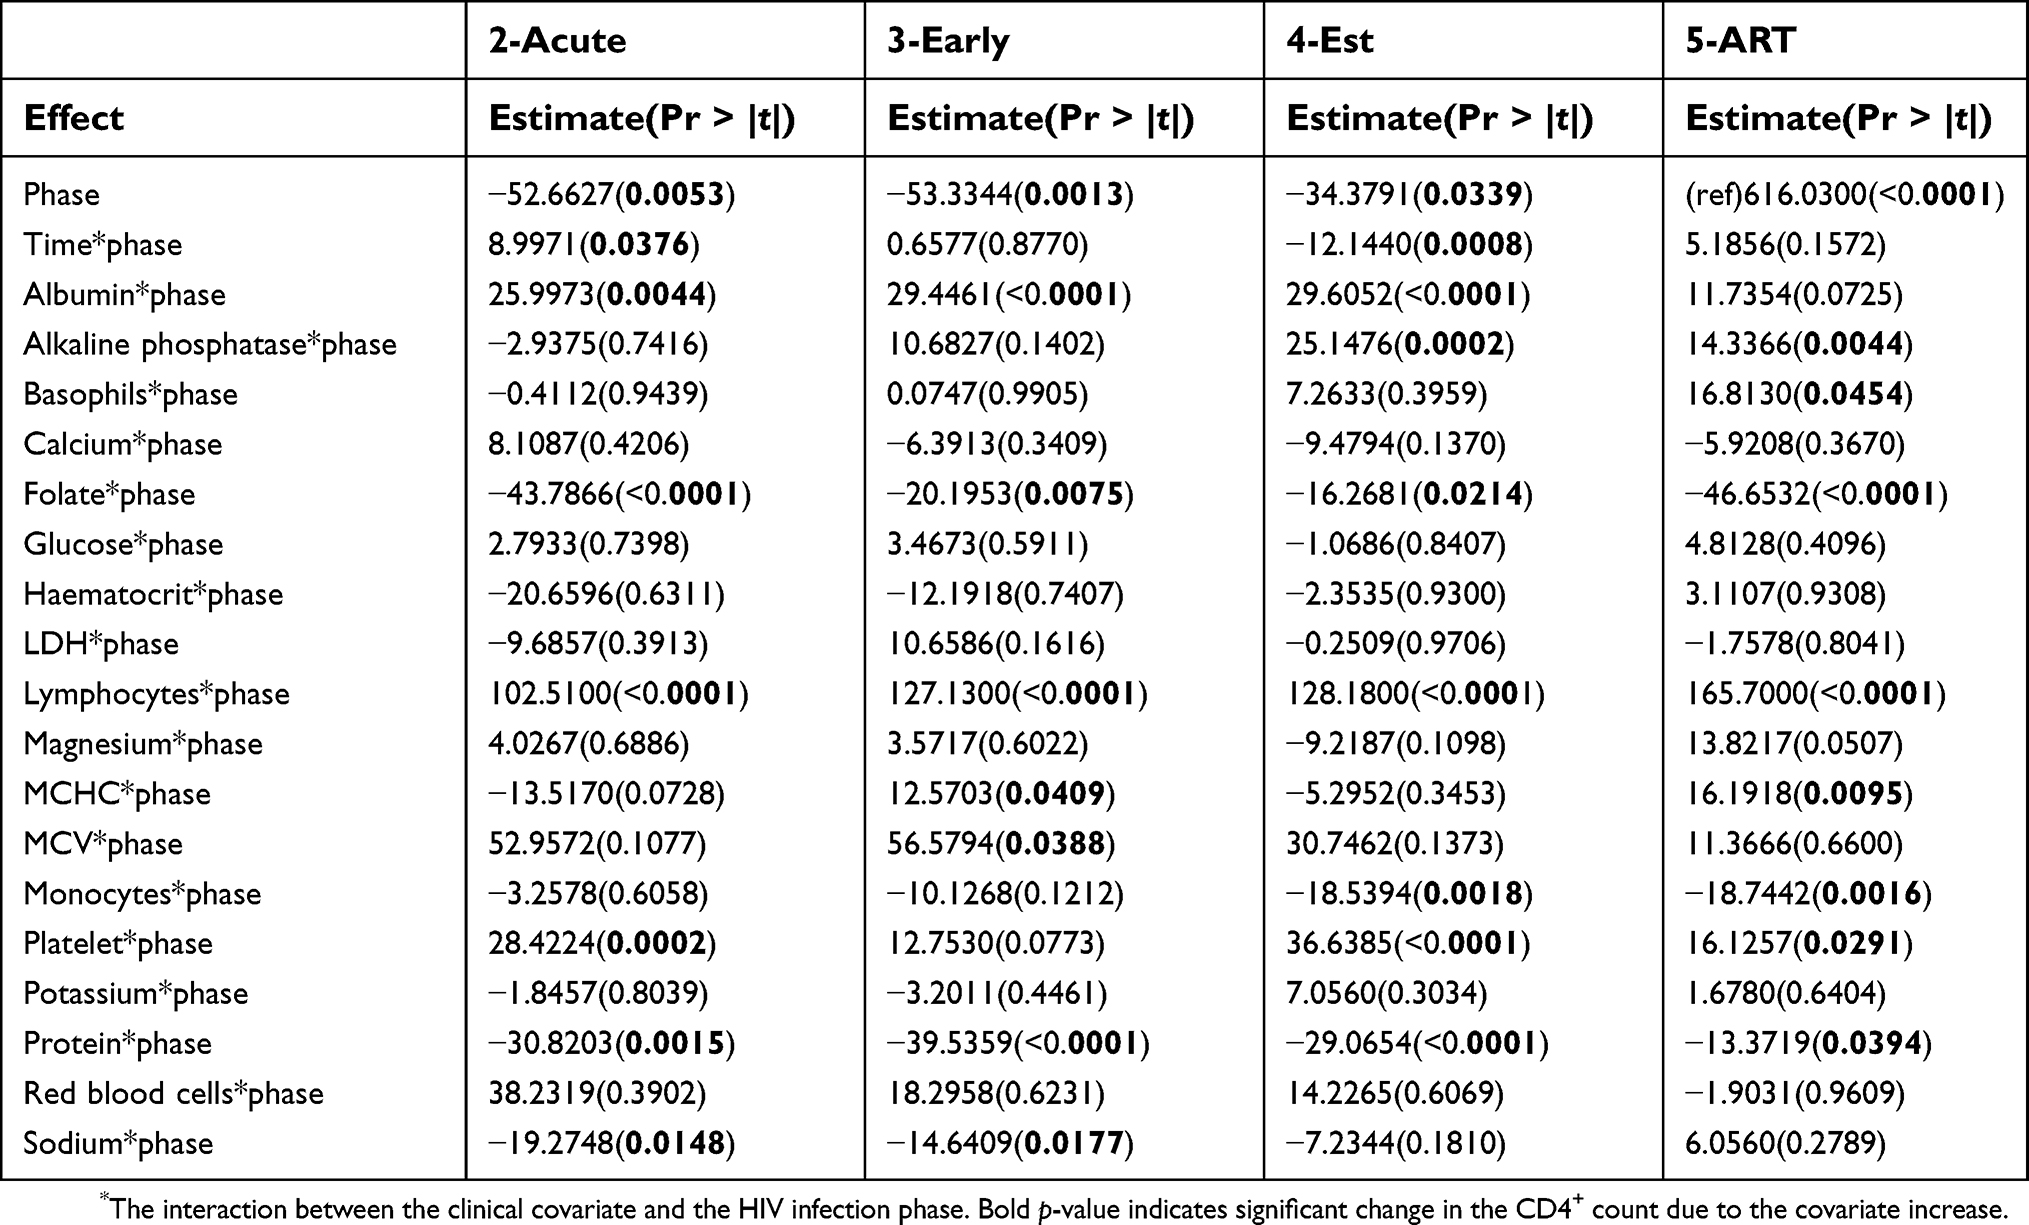
Table 2 shows the results of the mixed model in which the marginal (fixed) effects indicate the cohort’s general CD4 count trajectories in response to the covariates within each phase. All the significant trends are in bold. Lymphocyte increase was associated with an improved CD4 count throughout the phases of the HIV disease progression whereas folate and protein increase resulted in a decline of the CD4 count at each phase. Before treatment, an increase in albumin improved the CD4 count by almost the same magnitude, whereas basophils increase could only have a significant positive effect on the CD4 count during therapy. The CD4 count improved with an increase in alkaline phosphatase (ALP) during the established and ART phases with more improvement at the established phase. Contrary to ALP behavior, it was during the established and ART phases where the monocytes indicated a negative impact on the CD4 count. The platelet count showed positive effects on the CD4 count in all the stages except the early phase. Our results also showed that it was in this early phase only where the mean corpuscular volume increase significantly improved the CD4 count. The mean corpuscular hemoglobin concentration (MCHC) also indicated a positive association with the CD4 count in the early phase and then during the ART as well. The results revealed that an increase in sodium content soon after HIV infection (acute and early phases) was associated with a CD4 decline. Our data show that over time within the acute phase, the CD4 count increased by 8.9971 cells/mm3 (p-value =0.0376) at each visit and dropped by 12.1440 cells/mm3 (p-value =0.0008) at each visit during the established phase. Our mixed model estimated that the ART phase records were on average of 616.03 cells/mm3 of CD4 count and those from the acute phase being 52.6627 cells/mm3 below that of the ART average. Table 3 shows that the ART phase was at least 45 cells/mm3 of CD4 count above that of any other investigated phase. All the average CD4 counts from the other phases before therapy (acute to established) were found not to be significantly different from each other.
 | Table 2 Fixed effects – the cohort’s general trajectories within each phase |
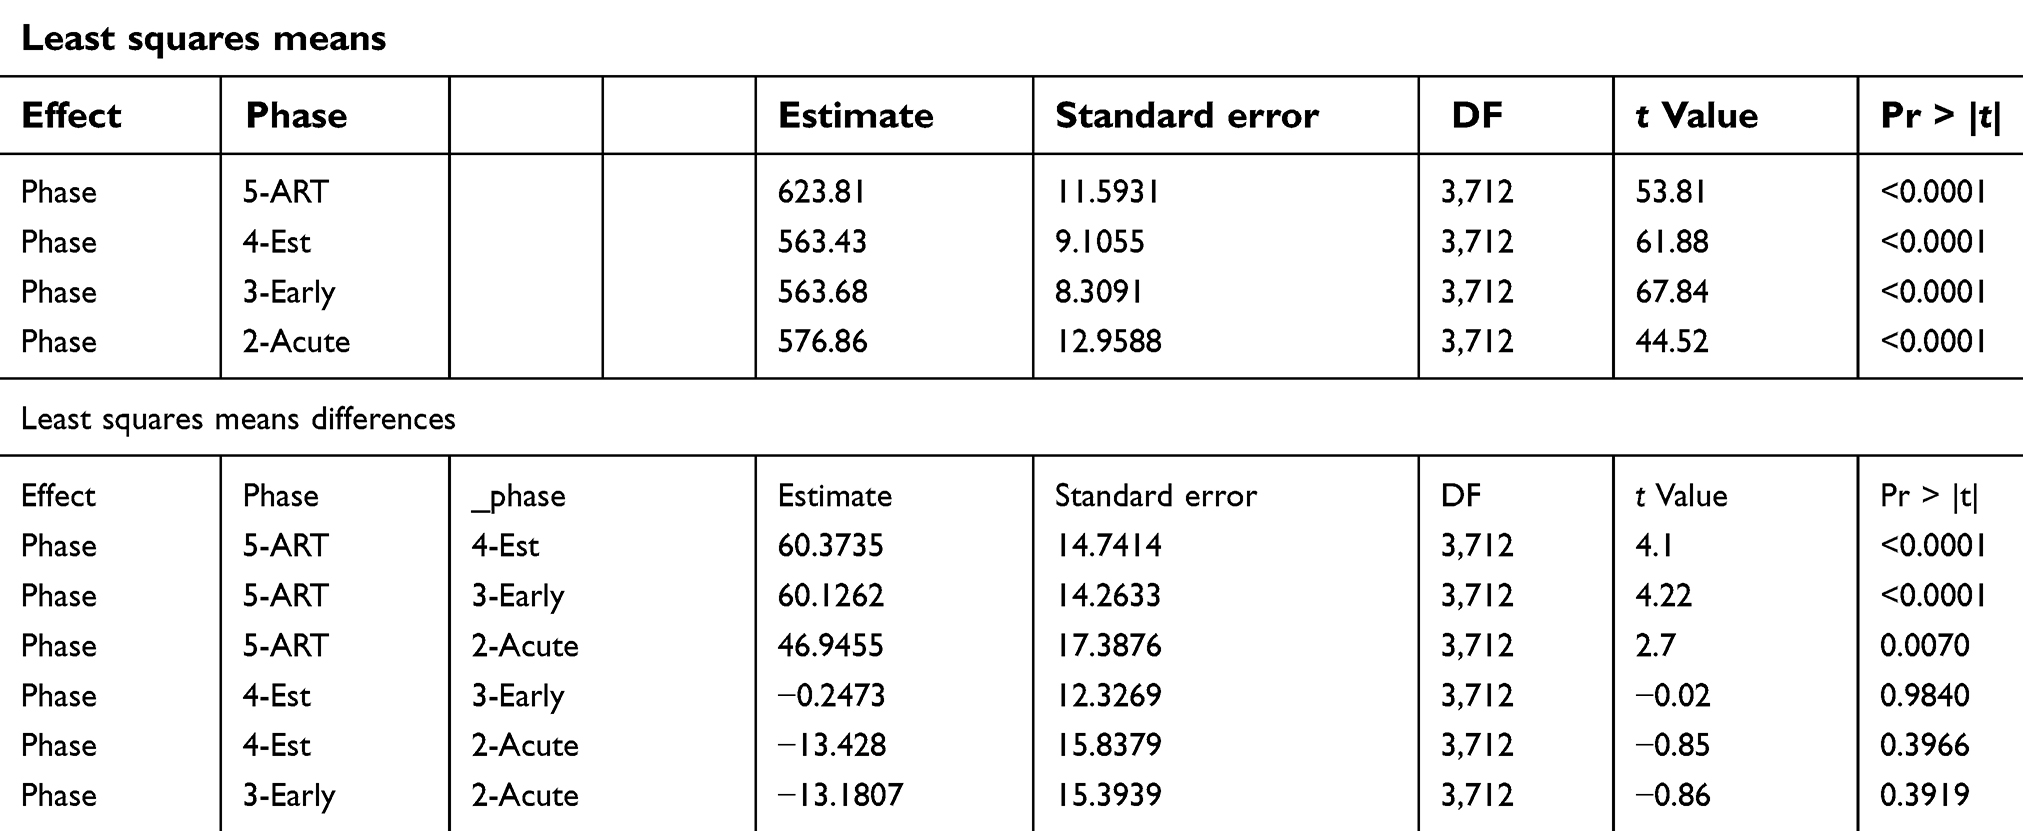 | Table 3 Least squares means and differences |
Random effects due to each covariate
We further investigated the random effects due to each covariate by allowing each patient to have own CD4 count trajectory with intercept and slope. This improved the Akaike Information Criterion in the modeling of the CD4 count.
Time within each phase was also considered as a covariate. The variations in the intercepts (intr) and slopes of individual patient’s CD4 counts against time are presented in Table 4. Also shown are the relationships between the patients’ intercepts and slopes within each phase. The variations were then expressed as percentages of the total variation captured by the model. For the time covariate, the results show that there was greater variation among patients’ average CD4 counts upon entering the acute phase (17.9147%, p-value =0.0012) followed by the variations in the CD4 counts recorded at the beginning of the ART phase (15.8941%, p-value =0.0008). The intercepts and the slopes were negatively related at the acute and early phases in which the CD4 counts had upward trends of 11.6459 and 3.3582, respectively. This suggests that over time all the patients’ CD4 count trajectories during the acute and early phases approached a higher focal level. This phenomenon indicates that the patients who entered the acute and early phases at lower CD4 count had their counts increasing at a faster rate than those who entered with a higher CD4 count already. Eventually, all the patients’ CD4 counts approached the same higher CD4 count level. Similar estimate proportions of the intercepts and slope relationships for the other covariates are presented in Figure 3 where the intercepts represent the average CD4 counts at the mean covariate value (mean centered). The trajectory slopes are the rates of CD4 count change as the values of the covariates measurements increase.
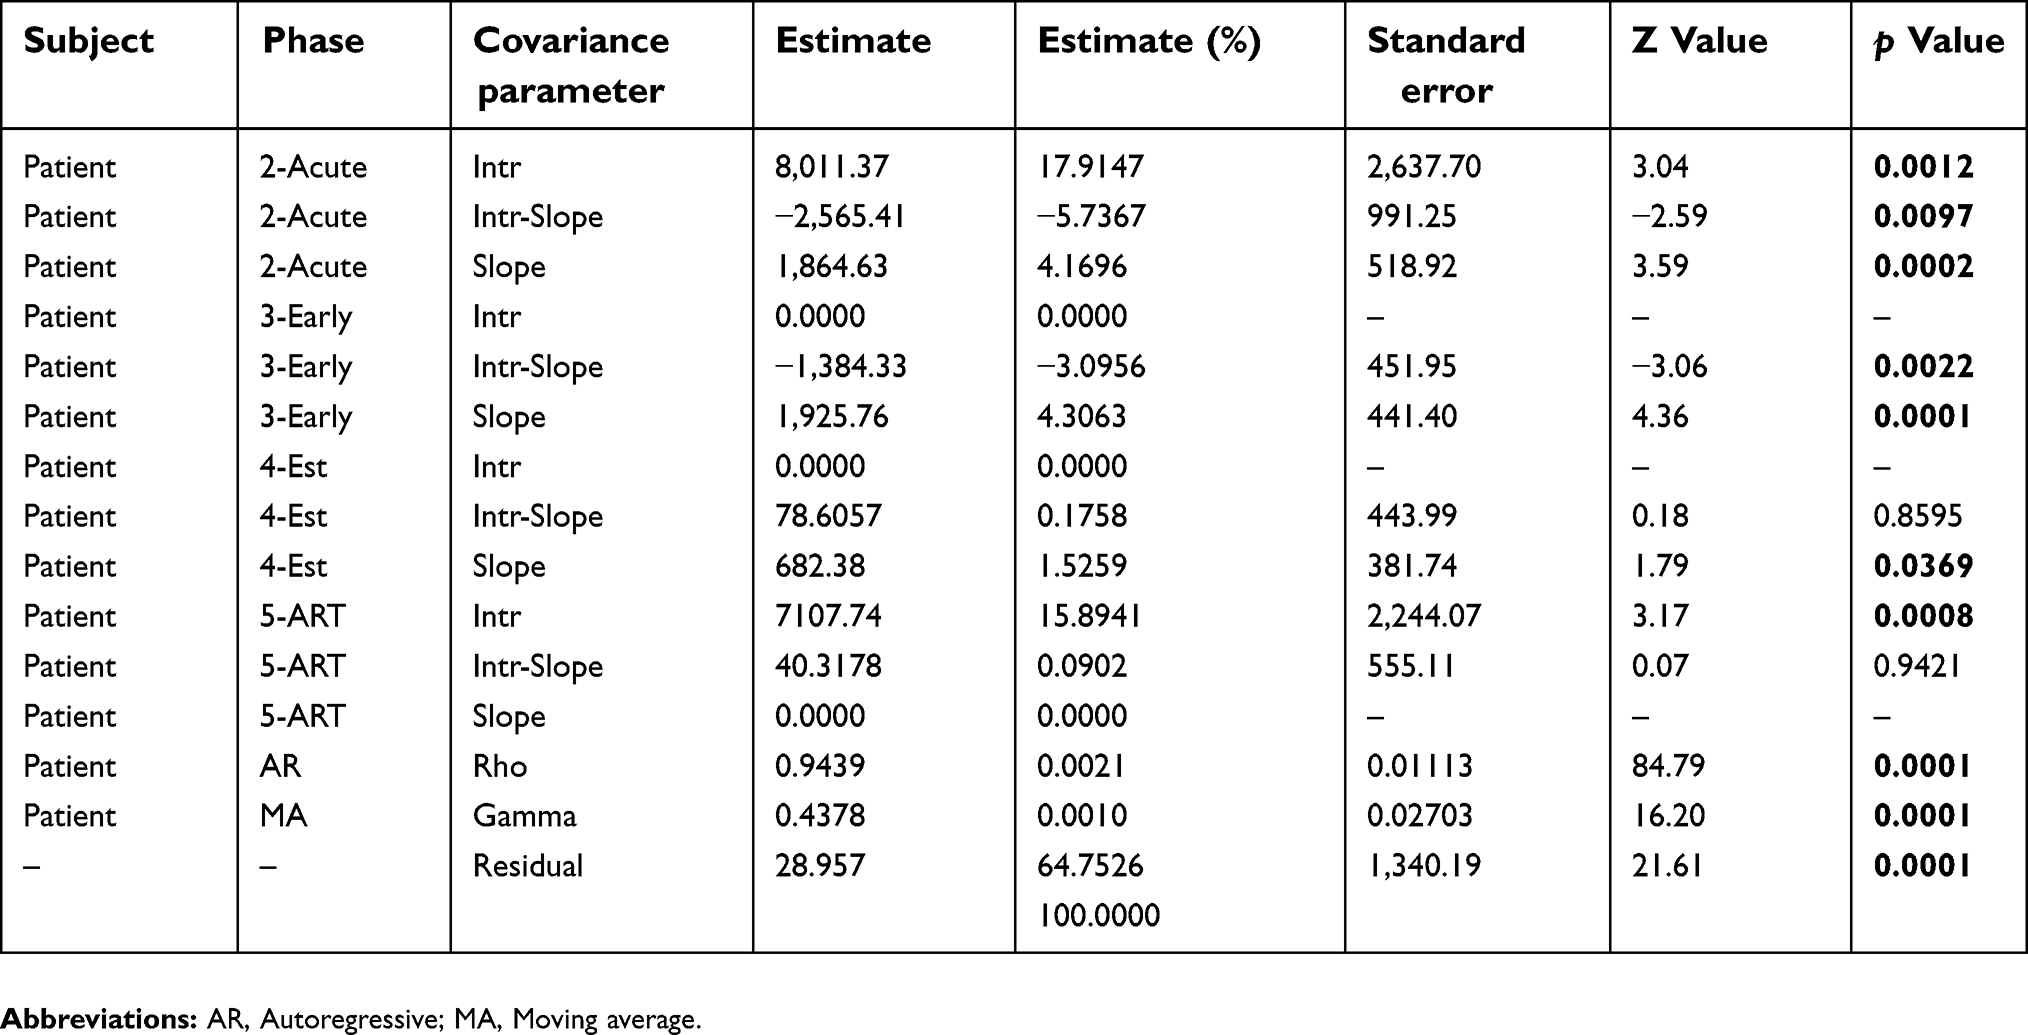 | Table 4 Covariance parameter test of time effect and the proportions |
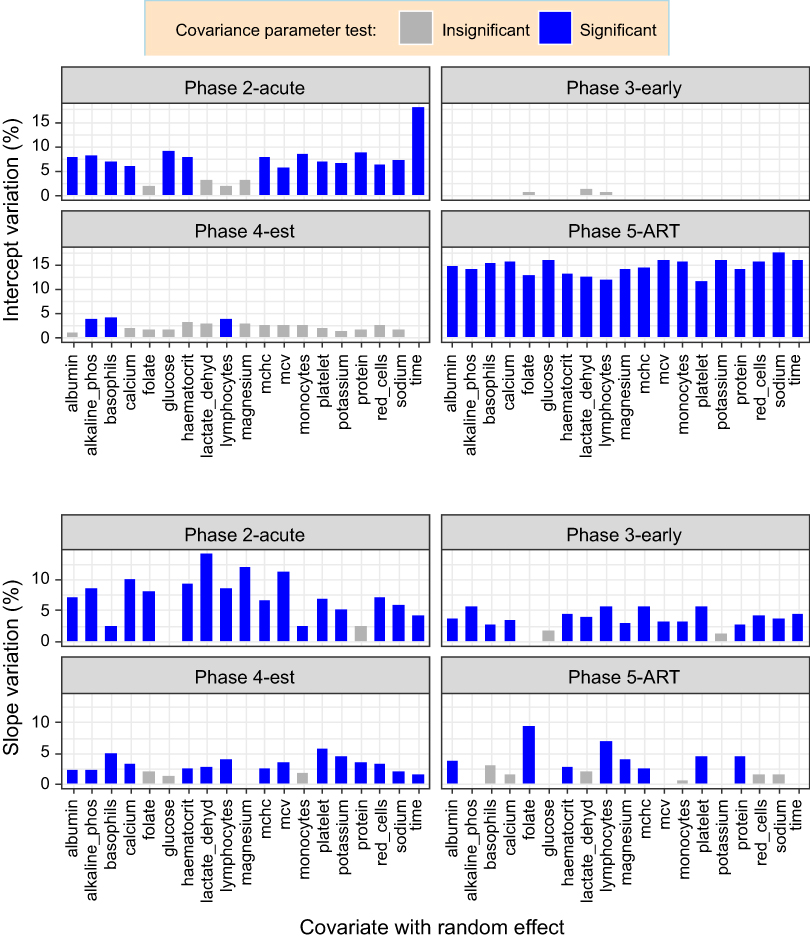 | Figure 3 Proportion of variation in intercepts and slopes. The fixed effects parameters are identical, and each covariate at a time was allowed to have a random effect. Different variance parameter estimates were obtained for each phase (group) and these were expressed as a percentage of the total variation including the ARMA (1,1) and residuals. |
Figure 3 (intercept variation) shows that given the average values of folate, LDH, lymphocytes, and magnesium at the acute phase, there was no significant difference in the CD4 counts for all the 237 patients under study. The same phenomenon was also observed during the early phase where there was no significant difference in the average CD4 counts for all the patients in response to each of the studied covariates. This was almost the same situation at the established phase except for the significant differences in the patients’ average CD4 counts at the mean values of ALP, basophils, and lymphocytes. The results also show that upon taking medication, all the patients’ average CD4 counts were significantly different from each other. Generally, the patients’ average CD4 counts did not vary too much in response to the covariates during the early and established phases. Wide variations in the average CD4 counts were observed during the acute and ART phases.
We further explored the variations in the rates of the CD4 count change in response to the increase in the values of each covariate. Figure 3 (slope variation) shows that the rate of CD4 count change in response to each of the covariates varied among the patients mostly from the acute to the established phase. The acute phase was characterized by no significant difference in the CD4 count rate of change in response to the increase in glucose and protein. Similarly, in the early phase, folate, glucose, and potassium did not induce any differences in the rate of change of CD4 count among the patients. During the established phase, an increase in the folate, glucose, magnesium, and monocytes resulted in no significant difference in the CD4 count rate of change among all the patients. However, upon taking medication, more than half of the covariates were associated with similar rates of CD4 count change among the patients. The greatest variation in the rate of CD4 count change was observed soon after infection (acute phase) in which an increase in the LDH induced the widest variations in the CD4 count rate of change between the patients. This was followed by folate during the ART phase.
Throughout the post-HIV infection follow up period, there was a positive relationship (r >0.80) between the intercepts and slopes of the CD4 count trajectories against lymphocytes (Figure 4 and Table 5). This indicates that at each phase of the HIV disease progression, an increase in lymphocytes resulted in the patients whose average CD4 counts that were already high to increase at a faster rate than those whose average CD4 counts were lower. The CD4 count trajectories against red blood cells (ART phase), LDH (early phase), basophils (established and ART phases), platelets (established phase), and sodium (ART phase) showed an upward trend with positive intercept and slope correlations. This means that, as these covariates increase within the indicated phases, the patients with higher average CD4 counts had their CD4 counts increasing at a faster rate than those who had lower CD4 counts. The cohort’s CD4 count trajectory against monocytes was heading downwards during the ART phase with positive intercept–slope relationships. This indicated that as the monocytes increased, patients with lower average CD4 counts became worse than those with higher average CD4 counts. On the other hand, there was a negative relationship (covtest, p-value =0.0297, Figure 4) between the average CD4 counts and their rate of change with red blood cells during the early phase. This early phase’s CD4 count and red blood cells trajectories followed a general upward trend suggesting that as the red blood cells increase, all the patients’ CD4 counts approached a common higher CD4 count level than the cohort’s average. That is, red blood cell increase during the uptake of medication, resulted in the patients whose CD4 count that was higher to increase even faster than those whose count was lower.
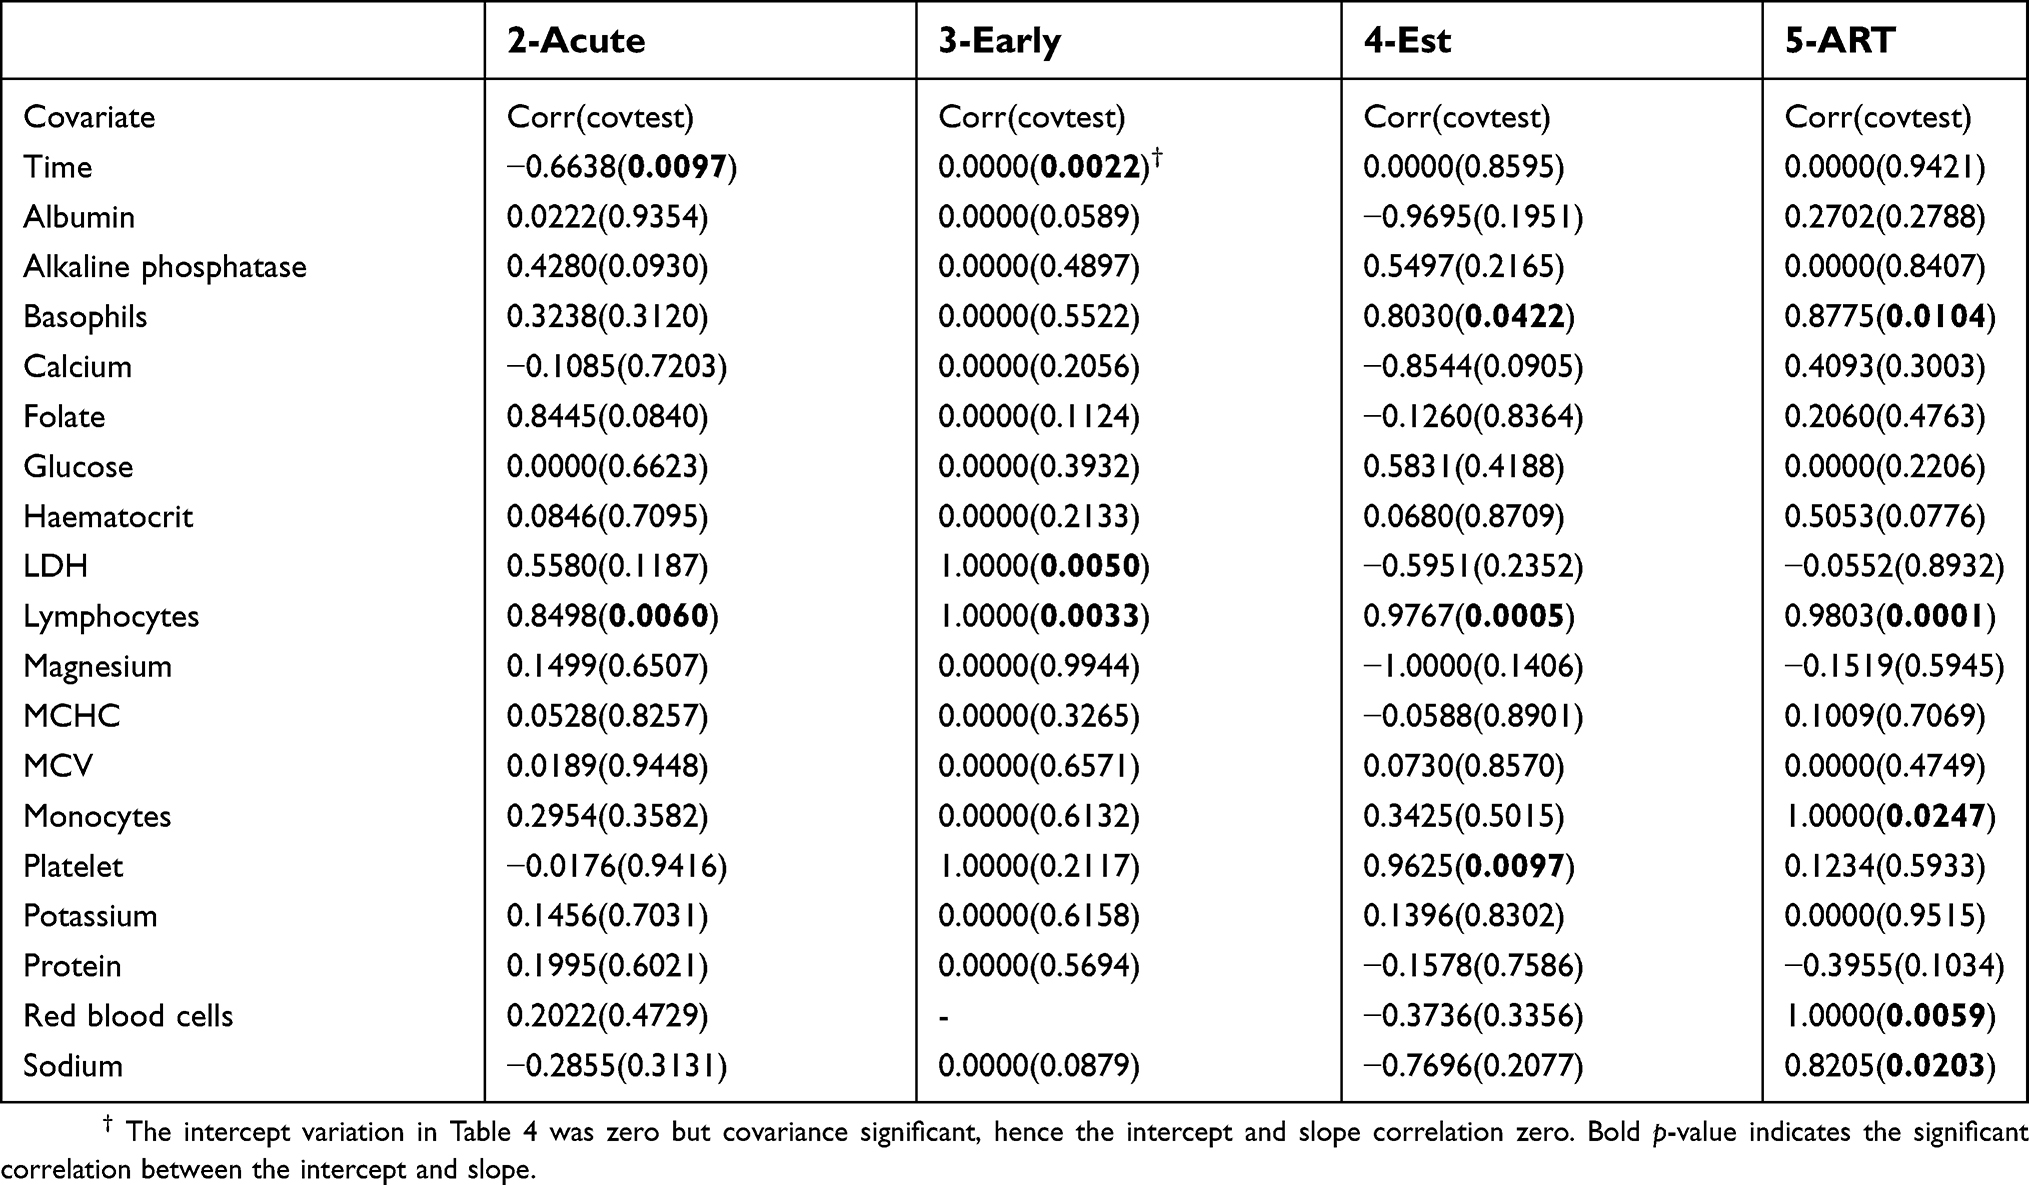 | Table 5 Correlation between intercept and slope |
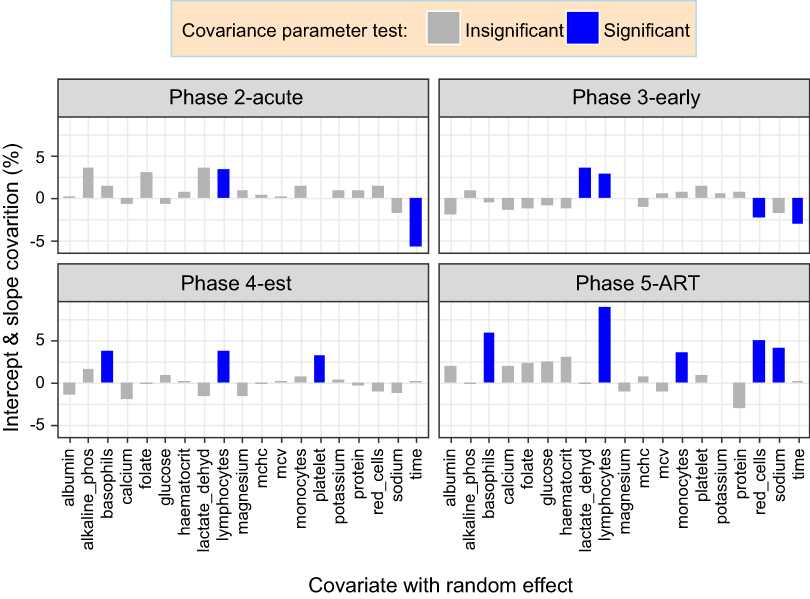 | Figure 4 Proportion of variation in intercept and slope covariations. The fixed effects parameters are identical, and each covariate at a time was allowed to have a random effect. Different covariance parameter estimates were obtained for each phase (group) and these were expressed as a percentage of the total variation including the autoregressive of order 1 and moving average of order 1 (ARMA (1,1)) and residuals. |
Discussion
The investigated data from the CAPRISA studies showed complex relationships and variations in the CD4 count and its covariates during the different phases of the HIV disease progression. The cohort’s repeated measurements for the CD4 count varied widely around their mean within the established phase and narrowly during the ART phase. All the red blood cell count components were also found to narrowly vary during the ART phase as compared to the other phases. Only 18 of the 46 CD4 count covariates that were available for investigation were significant and consequently considered for further investigation.
There was great variation in the patients’ average CD4 counts upon entering the acute and ART phases explaining the patients’ immune responses to viral invasion and treatment, respectively. This is likely to be attributed to the high level of inter-individual diversity of the human system which is also affected by different factors.62 An increase in the measurements or quantities of the covariates was found to change the CD4 count either for the better or worse in certain patients and in some cases causing the patients’ CD4 counts to approach a common level which was higher or lower than that of the cohort. The random effects due to the covariates were either widely varying or showed no significant difference in the CD4 counts in the phases of the HIV disease progression. During the acute phase, the mean values of folate, lactate LDH, lymphocytes, and magnesium corresponded to similar CD4 count levels for all the patients. These results revealed that on average the patients’ CD4 counts were not affected by the demand for cell growth and metabolism (folate63,64), glucose conversion (LDH65), and muscle contractions and protein processing (magnesium66). The CD4 cells are T cells67 which are also part of the lymphocytes, and the results showed that on average the CD4 count did not significantly differ between patients during the acute and the early phases, given the average lymphocytes count. However, during the established and ART phases, our data showed that the average lymphocytes count (total B and T cells14,66,68), were associated with significantly different average CD4 levels among the patients. With the exception of the early phase, the indicators of damage to body tissues and inflammation (basophil66) and liver health (ALP8,69,70) were on average significantly inducing CD4 count variations among the patients. Our data show that it is not only during therapy where treatment interferes with the biochemical properties among HIV patients as found by71 during a six-month treatment period study. We observed that liver damage was one of the most common biochemical associated with significant CD4 count variation throughout the HIV disease progression except during the early phase. Hence, it then turns out that on average, tissue damage indicators were associated with the CD4 count variation in most of the phases. However, our data further revealed that upon taking medication which significantly improved the CD4 count than any other phase, all the 18 covariates induced wide variations in the patients’ average CD4 counts. HIV treatment is known to affect the clinical attributes72 which could consequently be the attributing factor to the CD4 count variations in response to all the 18 covariates in our data during the ART phase. This is because treatment has proved to be effective but also increasingly complex due to new developing syndromes.73
Our results showed that all the patients’ CD4 counts changed at different rates in response to each of the covariates upon taking medication. An increase in glucose and protein did not bring about variation in the rate of change of the CD4 counts between patients during the acute phase. Early phase CD4 counts also changed at the same rate when either of folate, glucose or potassium increase. Similarly, folate, glucose, magnesium, and monocytes increase at the established phase gave rise to the same rate of the CD4 count change. Most of the covariates induced wide variations in the rate of the CD4 count change during the acute phase. Our data showed that lymphocytes increase in every phase resulted in patients whose CD4 count was already higher increasing even faster than those patients with lower average CD4 counts. Similarly, patients with higher CD4 counts were found to have their count increasing at a much faster rate as the following covariates increase in certain phases: LDH (early phase), basophils (established and ART phases), platelets (established phase), and sodium (ART phase). During the early phase of the disease progression, the patients whose average CD4 count that was lower, increased at a faster rate in response to the red blood cells increase such that all the patients’ CD4 counts eventually approached a common higher CD4 count. However, upon taking medication, an increase in the red blood cell count resulted in those individuals whose CD4 count which was already higher to become even much better as compared to the ones that were lower. Our data show that red blood cells that are packed with hemoglobin74 and plays a role in the respiratory process75,76 are associated with CD4 count improvement. Monocytes increase during medication (ART phase) resulted in CD4 counts that were lower to become much worse than for those patients whose average CD4 counts that were higher. Although monocytes are infected together with the CD4+ T cells,77 our data show that during therapy, monocytes were spared more than the CD4+ T cells.
Conclusions
Of the many CD4 count covariates that have been suggested in the previous studies, only a few were found to be significantly associated with the CD4 count variation at the different phases of the HIV disease progression. These few covariates induced either wide variations in the patients’ average CD4 counts in some infection phases and show no effect in the others. An increase in the measurements or quantities of the covariates was found to either improve the CD4 count at a faster rate for those patients whose average CD4 was already high or worsen the CD4 level which was already lower than that of the other patients. In some cases, the increase in the covariates values caused the patients’ CD4 counts to approach a common level which was lower or higher than that of the general cohort. Tissue damage indicators were the most common covariates associated with CD4 count variation between patients. Patients who entered either the acute or early phases with lower average CD4 counts had their count increasing at a faster rate than those who entered with a higher CD4 count already resulting in the cohort approaching a common higher CD4 count. In addition to other treatment measures, the manipulation of selected CD4 count covariates for patients within a specific phase can usefully augment tailored methods for monitoring HIV patients using the CD4 count. Generally, the studied covariates induced wide variations in the CD4 count between HIV positive patients during the ART phase.
Acknowledgments
This study would not have been a success without the assistance of Nonhlanhla Yende-Zuma and Nigel J. Garrett for their assistance in making the data available. Our gratitude also goes to the teams for the different CAPRISA studies and all participants for their important personal contribution to the availability of the data for the HIV research through their support and participation in the projects.
Disclosure
The authors report no conflicts of interest in this work.
References
1. Kelly G. Body temperature variability (Part 1): a review of the history of body temperature and its variability due to site selection, biological rhythms, fitness, and aging. Altern Med Rev. 2006;11(4):278–293.
2. Mohajan HK. Two criteria for good measurements in research: validity and reliability. Ann Spiru Haret Univ. 2017;17(3):58–82.
3. Bajpai S, Bajpai R. Goodness of measurement: reliability and validity. Int J Med Sci Public Health. 2014;3(1):173–176. doi:10.5455/ijmsph.2013.191120133
4. Alexander LK, Lopes B, Ricchetti-Masterson K, Yeatts KB. Cohort Studies; 2015.
5. Euser AM, Zoccali C, Jager KJ, Dekker FW. Cohort studies: prospective versus retrospective. Nephron Clin Pract. 2009;113:c214–c217. doi:10.1159/000235241
6. Goldstein H. Longitudinal studies and the measurement of change. J Royal Statl Soc Ser D. 1968;18(2):93–117.
7. Weston R, Marett B. HIV infection pathology and disease progression. Clin Pharm. 2009;1:387.
8. Beare A, Stockinger H, Zola H, Nicholson I. The CD system of leukocyte surface molecules: monoclonal antibodies to human cell surface antigens. Curr Protoc Immunol. 2008;73(80):
9. Vanisri H, Vadiraja N. Association between red blood cell parameters and immune status in HIV infected males. Indian J Pathol Oncol. 2016;3(4):684–689. doi:10.5958/2394-6792.2016.00127.7
10. Obirikorang C, Yeboah FA. Blood haemoglobin measurement as a predictive indicator for the progression of HIV/AIDS in resource-limited setting. J Biomed Sci. 2009;16:102. doi:10.1186/1423-0127-16-102
11. Vanisri H, Vadiraja N. Relationship between red blood cell parameters and immune status in HIV infected females. Indian J Pathol Oncol. 2016;3(2):255–259. doi:10.5958/2394-6792.2016.00049.1
12. Leticia OI, Ugochukwu A, Ifeanyi OE, Andrew A, Ifeoma UE. The correlation of values of CD4 count, platelet, Pt, Aptt, fibrinogen and factor VIII concentrations among HIV positive patients in FMC owerri. IOSR J Dent Med Sci. 2014;13(9Ver II):94–101. doi:10.9790/0853-139294101
13. Alavi SM, Ahmadi F, Farhad M. Correlation between total lymphocyte count, hemoglobin, hematocrit and CD4 count in HIV/AIDS patients. Acta Med Iran. 2009;47(1):1–4.
14. Shapiro N, Karras DJ, Leech SH, Heilpern KL. Absolute lymphocyte count as a predictor of CD4 count. Ann Emerg Med. 1998;32(3):323–328.
15. Sivaram M, White A, Radcliffe K. Eosinophilia: clinical significance in HIV-infected individuals. Int J STD AIDS. 2012;23(9):635–638. doi:10.1258/ijsa.2012.011409
16. Iffen TS, Efobi H, Usoro CAO, Udonwa NE. Lipid profile of HIV-positive patients attending university of Calabar teaching hospital, Calabar - Nigeria. World J Medl Sci. 2010;5(4):89–93.
17. Oka F, Naito T, Oike M, et al. Correlation between HIV disease and lipid metabolism in antiretroviral-naı¨ve HIV-infected patients in Japan. J Infect Chemother. 2012;18:17–21. doi:10.1007/s10156-011-0275-5
18. Floris-Moore M, Howard A, Lo Y, Arnsten J, Santoro N, Schoenbaum E. Increased serum lipids are associated with higher CD4 lymphocyte count in HIV-infected women. HIV Med. 2006;7:421–430. doi:10.1111/hiv.2006.7.issue-7
19. Misra R, Chandra P, Riechman SE, et al. Relationship of ethnicity and CD4 count with glucose metabolism among HIV patients on highly-active antiretroviral therapy (HAART). BMC Endocr Disord. 2013;13:13. doi:10.1186/1472-6823-13-13
20. Maganga E, Smart LR, Kalluvya S, et al. Glucose metabolism disorders, HIV and antiretroviral therapy among tanzanian adults. PLoS One. 2015;10((8):e0134410. doi:10.1371/journal.pone.0134410
21. McKnight TR, Yoshihara HAI, Sitole LJ, Martin JN, Steffensd F, Meyer D. A combined chemometric and quantitative NMR analysis of HIV/AIDS serum discloses metabolic alterations associated with disease status. Mol Biosyst. 2014;10:2889–2897. doi:10.1039/c4mb00347k
22. Adhikari PM, Chowta MN, Ramapuram JT, Rao SB, Udupa K, Acharya SD. Effect of vitamin B12 and folic acid supplementation on neuropsychiatric symptoms and immune response in HIV-positive patients. J Neurosci Rural Pract. 2016;7(3):362–367. doi:10.4103/0976-3147.182774
23. Semeere AS, Nakanjako D, Ddungu H, Kambugu A, Manabe YC, Colebunders R. Sub-optimal vitamin B-12 levels among ART-Naı¨ve HIV-positive individuals in an Urban Cohort in Uganda. PLoS One. 2012;7(7):e40072. doi:10.1371/journal.pone.0040072
24. Volberding PA, Levine AM, Dieterich D, Donna M, Mitsuyasu R, Saag M. Anemia in HIV infection: clinical impact and evidence-based management strategies. Clin Infect Dis. 2004;38:1454–1463. doi:10.1086/383031
25. Butt AA, Michaels S, Greer D, Clark R, Kissinger P, Martin DH. Serum LDH level as a clue to the diagnosis of histoplasmosis. The AIDS Read. 2002;12:7.
26. Butt AA, Michaels S, Kissinger P. The association of serum lactate dehydrogenase level with selected opportunistic infections and HIV progression. Int JInfect Dis. 2002;6:178–181.
27. Sudfeld CR, Isanaka S, Aboud S, et al. Association of serum albumin concentration with mortality, morbidity, CD4 T-cell reconstitution among tanzanians initiating antiretroviral therapy. J Infect Dis. 2013;207:1370–1378. doi:10.1093/infdis/jit027
28. Moolla Y, Moolla Z, Reddy T, Magula N. The use of readily available biomarkers to predict CD4 cell counts in HIV-infected individuals. South Afr Family Pract. 2015;57(5):293–296. doi:10.1080/20786190.2015.1073895
29. Dos Santos ACO, Almeida AMR. Nutritional status and CD4 cell counts in patients with HIV/AIDS receiving antiretroviral therapy. Rev Soc Bras Med Trop. 2013;46(6):698–703. doi:10.1590/0037-8682-0125-2013
30. Pralhadrao HS, Kant C, Phepale K, Mali MK, Raghunath. Role of serum albumin level compared to CD4+ cell count as a marker of immunosuppression in HIV infection. Indian J Basic Appl Med Res. 2016;5(3):495–502.
31. Voss TG, Fermin CD, Levy JA, Vigh S, Choi B, Garry RF. Alteration of intracellular potassium and sodium concentrations correlates with induction of cytopathic effects by human immunodeficiency virus. J VirolL. 1996;70(8):5447–5454.
32. Choi B, Gatti PJ, Haislip AM, Fermin CD, Garry RF. Role of potassium in human immunodeficiency virus production and cytopathic effects. Virology. 1998;247:189–199. doi:10.1006/viro.1998.9251
33. Khaidukov SV, Litvinov IS. Calcium homeostasis change in CD4+ T lymphocytes from human peripheral blood during differentiation in vivo. Biochemistry (Moscow). 2005;70(6):692–702. doi:10.1007/s10541-005-0170-8
34. Braconnier P, Delforge M, Garjau M, Wissing KM, De Wit S. Hyponatremia is a marker of disease severity in HIV-infected patients: a retrospective cohort study. BMC Infect Dis. 2017;17:98. doi:10.1186/s12879-017-2191-5
35. Bani-Sadr F, Lapidus N, Rosenthal E, et al. Gamma glutamyl transferase elevation in HIV/Hepatitis C virus–coinfected patients during interferon–ribavirin combination therapy. J Acquir Immune Defic Syndr. 2009;50:4. doi:10.1097/QAI.0b013e31819a2429
36. Fleischbeina E, O’Brienb J, Martelinoc R, Fenstersheibd M. Elevated alkaline phosphatase with raltegravir in a treatment experienced HIV patient. Aids. 2008;22(17):2401–2407.
37. Gomo E, Ndhlovu P, Vennervald B, Nyazema N, Friis H. Enumeration of CD4 and CD8 T-cells in HIV infection in Zimbabwe using a manual immunocytochemical method. Cent Afr J Med. 2001;47(3):64–70.
38. Dusingize JC, Hoover DR, Shi Q, et al. Association of abnormal liver function parameters with HIV serostatus and CD4 count in antiretroviral-naive rwandan women. AIDS Res Hum Retroviruses. 2015;31(7):723–730. doi:10.1089/aid.2014.0170
39. Shiferaw MB, Tulu KT, Zegeye AM, Wubante AA. Liver enzymes abnormalities among highly active antiretroviral therapy experienced and HAART Na\ve HIV-1 infected patients at Debre Tabor hospital, NorthWest Ethiopia: a comparative cross-sectional study. AIDS Res Treat. 2016;2016:Article ID 1985452. doi:10.1155/2016/1985452
40. Dannhauser A, van Staden A, van der Ryst E, et al. Ntritional status of HIV-1 seropositive patients in the free State Province of South Africa: anthropometric and dietary profile. Eur J Clin Nutr. 1999;53:165–173.
41. Dimala CA, Kadia BM, Kemah B-L, Tindong M, Choukem S-P. Association between CD4 cell count and blood pressure and its variation with body mass index categories in HIV-infected patients. Int J Hypertens. 2018;2018:Article ID 1691474. doi:10.1155/2018/1691474
42. Nzou C, Kambarami RA, Onyango FE, Ndhlovu CE, Chikwasha V. Clinical predictors of low CD4 count among HIV-infected pulmonary tuberculosis clients: a health facility-based survey. S Afr Med J. 2010;100:602–605.
43. Kwantwi LB, Tunu BK, Boateng D, Quansah DY. Body mass index, haemoglobin, and total lymphocyte count as a surrogate for CD4 count in resource limited settings. Journal of Biomarkers. 2017;2017:Article ID 7907352. doi:10.1155/2017/7907352
44. Esposito FM, Coutsoudis A, Visser J, Kindra G. Changes in body composition and other anthropometric measures of female subjects on Highly active antiretroviral therapy (HAART): a pilot study in Kwazulu-Natal, South Africa. Southern Afr J HIV Med. 2008;9(4):36–42.
45. Fofana KC. Correlation Between Nutritional Indicators and Low CD4 Count (<200 cells>/mm3) among HIV Positive Adults in Kapiri, Zambia 2008–2009 [Thesis]. Graduate Faculty of Georgia State University, Georgia State University; 2016.
46. Venter E, Gericke G, Bekker P. Nutritional status, quality of life and CD4 cell count of adults living with HIV/AIDS in the Ga-Rankuwa area (South Africa). South Af J Clin Nutr. 2009;22(3):124–129. doi:10.1080/16070658.2009.11734233
47. Manner IW, Trøseid M, Oektedalen O, Baekken M, Os I. Low Nadir CD4 cell count predicts sustained hypertension in HIV-infected individuals. J Clin Hypertens. 2013;15(2):101–106. doi:10.1111/jch.12029
48. Hsue PY, Hunt PW, Ho JE, et al. Impact of HIV infection on diastolic function and left ventricular mass. Circ Heart Fail. 2010;3(1):132–139. doi:10.1161/CIRCHEARTFAILURE.109.854943
49. Palacios R, Santos J, Garcı´A A, et al. Impact of highly active antiretroviral therapy on blood pressure in HIV-infected patients. A prospective study in a cohort of naive patients. HIV Med. 2006;7:10–15. doi:10.1111/j.1468-1293.2005.00333.x
50. Chorba TL, Maurice C, Nkengasong J, Maran M, Roels TH, Djomand G. Assessing eosinophil count as a marker of immune activation among human immunodeficiency virus–infected persons in sub-Saharan Africa. Clin Infect Dis. 2002;34:1264–1266. doi:10.1086/339940
51. Lumbanraja S, Siregar D Association between red blood cell indices and CD4 count in HIV-positive reproductive women.
52. Olawumi H, Olatunji P. The value of serum albumin in pretreatment assessment and monitoring of therapy in HIV/AIDS patients. HIV Med. 2006;7:351–355. doi:10.1111/hiv.2006.7.issue-6
53. Sen LCS, Vyas A, Sanghi LCS, et al. Correlation of CD4+ T cell count with total lymphocyte count, haemoglobin and erythrocyte sedimentation rate levels in human immunodeficiency virus Type-l disease. MJAFI. 2011;67(1):15–20.
54. Daka D, Loha E. Relationship between Total lymphocyte count (TLC) and CD4 count among peoples living with HIV, Southern Ethiopia: a retrospective evaluation. AIDS Res Ther. 2008;5:26. doi:10.1186/1742-6405-5-26
55. Fasakin K, Omisakin C, Esan A, et al. Total and CD4+ T- lymphocyte count correlation in newly diagnosed HIV patients in resource-limited setting. J Med Lab Diagnosis. 2014;5(2):22–28. doi:10.5897/JMLD2014.0088
56. Cohen AJ, Steigbigel RT. Eosinophilia in patients infected with human immunodeficiency virus. J Infect Dis. 1996;174:615–618.
57. Atere AD, Akinbo BD, Okafor AM-J, Egbuchulem KI, Akinola EA. Evaluating correlation between total lymphocyte counts and CD4 counts in monitoring HIV patients. Arch Appl Sci Res. 2016;8(3):22–28.
58. Abdollahi A, Saffar H, Shoar S, Jafari S. Is total lymphocyte count a predictor for CD4 cell count in initiation antiretroviral therapy in HIV-infected patients? Niger Med J. 2014;55(4):289–293. doi:10.4103/0300-1652.137187
59. Opiyo WO, Ng’wena AGM, Ofulla AVO. Liver function markers and associated serum electrolytes changes in HIV patients attending patient support centre of Jaramogi Oginga Odinga teaching and referral hospital, Kisumu County, Kenya. East Afr Med J. 2013;90(9):276–287.
60. Adhikari PMR, Chowta MN, Ramapuram JT, Rao SB, Udupa K, Acharya SD. Prevalence of vitamin B12 and folic acid deficiency in HIV-positive patients and its association with neuropsychiatric symptoms and immunological response. Indian J Sexually Transmitted Dis AIDS. 2016;37(2):178–184. doi:10.4103/0253-7184.192117
61. van Loggerenberg F, Mlisana K, Williamson C, et al. Establishing a cohort at high risk of HIV infection in South Africa: challenges and experiences of the CAPRISA 002 acute infection study. PLoS One. 2008;3(4):e1954. doi:10.1371/journal.pone.0001954
62. Adrian L, Edward JC, Michelle AL. Shaping variation in the human immune system. Trends Immunol. 2016;37(10):637–646. doi:10.1016/j.it.2016.08.002
63. Arya SS, Kumar PK. Folate: sources, production and bioavailability. Agro Food Ind Hi Tech. 2012;23(4):23–27.
64.
65. Valvona CJ, Fillmore HL, Nunn PB, Pilkington GJ. The regulation and function of lactate dehydrogenase a: therapeutic potential in brain tumor. Brain Pathol. 2016;26:3–17. doi:10.1111/bpa.12299
66.
67. Papagno L, Spina CA, Marchant A, et al. Immune activation and CD8+ T-cell differentiation towards senescence in HIV-1 infection. PLoS Biol. 2004;2(2):0173–0185. doi:10.1371/journal.pbio.0020020
68. Obirikorang C, Quaye L, Acheampong I. Total lymphocyte count as a surrogate marker for CD4 count in resource-limited settings. BMC Infect Dis. 2012;12:128. doi:10.1186/1471-2334-12-166
69. Whitfield J. Gamma glutamyl transferase. Crit Rev Clin Lab Sci. 2001;38(4):263–355. doi:10.1080/20014091084227
70. Patil R, Kamble P, Raghuwanshi U. Serum ALP & GGT levels in HIV positive patients. Int J Recent Trends Sci Techy. 2013;5(3):155–157.
71. Mgogwe J, Semvua H, Msangi R, Mataro C, Kajeguka D, Chilongola J. The evolution of haematological and biochemical indices in HIV patients during a six-month treatment period. Afr Health Sci. 2012;12(1):2–7.
72. Ibeh BO, Omodamiro OD, Ibeh U, Habu JB. Biochemical and haematological changes in HIV subjects receiving winnicure antiretroviral drug in Nigeria. J Biomed Sci. 2013;20(1):73. doi:10.1186/1423-0127-20-73
73. Montessori V, Press N, Harris M, Akagi L, Montaner JSG. Adverse effects of antiretroviral therapy for HIV infection. Cmaj. 2004;170(2):229–238.
74. Junqueira L, Carneiro J, Kelley R. Basic Histology. A Lange Medical Book.
75. Jensen FB, Fago A, Weber RE. Hemoglobin structure and function. Fish Physiol. 1998;17:1–40.
76. Wintrobe M, Greer J. Wintrobe’s Clinical Hematology. Philadelphia.: Lippincott Williams & Wilkins; 2009.
77. Pasupathi P, Bakthavathsalam G, Saravanan G, Devaraj A. Changes in CD4+ cell count, lipid profile and liver enzymes in HIV infection and AIDS patients. J Appl Biomed. 2008;6:139–145.
 © 2019 The Author(s). This work is published and licensed by Dove Medical Press Limited. The
full terms of this license are available at https://www.dovepress.com/terms
and incorporate the Creative Commons Attribution
- Non Commercial (unported, 3.0) License.
By accessing the work you hereby accept the Terms. Non-commercial uses of the work are permitted
without any further permission from Dove Medical Press Limited, provided the work is properly
attributed. For permission for commercial use of this work, please see paragraphs 4.2 and 5 of our Terms.
© 2019 The Author(s). This work is published and licensed by Dove Medical Press Limited. The
full terms of this license are available at https://www.dovepress.com/terms
and incorporate the Creative Commons Attribution
- Non Commercial (unported, 3.0) License.
By accessing the work you hereby accept the Terms. Non-commercial uses of the work are permitted
without any further permission from Dove Medical Press Limited, provided the work is properly
attributed. For permission for commercial use of this work, please see paragraphs 4.2 and 5 of our Terms.