Back to Journals » ClinicoEconomics and Outcomes Research » Volume 10
Cost-effectiveness comparison of cabozantinib with everolimus, axitinib, and nivolumab in the treatment of advanced renal cell carcinoma following the failure of prior therapy in England
Authors Meng J, Lister J ![]() , Vataire AL, Casciano R
, Vataire AL, Casciano R ![]() , Dinet J
, Dinet J ![]()
Received 14 December 2017
Accepted for publication 14 March 2018
Published 23 April 2018 Volume 2018:10 Pages 243—250
DOI https://doi.org/10.2147/CEOR.S159833
Checked for plagiarism Yes
Review by Single anonymous peer review
Peer reviewer comments 2
Editor who approved publication: Professor Samer Hamidi
Jie Meng,1 Johanna Lister,1 Anne-Lise Vataire,2 Roman Casciano,1 Jerome Dinet2
1Analytica Laser, London, UK; 2Ipsen Pharma, Boulogne-Billancourt, France
Purpose: The aim of this study was to compare the cost-effectiveness of cabozantinib with the standard of care in England in adult patients with advanced renal cell carcinoma (aRCC), following prior vascular endothelial growth factor receptor (VEGFR)-targeted therapy.
Methods: We developed a partitioned-survival model with three health states to assess the cost-effectiveness of cabozantinib and its comparators. The model time horizon was 30 years. Efficacy and safety data were derived from pivotal clinical trials (METEOR: NCT01865747, CheckMate025: NCT01668784, and AXIS: NCT00678392). METEOR data were used for a direct comparison of cabozantinib and everolimus. Cabozantinib and nivolumab were compared indirectly, whereas equal efficacy for axitinib and everolimus was assumed based on a previously published expert opinion. For all efficacy endpoints, the best-fitting log-logistic or fractional polynomial curves were used to estimate outcomes. Utilities were converted from the 5-level EQ-5D version instrument applied during the METEOR study for specific health states. Reductions in utility scores due to adverse events were applied. English costs (eg, drug prices) and resource use (eg, visit to consultant) data were used.
Results: The total treatment cost was estimated to be 84,136 Great British Pounds (GBP) per patient treated with cabozantinib. The health gains were 2.26 life-years (LYs) and 1.78 quality-adjusted LYs (QALYs). The incremental cost-effectiveness ratios (ICERs) versus axitinib and everolimus were 98,967 GBP/QALY and 137,450 GBP/QALY, respectively. Cabozantinib was less costly and more effective than nivolumab; the incremental cost was −6,742 GBP and the QALY difference was 0.18.
Conclusion: Treatment with cabozantinib was more effective than treatment with axitinib or everolimus but was associated with higher total costs. When compared with nivolumab, cabozantinib represents an efficient option with nominally better efficacy and lower costs.
Keywords: incremental cost-effectiveness ratio, health economic analysis, health care costs, kidney cancer, targeted therapy
Introduction
Renal cell carcinoma (RCC) refers to a group of cancers that originate in the kidney and account for ~80% of kidney cancer cases.1 Advanced RCC (aRCC) includes metastatic disease and cancers that have spread to nearby tissues or lymph nodes but that have not yet metastasized. Approximately one in three patients presents with metastatic disease at diagnosis, and up to 40% of affected individuals develop metastatic disease following surgery.2,3 Typical symptoms of metastatic disease include airway obstruction, venous thromboembolism, bone pain, skeletal-related events (SREs), and hypercalcemia, causing a significant burden to patients.3,4
There is no cure for aRCC, and survival rates depend on the stage of the disease. It has been estimated that the 5-year survival rate for aRCC is approximately 10%.5 The goals of treatment are to extend life and delay disease progression while maintaining cognitive, physical, emotional, and social functions.6
Treatment options for aRCC include targeted therapies such as axitinib, everolimus, pazopanib, and sunitinib. The standard of care for patients with aRCC in England typically comprises vascular endothelial growth factor receptor (VEGFR) tyrosine kinase inhibitors (TKIs) for first-line therapy. Further active treatment options include axitinib and everolimus; nivolumab, an immune checkpoint inhibitor, has recently become available in England for the treatment of aRCC after prior therapy. For patients who experience first-line therapy failure, active treatment options thus include axitinib, everolimus, and nivolumab.
Cabozantinib, given via an oral once-a-day tablet, is the first therapy for aRCC that has demonstrated, versus an active comparator (everolimus), significant improvement in the following three key efficacy parameters: overall survival (OS), progression-free survival (PFS), and objective response rate (ORR). In the pivotal Phase III randomized controlled trial (METEOR), cabozantinib significantly improved OS by 4.9 months compared with everolimus (hazard ratio [HR] =0.66; 95% confidence interval [CI]: 0.53–0.83; P=0.00026) and PFS by 3.5 months (intention-to-treat [ITT] population; HR =0.51; 95% CI: 0.41–0.62; P<0.0001).7,8 Modeled OS and PFS estimates from a network meta-analysis (NMA) suggest superior OS and PFS benefits of cabozantinib over both axitinib and best supportive care (BSC).9 Adverse events observed during cabozantinib treatment were consistent with those reported by other VEGFR-TKI treatment options for aRCC. Adverse events can be managed with supportive care, dose interruptions, and dose modifications, which have been shown to be effective in limiting or preventing treatment-associated discontinuations.10
Using results of the pivotal Phase III randomized controlled trials,8,11 we developed a health economic model to evaluate the cost-effectiveness of cabozantinib with axitinib, everolimus, and nivolumab for the treatment of adult aRCC patients who experienced the failure of prior targeted therapy in England.
Methods
Model design
The following three health states were included in the model: PFS, disease progression, and death. The model calculated the proportion of patients in each health state according to estimated survival functions for PFS and OS using a partitioned survival approach (area under the curve). We chose this approach over Markov model, because PFS and OS can be modeled independently of each other providing a more flexible approach. It simulated 28-day (ie, 4 weeks) model cycles with a time horizon of 30 years. Costs and health effects were discounted at an annual rate of 3.5% in accordance with the National Institute for Health and Care Excellence (NICE) guidelines.12 The primary measures of health effects were life-years (LYs) gained and quality-adjusted LYs (QALYs) gained. A summary of key characteristics used in the model is shown in Table 1.
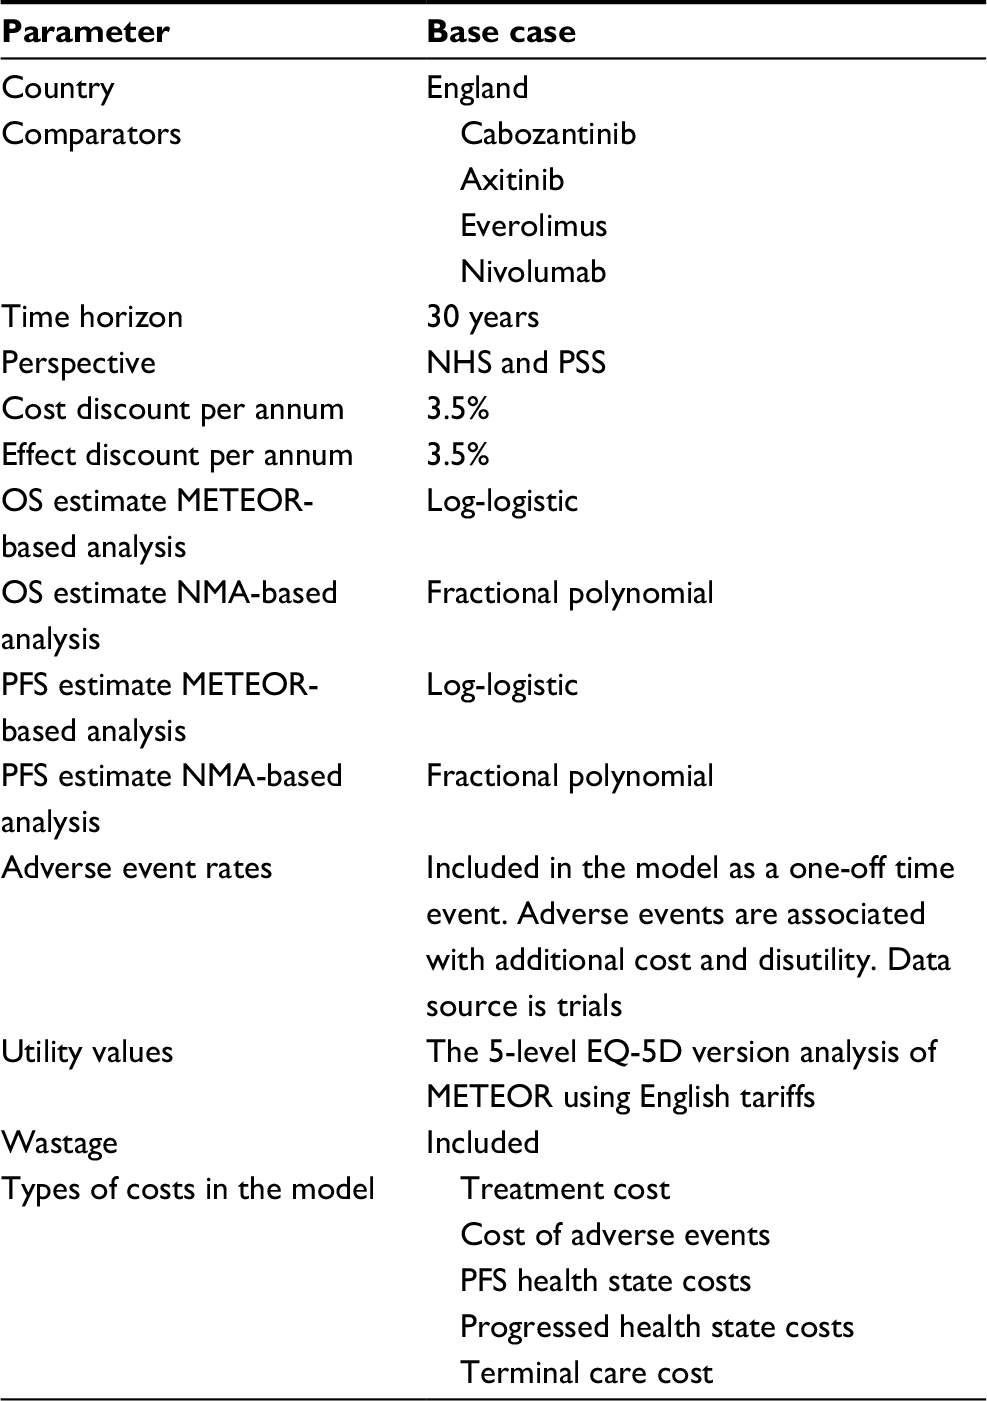 | Table 1 Summary of key characteristics of the model Abbreviations: NHS, National Health Service; NMA, network meta-analysis; OS, overall survival; PFS, progression-free survival; PSS, personal social services. |
Modeling efficacy
Treatment effects were estimated using data from randomized controlled clinical trials. The published OS and PFS data from the METEOR study were used to calculate the proportion of patients in each treatment arm at any time point after starting treatment.8 The proportion of patients in the postprogression health state at any given time was calculated as the difference between OS and PFS. Because there were no head-to-head trials comparing cabozantinib with axitinib or nivolumab, an indirect comparison via NMA was used.9
For the reference case, patient-level data from the METEOR study were used to estimate OS in the cabozantinib (Ipsen Ltd, Berkshire, UK) and everolimus (Novartis Pharmaceuticals UK Ltd, Surrey, UK) arms of the model. An axitinib (Pfizer Ltd, Kent, UK) arm was added to the model by assuming equal efficacy for axitinib and everolimus in line with previous advice from clinicians.13 Axitinib could be linked to cabozantinib indirectly in a network including the TARGET study, which connected sorafenib and placebo,14 but this study allowed treatment switching, and no results adjusted for cross-over were available. The only other alternative would be to use OS data that were censored at cross-over, but this would lead to immature OS results. Without adjusted results, there would be a risk that the relative survival in the axitinib arm would be underestimated ie, leading to underestimation of axitinib efficacy and lower incremental QALYs gained. This assumption is also supported by an analysis published by Sherman et al (2015).15
We used model fit statistics, visual inspection of curves, and anchoring (ie, comparison to published external sources) to select the best survival models for OS and PFS. A log-logistic distribution, which provided the best fit for METEOR-based analysis, was chosen in the base case for OS efficacy data for the comparison between cabozantinib, everolimus, and axitinib. For the NMA-based analysis, a fractional polynomial model provided the best fit and was used for the nivolumab (Bristol-Myers Squibb Pharmaceuticals Limited, Middlesex, UK) comparison.16 Similar to the OS endpoint, patient-level data from the METEOR study were used to calculate PFS in the cabozantinib, everolimus, and axitinib treatments of the model (again assuming equal efficacy of axitinib and everolimus).
In the economic model, time to treatment discontinuation (TTD) was determined by calculating the proportion of patients on treatment at each point in time. For cabozantinib and everolimus, treatment duration was based on TTD data from the METEOR trial. No TTD Kaplan–Meier data were identified for axitinib, and hence the PFS curve from the NMA was used as an estimate for TTD. The TTD survival curve for nivolumab was extracted from the literature17 and fitted using the NMA methods as described in the published NMA report.9,17 In the model for TTD, the lognormal distribution provided the best fit for all comparators and was used for all comparisons.
Utility inputs
QALYs were estimated by applying utility weights to each model health state. All health state utility values were based on the 5-level EQ-5D version instrument (EuroQoL Group, Rotterdam, The Netherlands)18 as administered in the METEOR trial. All treatments were assumed to have health state-specific utilities with reductions associated with adverse events experienced by patients. The average EQ-5D index score for patients without disease progression was 0.817 (standard error [SE] 0.003) in the METEOR study.16 The decrement for patients who experienced disease progression was 0.040 (SE 0.007). The postprogression health state utility value was 0.777 (0.817–0.040). Grade 3 and 4 adverse events in the METEOR study were associated with a disutility of 0.055, which was applied to all adverse events for all treatments in the model.
Cost inputs
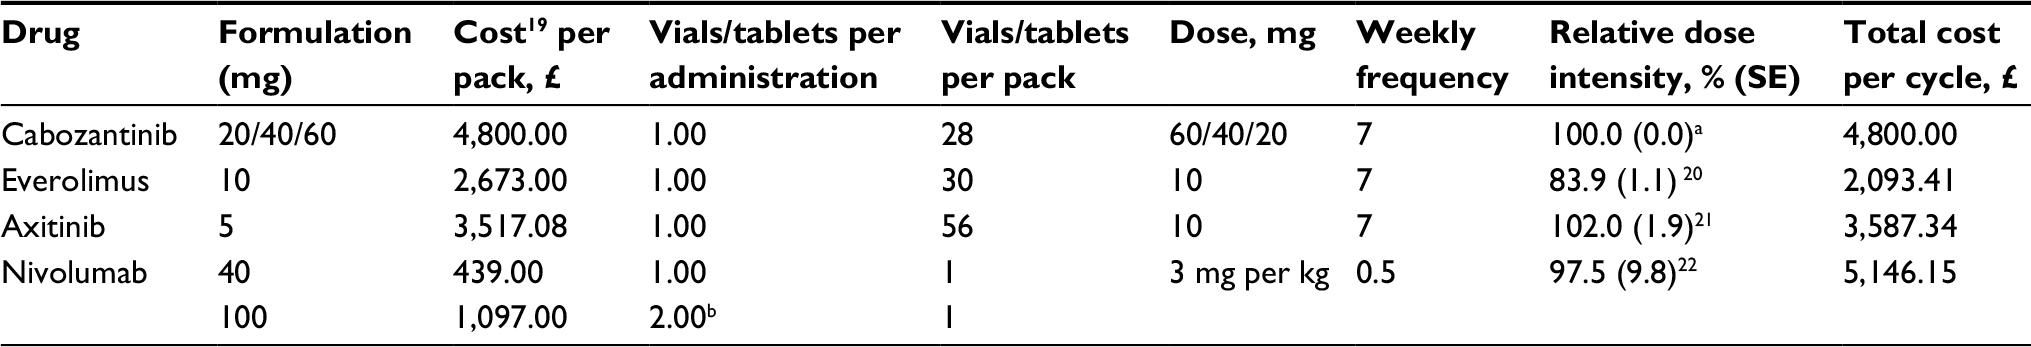
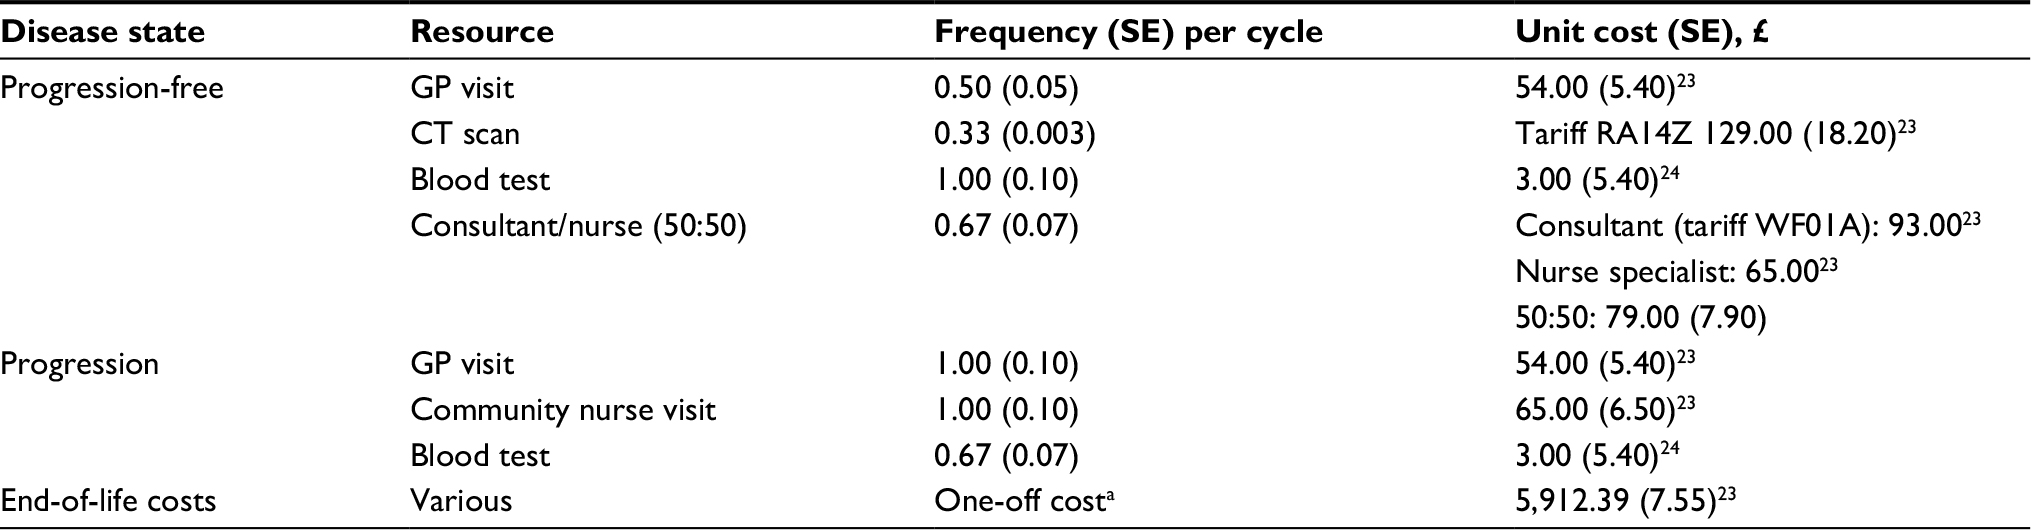
The perspective of the analysis was from the National Health Service (NHS) and personal social services in England. We included treatment costs, costs of adverse events, PFS health state costs, progressed health state costs, and terminal care costs. Drug costs were obtained from the British National Formulary (BNF)19 and are summarized in Table 2. Information on dosages and administration schedules was extracted from the relevant pivotal trial descriptions, publications, or health technology assessments.20–22 Disease management costs and resource use data shown in Table 3 were derived from the published Unit Costs of Health and Social Care 201523 and the NHS reference costs 2014–2015.24 The model also included end-of-life costs, which occurred during 4-week periods preceding death, taken from a 2014 report on the cost of care at the end of life among patients who had been diagnosed with cancer within 2 years.25 The 2014 hospital care costs were inflated to 2017 values using the average inflation rate for the UK.26
Analyses
The model estimated costs, LYs, and QALYs. Incremental cost-effectiveness ratios (ICERs) were calculated by dividing the difference in cost by the difference in LYs and QALYs. Parameter uncertainty was examined through one-way and probabilistic sensitivity analyses. Input parameter uncertainty was estimated using 95% CIs, SEs, or ranges, where available. When such data were not available, we used ±10% of the base case input estimate. The gamma distribution was used in probabilistic analyses for cost, while beta distributions were used for utility. We performed a second-order Monte-Carlo simulation with 10,000 simulations.
Results
The calculated per-cycle costs ranged from 2,093.41 Great British Pounds (GBP) for everolimus to 5,146.15 GBP for nivolumab (final column in Table 2). The total treatment costs varied from 31,980 GBP per patient treated with everolimus to 84,136 GBP per patient treated with cabozantinib (Table 4). In the base case, treatment with cabozantinib resulted in most LYs and QALYs gained. The health gains were 2.26 LYs and 1.78 QALYs for cabozantinib. Because of the assumption of equal efficacy of axitinib and everolimus, the calculated LYs and QALYs were identical for the two treatments at 1.4 QALYs and 1.78 LYs gained. The corresponding numbers for nivolumab were 1.64 QALYs and 2.08 LYs gained. The ICERs of cabozantinib treatment versus axitinib and everolimus were 98,967 GBP/QALY and 137,450 GBP/QALY, respectively. When compared with nivolumab, the incremental cost of cabozantinib was −6,742 GBP and the QALY gain was 0.18. Cabozantinib was thus dominant in comparison with nivolumab, meaning less costly and more effective.
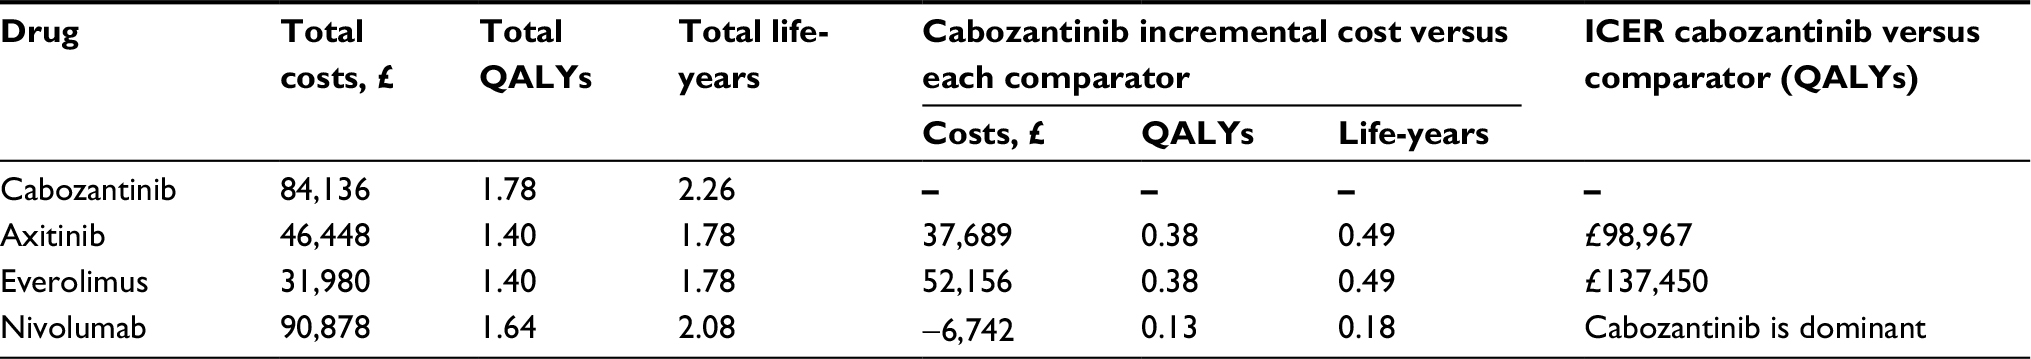 | Table 4 Base case deterministic results |
Figure 1 shows results from one-way sensitivity analyses of cabozantinib versus each of the comparators. Results were most sensitive to drugs’ costs, time horizon, and discount. Because of the higher treatment costs of axitinib compared to everolimus, discounts on acquisition prices for the former treatment had larger effects on the predicted ICERs. The results from probabilistic sensitivity analysis are shown in Figure 2. As expected, the scatter plots for comparisons of cabozantinib with axitinib and everolimus show similar distributions due to the underlying assumption of equal efficacy. The lower cost of the latter treatment causes the cost–utility acceptability curve to be more favorable in comparison of cabozantinib with axitinib, with a 50% likelihood of the treatment being cost-effective reaching at a willingness to pay the threshold of ~100,000 GBP. In comparison with nivolumab, the scatter plot shows that the additional QALYs gained come at a lower cost. The corresponding cost–acceptability curve indicates that cabozantinib is more likely than not to be cost-effective across the full range of hypothetical willingness-to-pay thresholds.
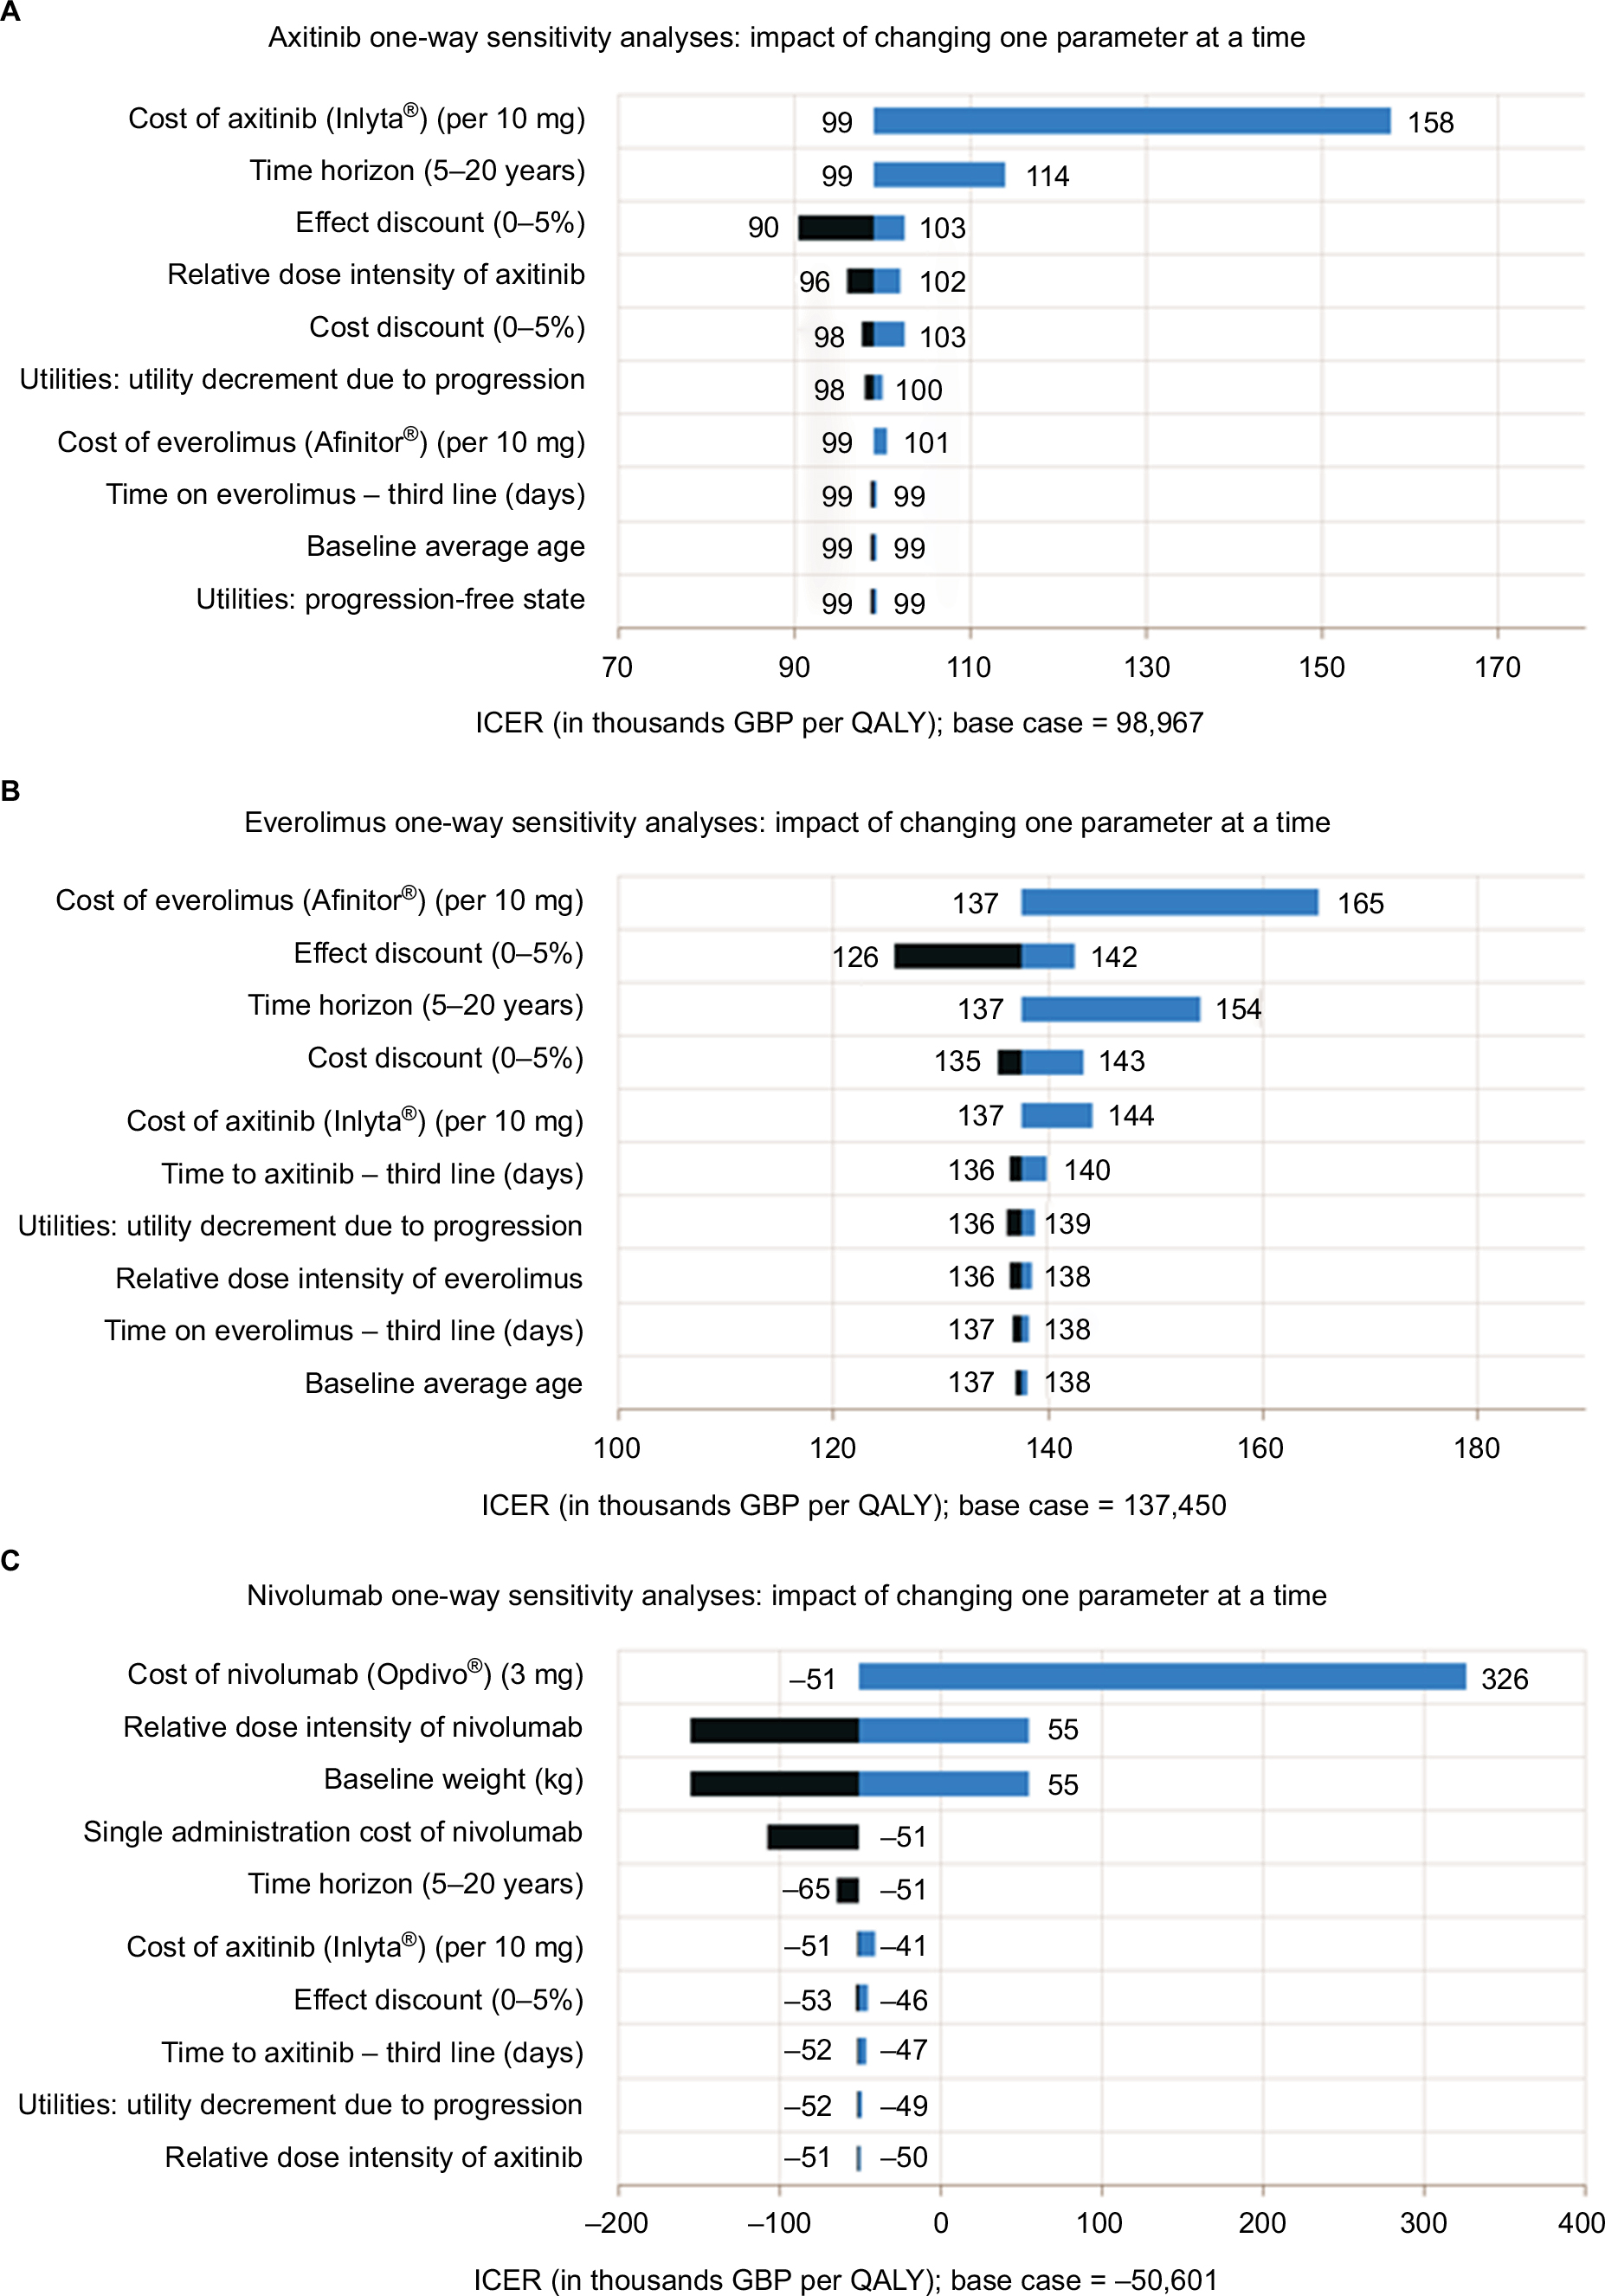 | Figure 1 (A-C) One-way sensitivity results: cabozantinib versus comparator. Notes: Light blue shading indicates scenarios with values below the reference case, while dark blue shading indicates higher values. Comparator drug costs were simulated for discounts between 0 and 30% of list prices, while baseline weight was modeled between 65 and 95 kg of body weight. Abbreviations: GBP, Great British Pounds; ICER, incremental cost-effectiveness ratio; QALY, quality-adjusted life-year. |
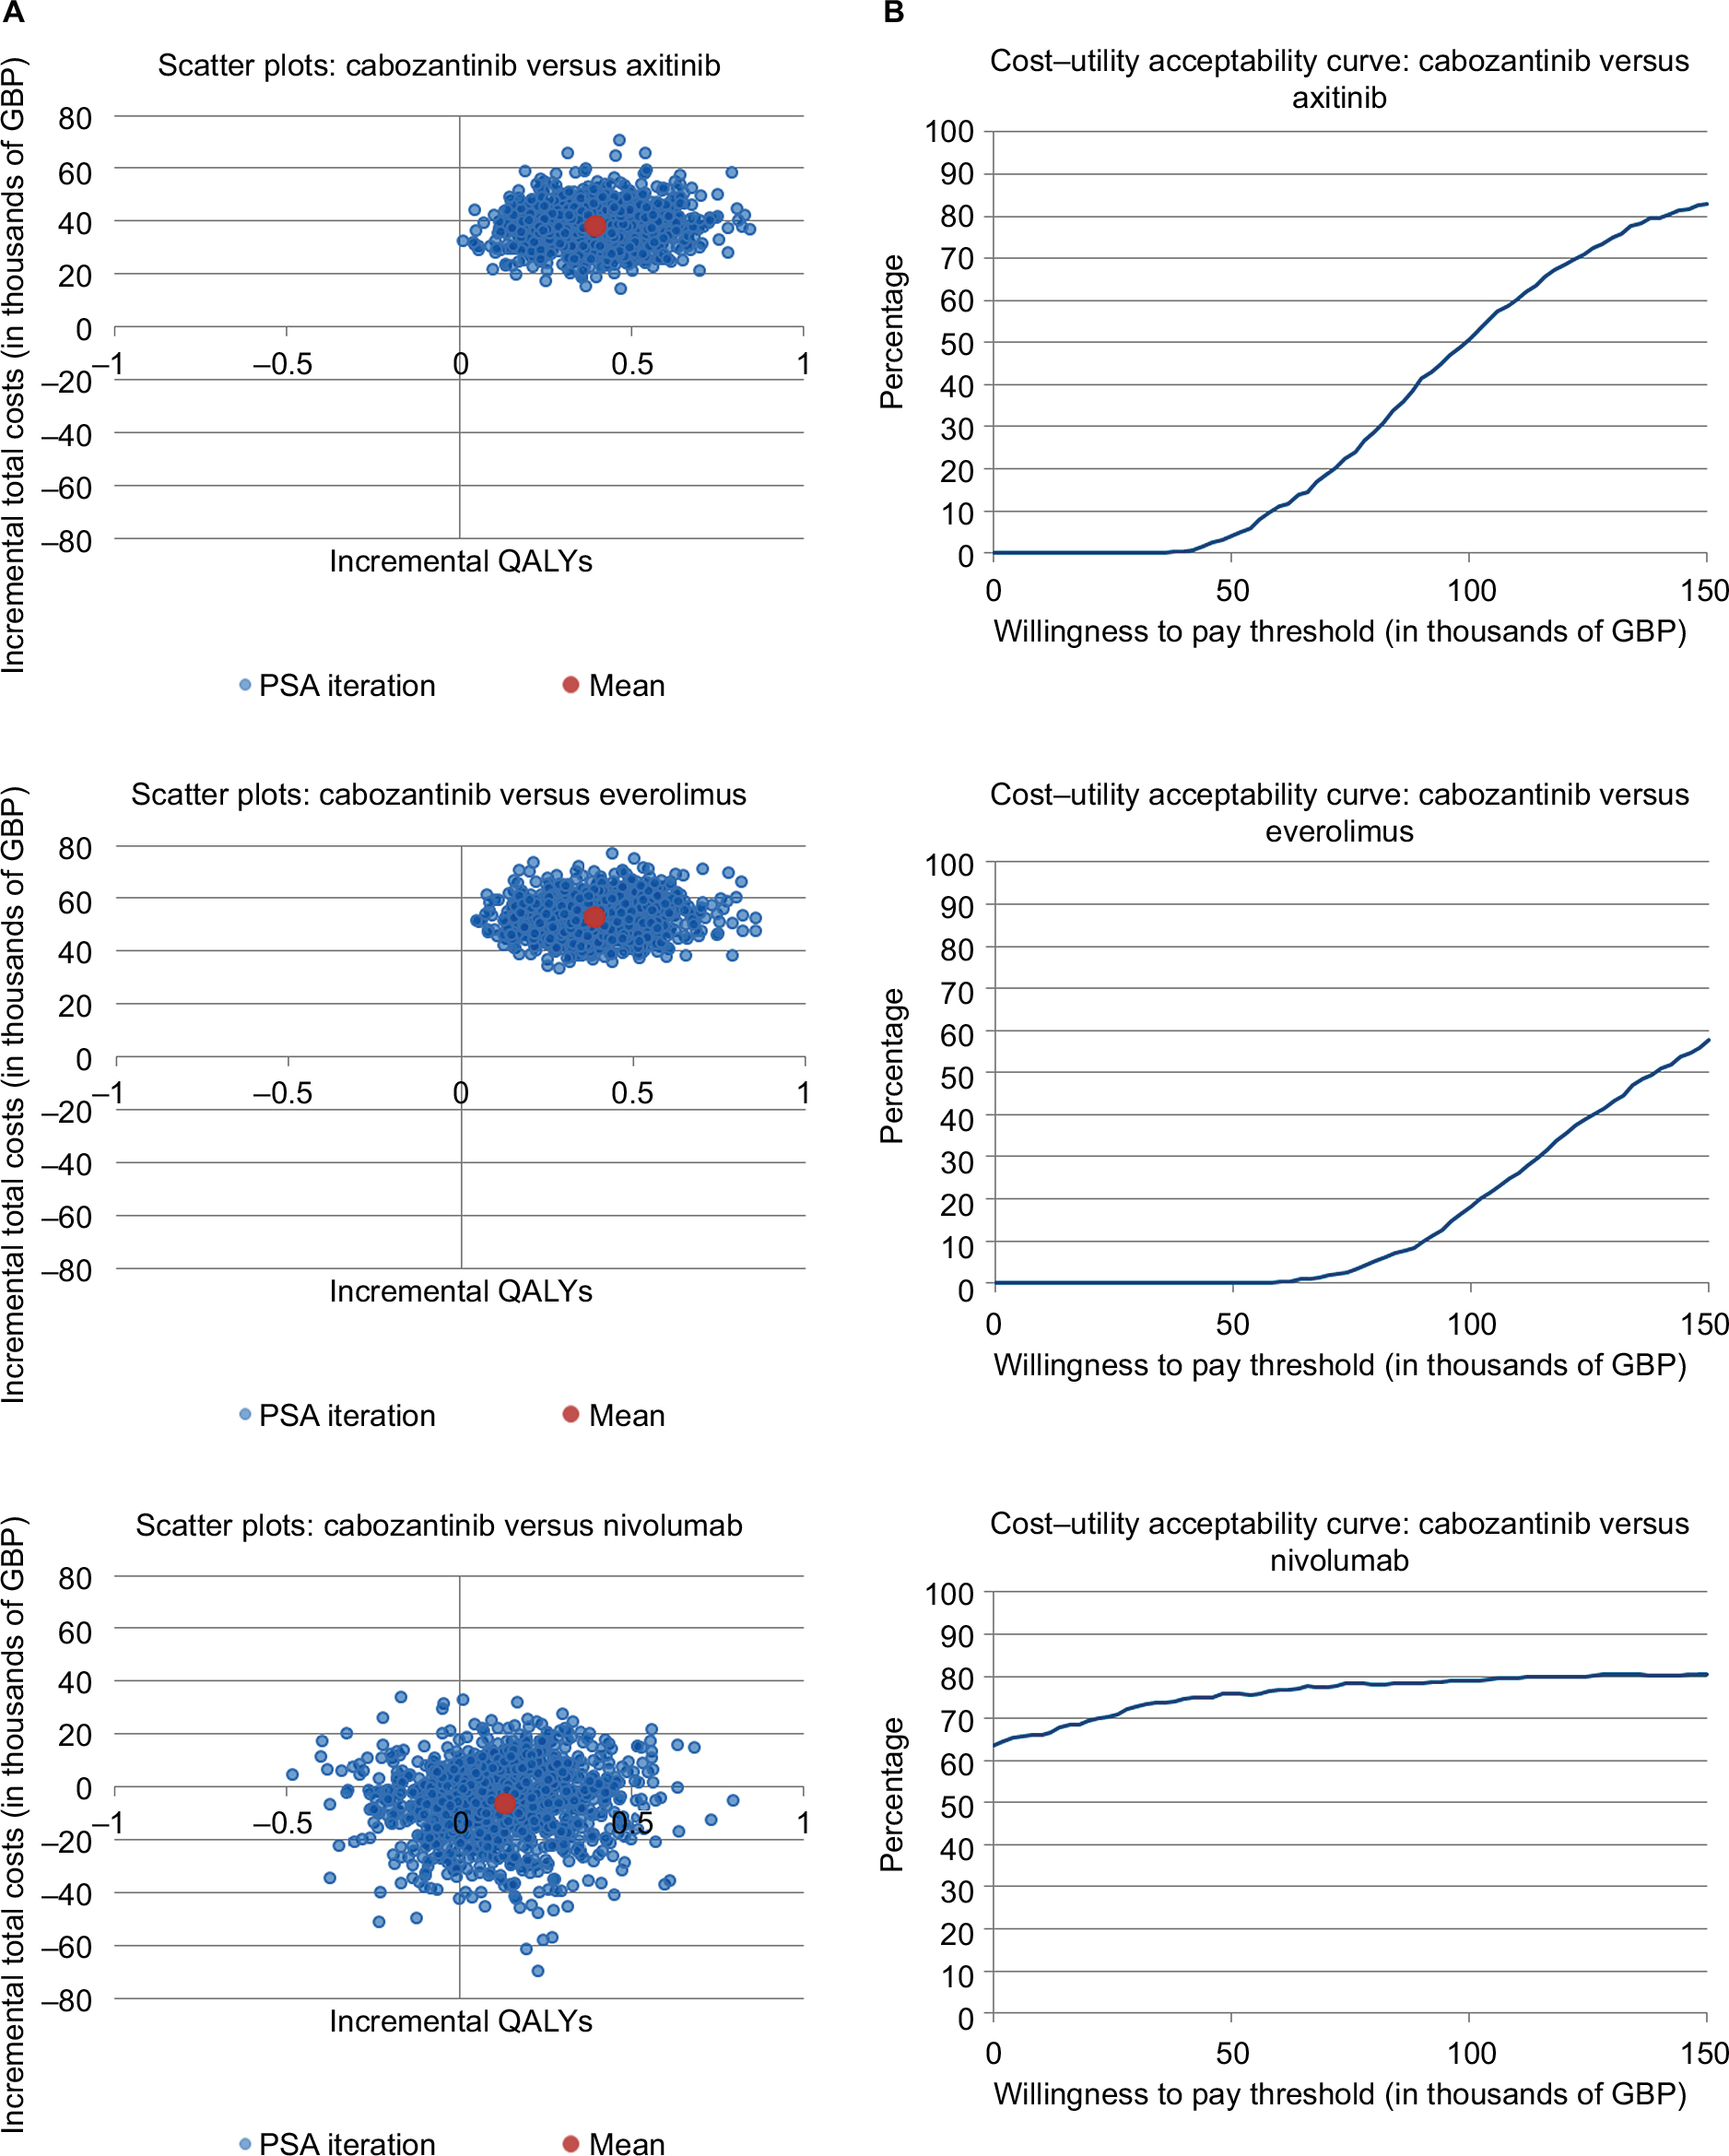 | Figure 2 Probabilistic sensitivity analyses: scatterplot and cost–acceptability curves. Notes: (A) Figures show mean (red) and spread (blue) of results from cost-effectiveness sensitivity analyses. The red dot in the nivolumab scenario is found in the lower right quadrant, indicating that cabozantinib is dominant, meaning both less expensive and more effective. (B) Graphs plot willingness to pay scenarios (x-axis) against the likelihood in percent that the treatment would be considered cost-effective (y-axis). Abbreviations: GBP, Great British Pounds; PSA, probabilistic sensitivity analyses; QALY, quality-adjusted life-year. |
Discussion
We developed a cost-effectiveness model to compare cabozantinib with everolimus, axitinib, and nivolumab in aRCC patients who experienced first-line treatment failure of VEGFR therapy in England. Cabozantinib was associated with most QALYs gained versus all comparators and was dominant (ie, more effective and less costly) in comparison with nivolumab. While this deterministic result versus nivolumab showed that cabozantinib is dominant, the probabilistic sensitivity analysis showed that, in fact, there is no clear difference in cost-effectiveness of these two treatments. In the scatter plots, the x-axis indicates how costly cabozantinib is compared with nivolumab, while the y-axis indicates the effectiveness comparing cabozantinib with nivolumab. Therefore, the points in north-east quadrant mean higher costs but more QALY gain when comparing cabozantinib with nivolumab. Figure 2 shows that the mean point of the scatter plots was quite close to the original points, which means costs and QALYs were similar in both cabozantinib and nivolumab treatments. We found in our NMA that OS is similar for cabozantinib and nivolumab and this may be the key driver for the similar cost-effectiveness also.
This analysis is subject to limitations and biases common to all modeling exercises, which combine data from numerous sources and make structural and data assumptions. Since the primary motivation for creating a model is to compare therapies in the absence of complete data, the limitation of heterogeneous input data can never be entirely avoided.
All assumptions were validated to ensure that they were justifiable on the basis of existing data and clinical opinion and were subjected to sensitivity analysis. The model used survival curve extrapolation for both PFS and OS, based on a previously published NMA.9 The result of the model was impacted by the assumptions around curve extrapolation. In order to examine this impact, we performed sensitivity analyses regarding the time horizon, which had a moderate impact on the results. The impact on the extrapolation of the curves was further assessed using deterministic sensitivity analyses in testing all distributions and using probabilistic sensitivity analyses on the curves, parameters. As additional, long-term or real-world data become available, the model can be adjusted and refined to further increase the predictive accuracy.
Trial design differences, especially with regard to treatment switching, made it impossible to establish reliable network connections between axitinib and its alternatives via published pivotal trial results. The subsequent assumption that axitinib has the same efficacy as everolimus, which was based on previously published study,13 is a key weakness. However, to the extent that outcomes can be compared, this assumption can be viewed as conservative – effectively improving axitinib effectiveness for the purpose of making cost–utility comparisons. Furthermore, time on treatment for axitinib was not identified in the published literature. For axitinib, PFS data were therefore used as a proxy for treatment duration. This might not necessarily reflect clinical practice in England, because some patients may receive treatment beyond progression. The results of this analysis demonstrate that improvements in OS and PFS with cabozantinib translate into longer-term gains in LYs and QALYs compared with all relevant comparators in England.
Conclusion
Using published drug costs, treatment with cabozantinib was more effective in terms of LYs and QALYs gained than treatment with everolimus or axitinib but also costlier. These conclusions held true across a range of scenarios and sensitivity analyses, including one-way and probabilistic analyses. The analysis also indicated that cabozantinib dominates nivolumab in terms of cost–utility. This study illustrates the added value of cabozantinib as a treatment for aRCC for patients who experienced treatment failure of previous VEGFR-based therapy.
Acknowledgments
Ipsen Pharm funded this study, participated in the analysis and interpretation of the data, contributed to the preparation, review, and approval of the article for publication, and covered costs for medical writing and editorial assistance provided by Silvia Paddock, PhD (Independent Consultant, Freiburg, Germany). In addition, all authors were involved in the decision to submit the article for publication and had the right to accept or reject comments or suggestions.
Disclosure
JM, JL, and RC are employees of Analytica Laser working under a current consulting agreement with Ipsen Pharm. A-LV and JD are employees of Ipsen Pharm. The authors report no other conflicts of interest in this work.
References
Escudier B, Porta C, Schmidinger M, et al. Renal cell carcinoma: ESMO clinical practice guidelines for diagnosis, treatment and follow-up. Ann Oncol. 2016;27(suppl 5):v58–v68. | ||
Kidney Cancer Incidence Statistics [webpage on the Internet]. Cancer Research UK. 2015. Available from: http://www.cancerresearchuk.org/health-professional/cancer-statistics/statistics-by-cancer-type/kidney-cancer/incidence. Accessed November 21, 2017. | ||
Kim DY, Wood CG, Karam JA. Treating the two extremes in renal cell carcinoma: management of small renal masses and cytoreductive nephrectomy in metastatic disease. Am Soc Clin Oncol Educ Book. 2014:e214–e221. doi: 10.14694/EdBook_AM.2014.34.e214. | ||
Gupta K, Miller JD, Li JZ, Russell MW, Charbonneau C. Epidemiologic and socioeconomic burden of metastatic renal cell carcinoma (mRCC): a literature review. Cancer Treat Rev. 2008;34(3):193–205. | ||
Delacroix S, Wood C, Jonasch E. Renal neoplasia. Brenner BM, Chertow GM, Marsden PA, Skorecki KS, Yu AS, editors. Brenner and Rector’s The Kidney. 9th ed. Philadelphia, PA, USA: Elsevier Saunders; 2011:1508–1528. | ||
NICE [webpage on the Internet]. Bevacizumab (First-line), Sorafenib (First- and Second-line), Sunitinib (Second-line) and Temsirolimus (First-line) for the Treatment of Advanced and/or Metastatic Renal Cell Carcinoma. NICE; 2017. Available from: https://www.nice.org.uk/Guidance/TA178. Accessed November 21, 2017. | ||
Choueiri TK, Escudier B, Powles T, et al. Cabozantinib versus everolimus in advanced renal-cell carcinoma. N Engl J Med. 2015;373(19):1814–1823. | ||
Choueiri TK, Escudier B, Powles T, et al. Cabozantinib versus everolimus in advanced renal cell carcinoma (METEOR): final results from a randomised, open-label, phase 3 trial. Lancet Oncol. 2016;17(7):917–927. | ||
Amzal B, Fu S, Meng J, Lister J, Karcher H. Cabozantinib versus everolimus, nivolumab, axitinib, sorafenib and best supportive care: a network meta-analysis of progression-free survival and overall survival in second line treatment of advanced renal cell carcinoma. PLoS One. 2017;12(9):e0184423. | ||
Schmidinger M, Danesi R. Management of adverse events associated with cabozantinib therapy in renal cell carcinoma. Oncologist. 2017;23(3):306–315. | ||
Motzer RJ, Escudier B, McDermott DF, et al. Nivolumab versus everolimus in advanced renal-cell carcinoma. N Engl J Med. 2015;373(19):1803–1813. doi: 10.1056/NEJMoa1510665. | ||
NICE [webpage on the Internet]. Guide to the Methods of Technology Appraisal 2013. NICE; 2017. Available from: https://www.nice.org.uk/process/pmg9/chapter/the-reference-case#discounting. Accessed December 11, 2017. | ||
Elsada A, Adler AI. NICE guidance on cabozantinib for previously treated advanced renal cell carcinoma. Lancet Oncol. 2017;18(9):1153–1154. | ||
Escudier B, Eisen T, Stadler WM, et al. Sorafenib for treatment of renal cell carcinoma: final efficacy and safety results of the phase III treatment approaches in renal cancer global evaluation trial. J Clin Oncol. 2009;27(20):3312–3318. | ||
Sherman S, Amzal B, Calvo E, et al. An indirect comparison of everolimus versus axitinib in US patients with advanced renal cell carcinoma in whom prior sunitinib therapy failed. Clin Ther. 2015:doi: 10.1016/j.clinthera.2015.09.013. | ||
NICE [webpage on the Internet]. Cabozantinib for Previously Treated Advanced Renal Cell Carcinoma. NICE; 2017. Available from: https://www.nice.org.uk/guidance/ta463. Accessed November 21, 2017. | ||
NICE [webpage on the Internet]. Nivolumab for Previously Treated Advanced Renal Cell Carcinoma. NICE; 2017. Available from: https://www.nice.org.uk/guidance/ta417/evidence. Accessed November 24, 2017. | ||
Herdman M, Gudex C, Lloyd A, et al. Development and preliminary testing of the new five-level version of EQ-5D (EQ-5D-5L). Qual Life Res. 2011;20(10):1727–1736. | ||
BNF Publications [webpage on the Internet]. Books. BNF Publications; 2017. Available from: https://www.bnf.org/products/books/. Accessed November 21, 2017. | ||
Exelixis. XL 184-308. A phase 3, randomized, controlled study of cabozantinib (XL184) vs everolimus in subjects with metastatic renal cell carcinoma that has progressed after prior VEGFR tyrosine kinase inhibitor therapy. NCT01865747; 2015. | ||
Rini BI, Escudier B, Tomczak P, et al. Comparative effectiveness of axitinib versus sorafenib in advanced renal cell carcinoma (AXIS): a randomised phase 3 trial. Lancet. 2011;378(9807):1931–1939. | ||
NICE [webpage on the Internet]. Nivolumab for Previously Treated Advanced Renal Cell Carcinoma. NICE; 2017. Available from: https://www.nice.org.uk/guidance/ta417. Accessed November 21, 2017. | ||
PSSRU [webpage on the Internet]. Unit Costs of Health and Social Care 2015. PSSRU; 2017. Available from: http://www.pssru.ac.uk/project-pages/unit-costs/unit-costs-2015/. Accessed November 21, 2017. | ||
GOV.UK [webpage on the Internet]. NHS Reference Costs 2014 to 2015. GOV.UK; 2017. Available from: https://www.gov.uk/government/publications/nhs-reference-costs-2014-to-2015. Accessed November 21, 2017. | ||
The Nuffield Trust [webpage on the Internet]. Exploring the Cost of Care at the End of Life. The Nuffield Trust; 2017. Available from: https://www.nuffieldtrust.org.uk/research/exploring-the-cost-of-care-at-the-end-of-life. Accessed November 21, 2017. | ||
Inflation [webpage on the Internet]. Historic Inflation Great Britain – Historic CPI Inflation Great Britain. 2017. Available from: http://www.inflation.eu/inflation-rates/great-britain/historic-inflation/cpi-inflation-great-britain.aspx. Accessed November 21, 2017. |
 © 2018 The Author(s). This work is published and licensed by Dove Medical Press Limited. The
full terms of this license are available at https://www.dovepress.com/terms
and incorporate the Creative Commons Attribution
- Non Commercial (unported, 3.0) License.
By accessing the work you hereby accept the Terms. Non-commercial uses of the work are permitted
without any further permission from Dove Medical Press Limited, provided the work is properly
attributed. For permission for commercial use of this work, please see paragraphs 4.2 and 5 of our Terms.
© 2018 The Author(s). This work is published and licensed by Dove Medical Press Limited. The
full terms of this license are available at https://www.dovepress.com/terms
and incorporate the Creative Commons Attribution
- Non Commercial (unported, 3.0) License.
By accessing the work you hereby accept the Terms. Non-commercial uses of the work are permitted
without any further permission from Dove Medical Press Limited, provided the work is properly
attributed. For permission for commercial use of this work, please see paragraphs 4.2 and 5 of our Terms.