
Back to Journals » Clinical Ophthalmology » Volume 19
Correlation of Blood Glucose Control With Cystoid Macular Edema and Central Macular Thickness After Cataract Surgery in Diabetics
Authors Ding R, Wu B  , Sun Y, Zhang X, Mi H, Kong Y, Ma Y
Received 12 November 2024
Accepted for publication 12 February 2025
Published 31 March 2025 Volume 2025:19 Pages 1129—1138
DOI https://doi.org/10.2147/OPTH.S506122
Checked for plagiarism Yes
Review by Single anonymous peer review
Peer reviewer comments 2
Editor who approved publication: Dr Scott Fraser
Rui Ding, BaoHua Wu, Yan Sun, XiaoYan Zhang, HaiZhou Mi, YueRong Kong, YanGang Ma
Department of Cataract Specialist, Lanzhou Bright Eyesight Hospital, Lanzhou City, Gansu Province, 730050, People’s Republic of China
Correspondence: BaoHua Wu, Department of Cataract Specialist, Lanzhou Bright Eyesight Hospital, No. 111, Nanbinhe Middle Road, Qilihe District, Lanzhou City, Gansu Province, 730050, People’s Republic of China, Email [email protected]
Objective: Macular edema and retinal thickening after cataract surgery can lead to poor vision in patients, especially in the presence of high glucose. Blood glycosylated hemoglobin (HbA1c) concentration plays an important role in assessing diabetic control and is closely related to cataract surgery prognosis. The aim of this study was to investigate the correlation between postoperative HbA1c levels and postoperative cystoid macular edema (CME) and central macular thickness (CMT) in diabetic cataract patients.
Methods: Retrospective analysis was conducted on 80 patients with diabetic cataracts from December 2018 to December 2023. The enrolled cases were divided into 2 groups according to the blood glucose control: 56 cases (56 eyes) in the intensive treatment group (HbA1c ≤ 7.0%) with insulin combined with oral hypoglycemic agents; and 24 cases (24 eyes) in the standard treatment group (HbA1c > 7.0%). The Student’s t-test or paired t-test was used to compare the changes in CMT between the two groups at each preoperative and postoperative time period. The chi-square test was used to compare the incidence of CME at each postoperative time period. Pearson or Spearman correlation was used to analyse the relationship between HbA1c levels and CMT or CME at each postoperative time period. Predictive efficacy was analyzed using ROC curves.
Results: Patients who went through the standard treatment showed significant CMT thickening and CME at 3 and 6 months postoperatively. HbA1c levels were positively correlated with CME and CMT at 1, 3, and 6 months postoperatively, with good predictive efficacy.
Conclusion: Postoperative HbA1c levels have a strong correlation with CME and CMT thickening and may be reliable and valid biomarkers.
Keywords: blood glucose control, cystoid macular edema, retinal thickness, HbA1c
Introduction
Globally, the number of diabetes mellitus (DM) patients is expected to increase to 350 million in the next decade. It is well known that DM can damage various systems and organs in the body, particularly the eyes. Diabetic cataract, akin to senile cataract, is the most prevalent form of cataract, with its incidence rising in correlation with the duration of DM.1 Diabetic cataracts often develop more rapidly and have a greater degree of clouding than other chronic cataracts.2 Clinically, the main methods used to treat diabetic cataracts are medication and cataract surgery. Pharmacologic treatment of diabetic cataracts is mainly directed at glycemic control drugs, antioxidants, and drugs to improve lens metabolism, but it can only alleviate the progression of diabetic cataracts to a certain extent.3 Surgery is a more effective option for patients whose vision has been severely affected. It should be noted, however, that DM patients are more susceptible to various factors, including postoperative control of blood glucose levels.4
Macular edema after cataract surgery can impair vision, especially in the elderly with DM. Optical coherence tomography (OCT), as a reproducible and high-resolution imaging method, can accurately measure the retinal thickness at the posterior pole and detect the presence of cystoid macular edema (CME) in time. DM patients in particular are more likely to have increased central macular thickness (CMT) after cataract surgery.5 In addition, in diabetic cataract patients, advanced age, insulin use, high glycosylated hemoglobin (HbA1c), and a history of diabetic retinopathy are the main risk factors for increased complications such as CME after surgery.6
There is substantial evidence that maintaining blood glucose levels between 80 and 180 mg/dL during the postoperative period is associated with improved surgical outcomes.7–9 Despite these data, it has been reported that only 59% of hospitalized patients are monitored for glucose, and of these, only 54% of monitored patients receive insulin therapy for elevated glucose levels.10 Of greater concern to us is the fact that DM patients with a history of insulin use show a worse prognosis than DM patients not treated with insulin.11 However, there are still many studies that report a reduction in adverse outcomes in DM patients after cardiac surgery to near that of non-DM patients when treated with insulin.12,13 Despite the high prevalence of DM in patients, few studies have focused on the relationship between postoperative blood glucose control and complications.
While most of the previous studies focused on fasting blood glucose control, this study assessed postoperative blood glucose control by HbA1c and to analyze the correlation between HbA1c levels and CMT and CME in DM patients with cataract surgery, providing a reference as well as a clinical scientific basis for safe and effective blood glucose management programs for diabetic cataract patients.
Materials and Methods
Study Subjects
Eighty diabetic cataract patients (80 affected eyes), who voluntarily underwent cataract surgery combined with IOL implantation in Lanzhou Bright Eyesight Hospital between December 2018 and December 2023, were selected at random. The selected cases were divided into 2 groups according to the blood glucose control. The intensive treatment group (HbA1c ≤ 7.0%) included 56 cases (56 affected eyes) receiving insulin combined with oral hypoglycemic agents. The standard treatment group (HbA1c>7.0%) consisted of 24 cases (24 eyes), using oral hypoglycaemic drugs. The gender and age of the patients in the two groups were no significant difference (P > 0.05). A priori statistical power analysis was performed using G*Power 3.1.9.7. The pre-determined statistical test power 1-β = 0.8 and significance level α = 0.05 were used as criteria to calculate the planned sample size, according to which the minimum required sample size was calculated to be 70. In addition, in order to avoid having a lapsed sample, the final number of participants totaled 80, which fulfilled the requirement for the experimental results to be credible.
Inclusion criteria: 1. Patients diagnosed with diabetic cataract with a history of type 2 DM; 2. Patients agreed to participate in the treatment and follow-up, with high compliance; 3. Patients whose preoperative ultrasound examination does not show lesions that affect the outcome of cataract surgery; 4. Patients aged 45–77 years old; 5. Patients’ preoperative visual acuity index as low as 0.2, classified as class I–III according to the LOCSII classification; 6. Patients who underwent phaco+IOL implantation without intraoperative complications; 7. Preoperative and postoperative optical coherence tomography provides clear images that meet the requirements of high axial and lateral resolution and high contrast to accurately determine and analyze CMT, while excluding patients with macular lesions, while excluding patients with macular lesions; 8. Patients with lesions in both eyes who are eligible for surgery in one eye; 9. Patients who were followed up in the outpatient clinic for at least 6 months.
Exclusion criteria: (1) patients with a history of ocular surgery, dry eye, uveitis, ocular inflammation, corneal clouding, glaucoma, and ocular trauma; (2) patients with diabetic macular edema and diabetic retinopathy; (3) patients with contraindications to phacoemulsification (PHACO); (4 patients with a combination of severe cardiopulmonary, hepatic, and renal dysfunction; (5) patients with psychiatric disease or neurological dysfunction; (6) Patients diagnosed with Irvin gass syndrome based on a comprehensive ophthalmologic examination and OCT; (7) Patients with other retinal pathologies such as age-related macular degeneration, retinal vein occlusion, high myopia more than 6D or axial length more than 26 mm.
Surgery
Preoperatively, all patients underwent a complete general and ocular examination, including natural visual acuity, best-corrected visual acuity (BCVA), and optometry. Intraocular pressure (IOP) was measured by VISUPLAN 500 non-contact tonometry (ZEISS, German), and anterior segment was examined by slit lamp. All patients underwent cataract extraction by ultrasonic emulsification combined with posterior chamber IOL implantation under local anesthesia. The surgeries were performed by the same experienced ophthalmologist using the same ophthalmic surgical microscope and the standard technique. The process followed the steps of making an incision, tearing the capsule, using ultrasonic emulsification, implanting the IOL, and closing the incision.14 The output power of PHACO mode and I/A mode was selected according to the physician’s requirements and the hardness of the patient’s lens. Phaco machine configurations were set to a phaco power of 50, vacuum at 60 mm Hg, and a flow rate of 25. Blood glucose was drawn every 0.5 h during the surgery. The blood glucose level was closely monitored and adjusted in time.
General Data Collection
General data were collected, including gender, age, smoking history, drinking history, past medical history, duration of DM, duration of cataract, and surgery. BCVA of the patients was measured using Topcon KR-8900 computerised optometry.
Laboratory Tests
All participants abstained from eating for 8 hours starting at 10 PM the night before the examination, and 5 mL of elbow venous blood was drawn in the early morning of the test day on an empty stomach. Fasting blood glucose, total cholesterol (TC), triglycerides (TG), high-density lipoprotein cholesterol (HDL-C), and low-density lipoprotein cholesterol (LDL-C) were measured by using a fully automated biochemistry analyzer (AU680, Beckman Coulter; Shanghai, China). Postoperative blood glucose control was assessed by HbA1c level.
OCT
In addition to the routine examination, patients underwent OCT before, 1 week, 1, 3 and 6 months after surgery. An Optovue-RTVue100-2 OCT scanner was used, with a scanning depth of 2 mm and an axial resolution of 5 μm. The patient was seated in the examination position, and linear and regional scans were performed in the vertical and horizontal directions, centered on the macular plexus, with an area size of 6 mm × 6 mm, and a scan density of 20 μm at intervals. CMT was analyzed and subdivided into subfoveal choroidal thickness, cube volume, and cube average thickness.
According to the patient’s subjective postoperative visual loss and clear cystoid edema on OCT macular scan, regardless of the extent of edema and the thickness of the nerve fiber layer, as well as the postoperative increase in CMT by more than 30% of the preoperative thickness, it was recorded as CME.
In cases where OCT fails to show typical cystic structural alterations and only indicates other issues such as retinal thickening, coupled with either no significant change or only slight fluctuation in the patient’s visual acuity, it could be a pseudo-CME.
Outcome Indicators
Patients were followed up after surgery for six months in all 80 cases. The relevant examinations were completed at 1 week, 1, 3, and 6 months postoperatively, respectively. OCT examination and blood biochemical tests were performed at each follow-up to assess the prognosis. During the follow-up period, three patients were excluded due to 1) invalid, unsatisfactory, or missing specimens; 2) large amount of missing data; and 3) withdrawal from the study.
Statistical Analysis
SPSS 26.0 was applied for statistical analysis. For the one-way analysis of numerical variables, normality was first tested using the Shapiro–Wilk test. Measurements were tested for normality, and those with a normal distribution were expressed in the form of mean ± standard deviation (SD), and comparisons between two groups were made using the t-test. Non-normal distributions were expressed as median interquartile spacing M (Q25~Q75), and comparisons between groups were made using the Wilcoxon signed rank sum test. The chi-square test was performed for count data. The student t test or paired t test was used to compare the changes in CMT between the two groups of patients at each preoperative and postoperative time period. The chi-square test was used to compare the incidence of CME at each postoperative time period. Pearson or Spearman correlation was used to analyze the relationship between HbA1c level and the incidence of CMT or CME at each postoperative period. The predicted efficacy was analyzed by ROC curve analysis to obtain the area under the curve (AUC), confidence interval, sensitivity, specificity and cut-off value of HbA1c. Significant difference was defined as P < 0.05.
Results
Clinical General Data of Patients at 6 months Postoperatively
Blood glucose control methods included oral hypoglycaemic agents and intensive treatment with insulin. A total of 80 patients were enrolled and divided into 2 groups according to the blood glucose control regimen: 56 patients in the intensive treatment group and 24 patients in the standard treatment group. The clinicopathological characteristics of all subjects are shown in Table 1. There was no significant difference in age between the two groups (P > 0.05), the patients in the intensive treatment group ranged from 53–66 years with a mean age of (60.01 ± 6.27) years and the patients in the standard treatment group ranged from 55–65 years with a mean age of (60.70 ± 4.82) years. Apart from this, no significant difference was found between the two groups in terms of BMI, past medical history, pathological examination, and lipid profile (TC, TG, HDL, and LDL) (P > 0.05). OCT examination showed that there was no significant difference between subfoveal choroidal thickness, cube volume, and cube average thickness between the two groups. CMT and the incidence of CME in the intensive treatment group were significantly lower than those in the standard treatment group (both P < 0.05).
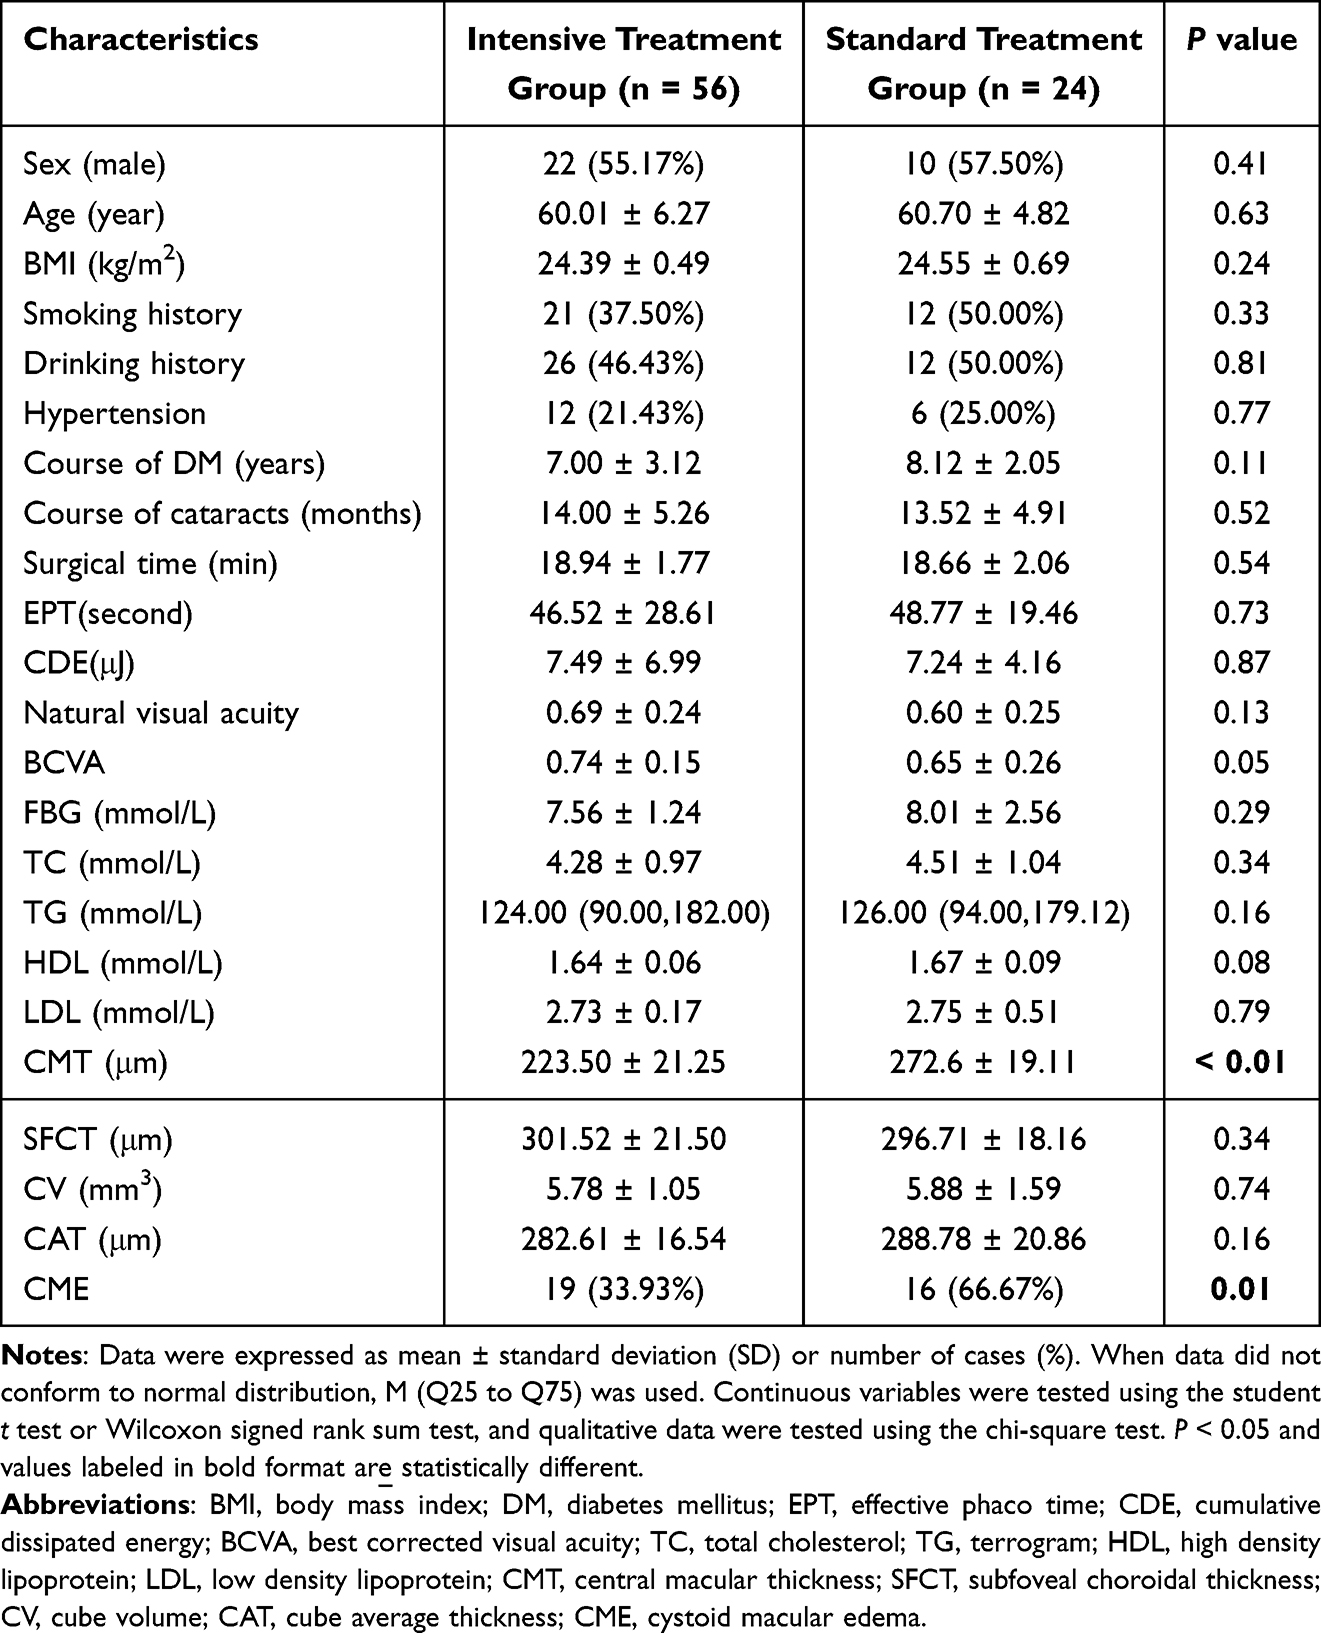 |
Table 1 Comparison of the Clinical General Data of the Two Groups of Patients |
CMT Changes and CME Incidence at Different Times Preoperatively and Postoperatively
The difference in the preoperative 1 day CMT was not significant (P > 0.05). And at 1 week, 1, 2 and 3 months after surgery, CMT in the standard treatment group was higher than that in the intensive treatment group (P < 0.05). In the intensive treatment group, the postoperative CMT was mildly higher than that of the preoperative 1 day, and the difference was not significant (P > 0.05, Figure 1A). In the standard treatment group, postoperative CMT was significantly thickened at 3 and 6 months compared with preoperative 1 day and postoperative 1 week (P < 0.05, Figure 1B). The difference was not statistically significant at the remaining time period (P > 0.05) (Table 2).
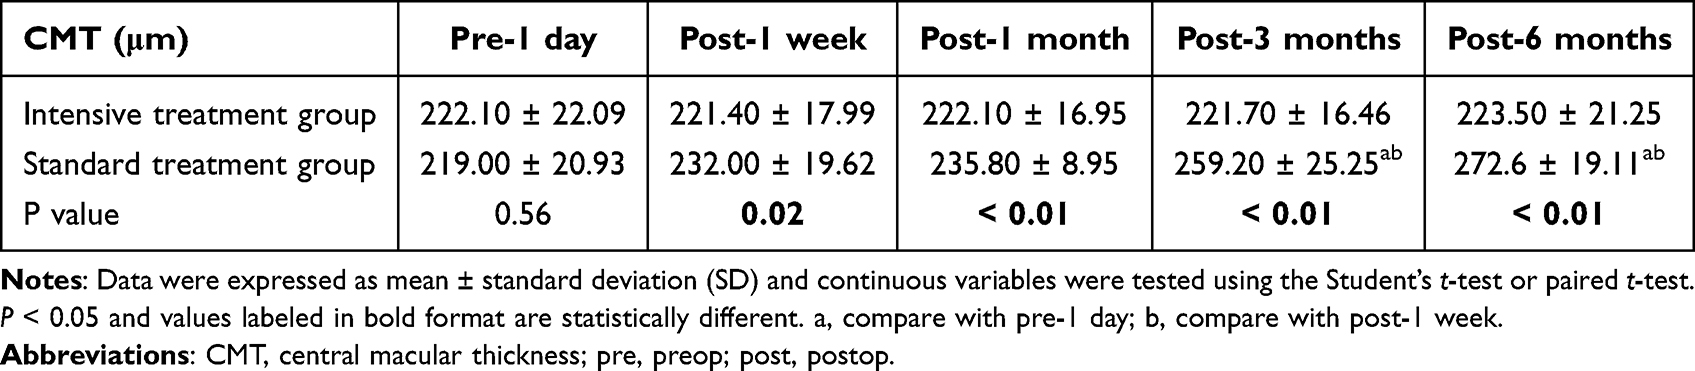 |
Table 2 Comparison of Preoperative and Postoperative CMT at Various Times Between the Two Groups of Patients |
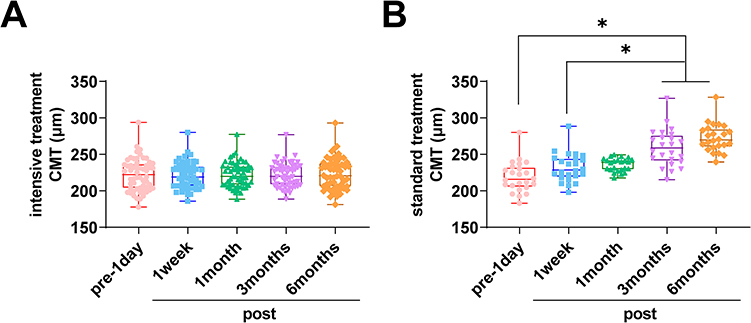 |
Figure 1 Comparison of the changes in CMT between the two groups of patients at different times in the preoperative and postoperative periods. (A) intensive treatment CMT at different times; (B) standard treatment CMT at different times. *P < 0.05 is statistically different. |
There was no CME in both groups preoperatively. The incidence of CMT was higher in the standard treatment group than in the intensive treatment group at 3 and 6 months postoperatively (P < 0.05). In the intensive treatment group, the incidence of CME was mildly elevated at all postoperative time periods compared with the preoperative 1 day, and the difference was not significant (P > 0.05, Figure 2A). Notably, in the standard treatment group, the incidence of CME was significantly reduced at 3 and 6 months postoperatively compared with 1 week postoperatively (P < 0.05, Figure 2B). The difference was not statistically significant at the remaining time periods (P > 0.05) (Table 3).
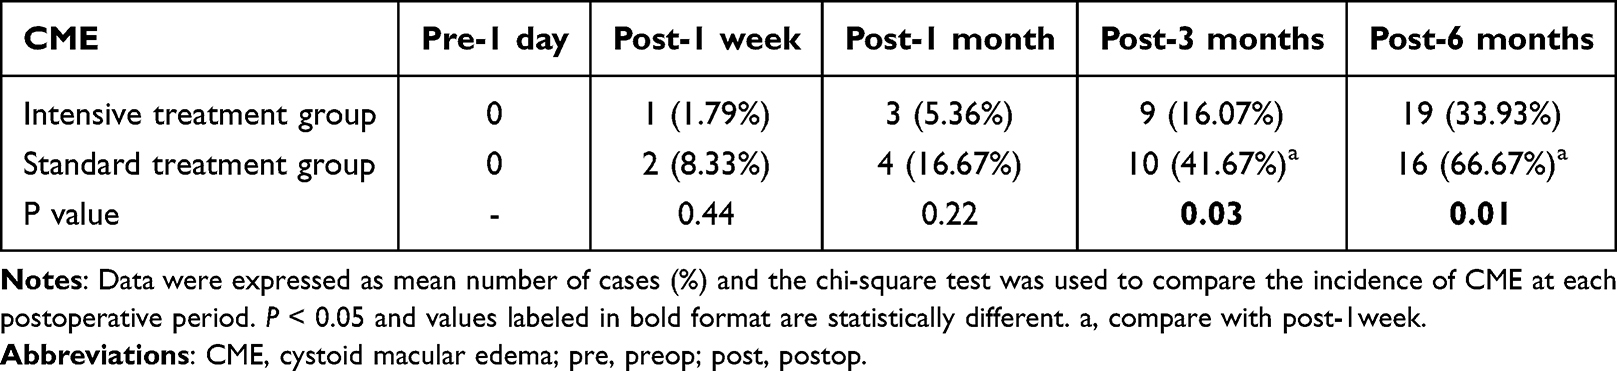 |
Table 3 Comparison of CME Between the Two Groups of Patients at Preoperative and Postoperative Time Periods |
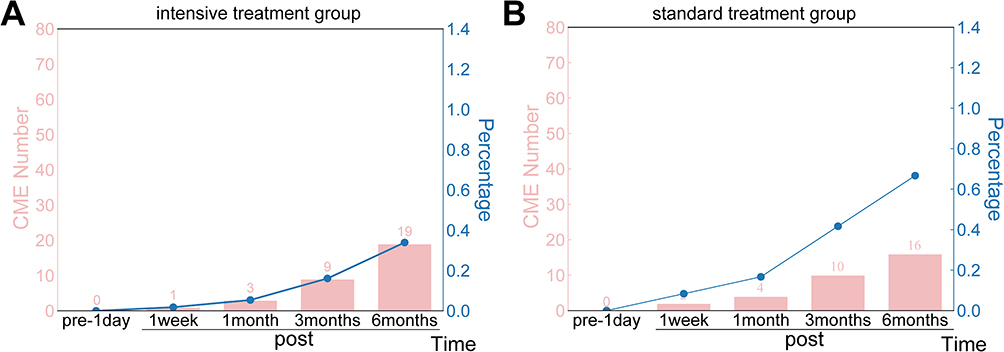 |
Figure 2 Comparison of the incidence of CME between the two groups at different times in the preoperative and postoperative periods. P < 0.05. (A) CME number in the intensitive treatment group; (B) CME number in the standard treatment group. |
Correlation Analysis of HbA1c With CMT Changes and CME
Based on Pearson’s correlation analysis, HbA1c level did not correlate with CMT at 1 week postoperatively, and positively correlated with CME changes at 1 month (r = 0.262, P = 0.019), 3 months (r = 0.373, P = 0.001), and 6 months (r = 0.320, P = 0.001) postoperatively. The results suggest that blood glucose control was positively correlated with CMT at different postoperative times, and none of the changes over a short period of time were significantly associated with changes in CMT (Table 4). Similarly, as shown by Spearman correlation analysis, HbA1c levels were not correlated with 1-week postoperative CME, and were positively correlated with changes in CME at 1 month (r = 0.230, P = 0.041), 3 months (r = 0.345, P = 0.001), and 6 months (r = 0.228, P = 0.042) after surgery. These results suggest that prolonged blood glucose control of patients significantly attenuates postoperative CMT and reduces the incidence of CME.
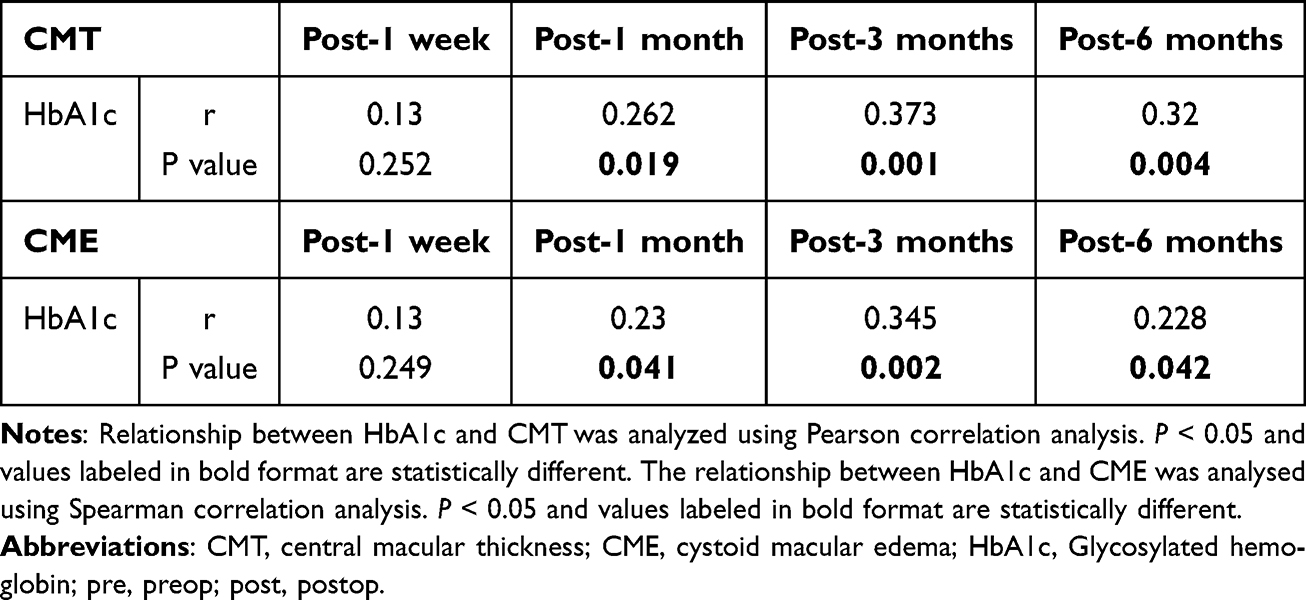 |
Table 4 Correlation Analysis of Blood Glucose Control With Changes in CMT and CME |
ROC Curve of HbA1c in Predicting CMT Thickening and CME in Patients After Surgery
The predictive efficacy of HbA1c in predicting CMT thickening and CME in patients was further explored. ROC curves were plotted using patients who experienced CMT thickening and CME as positive samples, and patients who did not experience CMT thickening and CME as negative samples (Table 5 and Figure 3A). The AUC for HbA1c was 0.650 (95CI% = 0.520–0.772, P = 0.021). When the cut-off value was taken as HbA1c > 6.125 mmol/L, the sensitivity for predicting CMT thickening and CME was 43.24% and the specificity was 88.37%. The results suggest that HbA1c has a predictive validity for CMT thickening and CME in patients after surgery.
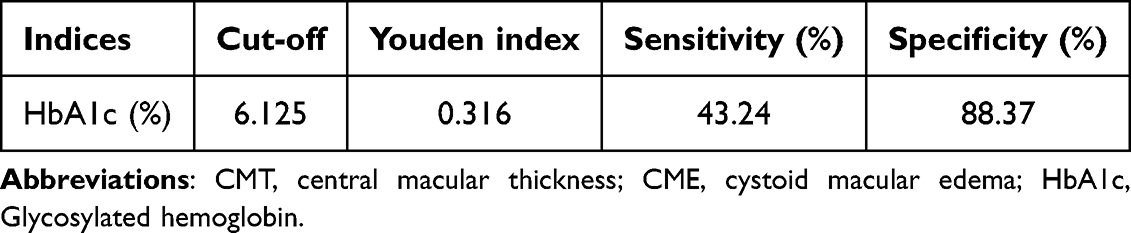 |
Table 5 ROC Curves of HbA1c Predicting the Occurrence of CMT Thickening and CME in Patients After Surgery |
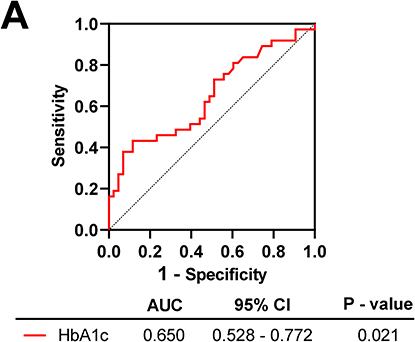 |
Figure 3 ROC curve to assess the predictive efficacy of HbA1c level on CMT thickening and CME in patients. P < 0.05. (A) Sensitivity and specificity of HaA1c. |
Discussion
Cataract accounts for about 65.5% of diabetic ocular complications. Persistent hyperglycaemia leads to certain changes in the IOP and glycoprotein basification, which can cause cataracts, leading to clouding of the lens and loss of visual acuity.15 CME and CMT thickening postoperatively have a significant impact on poor vision after cataract surgery. Therefore, monitoring of blood glucose levels is critical to prevent CME and CMT thickening in DM patients after cataract surgery. In this study, patients who went through the standard blood glucose control regimen showed significant CME and CMT thickening at 3 and 6 months postoperatively, and the patients’ HbA1c levels were positively correlated with CME and CMT at 1, 3, and 6 months postoperatively. This suggests that blood glucose control of patients significantly attenuated postoperative CMT thickening and reduced the incidence of CME.
Poorer blood glucose control is the most reported risk factor for CME after cataract surgery.16,17 At present, fasting blood glucose and postprandial blood glucose are commonly used for perioperative preparation in clinical practice, which can only reflect the instantaneous blood glucose of patients and has more interfering factors.18 Whereas HbA1c is more truly reflective of blood glucose control of DM patients in the last 2–3 months. It has the advantages of a low level of biological variability, good stability, independence from fluctuations in blood glucose due to diet, stress and other factors, and flexibility in the time of blood collection.19–21 Therefore, the HbA1c index was chosen to assess postoperative blood glucose control in this study.
HbA1c levels are positively correlated with macular retinal thickness and volume in patients with DM 10-year duration.22 Goebel et al measured the macular retinal thickness in 136 patients with diabetic retinopathy by OCT, which was significantly higher than that of normal controls. This suggests that chronic hyperglycaemia significantly affects CMT.23 In this study, the glycemic control was assessed by testing HbA1c in the postoperative period, which mainly reflects the effect of postoperative glycemic control on CME and CMT in diabetic cataract patients, which is important for the prevention of postoperative complications and the development of glycemic control programs. This study showed that the CMT of patients in the standard treatment group showed an increasing trend at 3 and 6 months postoperatively, and CME was more severe and lasted longer in patients with high HbA1c. Correlation analysis showed a positive correlation between the two, suggesting that patients with high HbA1c had more severe CME and CMT thickening. This is in general agreement with previous findings.24 We speculate that when the level of HbA1c is elevated, the combination with oxygen is reduced, aggravating tissue ischemia and hypoxia, causing further dilation of capillaries and increased release of inflammatory factors, coupled with a greater post-surgical stress response, accompanied by a large amount of inflammatory factors released into the eye, exacerbating the changes in capillary permeability, resulting in CMT thickening.25–27 Combined with the results with the intensive treatment group, we believe that if HbA1c is controlled below 7% in the postoperative period, it may be able to effectively improve the recovery after cataract surgery and reduce the occurrence of complications.
There are some limitations to this study. The follow-up period was short. The present study only observed up to 6 months after cataract surgery, which did not allow us to know the CMT changes in the long term. It is expected to be confirmed in future studies combined with strict postoperative glucose and HbA1c monitoring, and long-term follow-up studies. Secondly, due to the limited sample size, the number of cases between groups was not evenly distributed, which may have some impact on the results of this study. In this regard, the correlation between HbA1c and retinal thickness changes after cataract surgery needs to be confirmed in the future by further expanding the sample size. Further confirmation is expected from a multicenter, large-sample study. The condition of the retinal periphery and the stage of diabetic retinopathy were not mentioned in this study. Currently, we still lack image analysis software for automated detection and grading of various retinal diseases, so we expect that the future use of new instruments to further improve the diagnostic and treatment process of ultra-wide-angle detection will help to improve the accuracy and efficiency of identifying peripheral retinal conditions and the stage of diabetic retinopathy.
Based on the results of the present study, postoperative HbA1c levels were strongly correlated with CME and CMT changes. This may have an adjunctive predictive role in the prevention of CME and CMT thickening as a complication due to poor postoperative glycemic control. It also provides a reference for making a better perioperative control program for diabetic cataract patients who need cataract surgery in the clinic. This is important in determining the range of postoperative HbA1c levels and the frequency of perioperative glucose monitoring in order to make timely adjustments to the glucose-lowering regimen, and also to further influence the selection of medications to be taken and dosage adjustments. This is helpful in developing individualized management of diabetic cataract patients and developing a more precise blood glucose monitoring and management plan. Future research, based on the optimal glycemic control target, will develop a glycemic management program and its evaluation system to accurately manage the patient’s blood glucose and allow for more comprehensive care.
Data Sharing Statement
The datasets used and/or analyzed during the present study are available from the corresponding author on reasonable request.
Ethics Approval
The present study was approved by the Ethics Committee of Lanzhou Bright Eyesight Hospital and written informed consent was provided by all patients prior to the study start. All procedures were performed in accordance with the ethical standards of the Institutional Review Board and The Declaration of Helsinki, and its later amendments or comparable ethical standards.
Funding
Lanzhou Science and Technology Program Guide Project (No. 2023-ZD-107).
Disclosure
The authors have no conflicts of interest to declare.
References
1. Alabdulwahhab KM. Senile cataract in patients with diabetes with and without diabetic retinopathy: a community-based comparative study. J Epidemiol Glob Health. 2022;12(1):56–63. doi:10.1007/s44197-021-00020-6
2. PMBBS DTO. Aqueous Humour Electrolyte Levels in Diabetic and Non-Diabetic Patients Undergoing Cataract Surgery and Their Relationship With the Morphology of Cataracts. Rajiv Gandhi University of Health Sciences; 2019.
3. Mrugacz M, Pony-Uram M, Bryl A, Zorena K. Current approach to the pathogenesis of diabetic cataracts. Int J mol Sci. 2023;24(7):6317. doi:10.3390/ijms24076317
4. Silpa-Archa S, Papirachnart A, Singhanetr P, Preble JM. Risk factors for endophthalmitis after cataract surgery in diabetic patients: a case control study. Int J Ophthalmol. 2019;12(3):417–423. doi:10.18240/ijo.2019.03.11
5. Shelsta HN, Jampol LM. Pharmacologic therapy of pseudophakic cystoid macular edema: 2010 update. Retina. 2011;31(1):4–12. doi:10.1097/IAE.0b013e3181fd9740
6. Lara-Smalling A, Cakiner-Egilmez T. Diabetes and cataract surgery: preoperative risk factors and positive nursing interventions. Insight. 2014;39(2):18–20.
7. King JT Jr, Goulet JL, Perkal MF, Rosenthal RA. Glycemic control and infections in patients with diabetes undergoing noncardiac surgery. Ann Surg. 2011;253(1):158–165. doi:10.1097/SLA.0b013e3181f9bb3a
8. Tarbunou YA, Smith JB, Kruse RL, Vogel TR. Outcomes associated with hyperglycemia after abdominal aortic aneurysm repair. J Vasc Surg. 2019;69(3):763–73.e3. doi:10.1016/j.jvs.2018.05.240
9. Vogel TR, Smith JB, Kruse RL. The association of postoperative glycemic control and lower extremity procedure outcomes. J Vasc Surg. 2017;66(4):1123–1132. doi:10.1016/j.jvs.2017.01.053
10. Levetan CS, Passaro M, Jablonski K, Kass M, Ratner RE. Unrecognized diabetes among hospitalized patients. Diabetes Care. 1998;21(2):246–249. doi:10.2337/diacare.21.2.246
11. Greco G, Ferket BS, D’Alessandro DA, et al. Diabetes and the association of postoperative hyperglycemia with clinical and economic outcomes in cardiac surgery. Diabetes Care. 2016;39(3):408–417. doi:10.2337/dc15-1817
12. Furnary AP, Gao G, Grunkemeier GL, et al. Continuous insulin infusion reduces mortality in patients with diabetes undergoing coronary artery bypass grafting. J Thorac Cardiovasc Surg. 2003;125(5):1007–1021. doi:10.1067/mtc.2003.181
13. Schmeltz LR, DeSantis AJ, Thiyagarajan V, et al. Reduction of surgical mortality and morbidity in diabetic patients undergoing cardiac surgery with a combined intravenous and subcutaneous insulin glucose management strategy. Diabetes Care. 2007;30(4):823–828. doi:10.2337/dc06-2184
14. Grzybowski A. Recent developments in cataract surgery. Ann Transl Med. 2020;8(22):1540. doi:10.21037/atm-2020-rcs-16
15. Jing Z, Hao J, Sun L, et al. Analysis of influencing factors of corneal edema after phacoemulsification for diabetic cataract. Cell mol Biol (Noisy-le-Grand). 2023;69(4):164–171. doi:10.14715/cmb/2023.69.4.26
16. Choi K, Park SJ, Yoon H, et al. Patient-centered economic burden of diabetic macular edema: retrospective cohort study. JMIR Public Health Surveill. 2024;10:e56741. doi:10.2196/56741
17. Wei Q, Qiu W, Liu Q, Jiang Y. Relationship between risk factors and macular thickness in patients with early diabetic retinopathy. Int J Gen Med. 2022;15:6021–6029. doi:10.2147/IJGM.S366348
18. Song C, Yuan S, Cui K, et al. HbA1c-based rather than fasting plasma glucose-based definitions of prediabetes identifies high-risk patients with angiographic coronary intermediate lesions: a prospective cohort study. Cardiovasc Diabetol. 2023;22(1):68. doi:10.1186/s12933-023-01750-6
19. Weykamp C, Siebelder C, Lenters E, Slingerland R, English E. The risk of clinical misinterpretation of HbA1c: modelling the impact of biological variation and analytical performance on HbA1c used for diagnosis and monitoring of diabetes. Clin Chim Acta. 2023;548:117495. doi:10.1016/j.cca.2023.117495
20. Wang X, Zeng Y, He H, et al. Biological variation of cardiovascular biochemical markers in patients with Type 2 Diabetes Mellitus. Clin Chim Acta. 2022;534:161–166. doi:10.1016/j.cca.2022.07.017
21. Suthutvoravut U, Anothaisintawee T, Boonmanunt S, et al. Efficacy of time-restricted eating and behavioral economic intervention in reducing fasting plasma glucose, HbA1c, and cardiometabolic risk factors in patients with impaired fasting glucose: a randomized controlled trial. Nutrients. 2023;15(19):4233. doi:10.3390/nu15194233
22. Yeung L, Sun CC, Ku WC, et al. Associations between chronic glycosylated haemoglobin (HbA1c) level and macular volume in diabetes patients without macular oedema. Acta Ophthalmol. 2010;88(7):753–758. doi:10.1111/j.1755-3768.2009.01711.x
23. Goebel W, Franke R. Retinal thickness in diabetic retinopathy: comparison of optical coherence tomography, the retinal thickness analyzer, and fundus photography. Retina. 2006;26(1):49–57. doi:10.1097/00006982-200601000-00009
24. Boned-Murillo A, Fernández-Espinosa G, Orduna-Hospital E, et al. Changes in inner retina thickness and macular sensitivity in patients with type 2 diabetes with moderate diabetic retinopathy. Biomedicines. 2023;11(11):2972. doi:10.3390/biomedicines11112972
25. Mrugacz M, Bryl A, Zorena K. Retinal vascular endothelial cell dysfunction and neuroretinal degeneration in diabetic patients. J Clin Med. 2021;10(3):458. doi:10.3390/jcm10030458
26. Zghebi SS, Rutter MK, Ashcroft DM, et al. Using electronic health records to quantify and stratify the severity of type 2 diabetes in primary care in England: rationale and cohort study design. BMJ Open. 2018;8(6):e020926. doi:10.1136/bmjopen-2017-020926
27. Li X, Yu Y, Liu X, et al. Quantitative analysis of retinal vessel density and thickness changes in diabetes mellitus evaluated using optical coherence tomography angiography: a cross-sectional study. BMC Ophthalmol. 2021;21(1):259. doi:10.1186/s12886-021-01988-2
 © 2025 The Author(s). This work is published and licensed by Dove Medical Press Limited. The
full terms of this license are available at https://www.dovepress.com/terms
and incorporate the Creative Commons Attribution
- Non Commercial (unported, 4.0) License.
By accessing the work you hereby accept the Terms. Non-commercial uses of the work are permitted
without any further permission from Dove Medical Press Limited, provided the work is properly
attributed. For permission for commercial use of this work, please see paragraphs 4.2 and 5 of our Terms.
© 2025 The Author(s). This work is published and licensed by Dove Medical Press Limited. The
full terms of this license are available at https://www.dovepress.com/terms
and incorporate the Creative Commons Attribution
- Non Commercial (unported, 4.0) License.
By accessing the work you hereby accept the Terms. Non-commercial uses of the work are permitted
without any further permission from Dove Medical Press Limited, provided the work is properly
attributed. For permission for commercial use of this work, please see paragraphs 4.2 and 5 of our Terms.