Back to Journals » Journal of Asthma and Allergy » Volume 15
Correlation of Activation Site and Number with the Clinical Response to Bronchial Thermoplasty
Authors Wang T ![]() , Long F, Huang Z, Long L, Huang W, Hu S, Hu F, Fu P, Gan J, Dong H, Yan G
, Long F, Huang Z, Long L, Huang W, Hu S, Hu F, Fu P, Gan J, Dong H, Yan G
Received 17 January 2022
Accepted for publication 26 March 2022
Published 7 April 2022 Volume 2022:15 Pages 437—452
DOI https://doi.org/10.2147/JAA.S357037
Checked for plagiarism Yes
Review by Single anonymous peer review
Peer reviewer comments 2
Editor who approved publication: Dr Amrita Dosanjh
Tao Wang,1,2,* Fa Long,1,* Zhihui Huang,1 Liang Long,1 Wenting Huang,1 Siyu Hu,1 Fengbo Hu,1 Peng Fu,1 Jingfan Gan,1 Hongbo Dong,1 Guomei Yan1
1University of Chinese Academy of Sciences Shenzhen Hospital, Shenzhen, People’s Republic of China; 2The First Affiliated Hospital of Jinan University, Guangzhou, People’s Republic of China
*These authors contributed equally to this work
Correspondence: Fa Long, University of Chinese Academy of Sciences Shenzhen Hospital, No. 4253, Songbai Road, Guangming District, Shenzhen, 518106, People’s Republic of China, Tel +86-755-27461986, Email [email protected]
Objective: To investigate the relation of activation site and number with clinical response to bronchial thermoplasty (BT) in refractory asthma patients.
Methods: This work included 106 consecutive refractory asthma patients completing three BT sessions in our hospital from May 2016 to May 2019. Procedure details included recording delivery sites and those in BT. Asthma Control Questionnaire (ACQ) scores and spirometric measurements were recorded 1-day before treatment and 6 months post-treatment to explore the effects of BT activation number and site on clinical response.
Results: ACQ score (3.19± 1.14 vs 1.26± 0.63), forced expiratory volume in 1 sec (FEV1)% predicted (55.53± 21.66 vs 66.19± 22.50), FEV1 (1.53± 0.74 vs 1.93± 0.82), and forced vital capacity (FVC) (2.49± 0.86 vs 2.92± 0.94) significantly increased after three BT sessions compared with pre-session. Major bronchial ablation did not significantly improve BT response in asthma patients. Multivariate logistic regression identified baseline ACQ score and baseline FEV1% predicted as independent factors affecting the clinical response to BT. Correlation and regression analysis revealed a significant linear relationship between baseline ACQ and ACQ improvement, as well as a linear relationship between the third session activation number and ACQ improvement. Based on subgroup analysis of activation number, cohort C (activations ≥ 200) had better lung function, lower non-responding rate, and better long-term effectiveness than the other two cohorts. The activation number in the third BT session showed the strongest predictive ability compared with the first two sessions.
Conclusion: Main bronchial ablation did not markedly affect clinical response to BT. Baseline ACQ and baseline FEV1% predicted were independent factors affecting clinical response to BT. Increasing the activation number might promote the therapeutic efficacy of BT, and the activation number in the third BT session correlated with and predicted the BT response.
Keywords: refractory asthma, bronchial thermoplasty, activation, response, correlation
Introduction
Bronchial asthma is a complex inflammatory disease that causes airway inflammation and hyperresponsiveness. The majority of asthma patients are well managed with standardized inhalation therapy and other treatments. However, only around 5% of asthma patients meet the requirements for a severe asthma diagnosis. Recent advances in treatment options for severe asthma patients have included the implementation of bronchial thermoplasty (BT), which is an endoscopic treatment targeting the airway smooth muscle (ASM) by heating the medium to larger sized airways with radio-frequency energy. It should be explored for poorly controlled refractory asthma patients with recurrent acute episodes even after treatment of inhaled hormones and long-acting beta2-agonists (LABAs), according to GINA guidelines.1 Clinical studies have confirmed the therapeutic efficacy and safety of BT sessions for refractory asthma patients;2 however, not all patients respond equally well to BT due to the remarkable heterogeneity in refractory asthma symptoms.3
Therefore, identification of the clinical and physiological characteristics associated with the BT response is of great importance to optimize patient selection and further elucidate the mechanism of action of this treatment. Langton et al4 reported that there was a negative correlation between the changes in ACQ following BT and the number of activations during the procedure and they recommended that the total activation number should ideally be greater than 140. However, in our clinical practice, we found that this strategy was not always effective for patients with refractory asthma. Previous research has found that the more activation in BT sessions, the more ASM is ablated, resulting in a better therapeutic response to BT.4–6 Previously, the activation sites of BT ablation are mainly located at subsegmental bronchi with the diameters of 3–10 mm, and no major airway such as lobar bronchus is involved.7–9 As a result, we have integrated the major bronchial ablations into the first and second BT sessions to enhance overall activations and further explore if combining with the main bronchial ablation is beneficial for a clinical response to BT. This study was conducted to investigate the effects of the activation number and the location of the BT on the clinical response in 106 patients with refractory asthma.
Materials and Methods
Participants and Setting
Patients with refractory asthma who were referred to our hospital (Shenzhen Hospital of the Chinese Academy of Sciences) for BT treatment between May 2016 and May 2019 were enrolled as study subjects. Inclusion criteria were established according to the definition of refractory asthma by the European Respiratory Society/American Thoracic Society (ERS/ATS)10 and included age >18 years, patients who met at least one of the following conditions: unable to control the symptoms of asthma effectively after medium or high doses of inhaled corticosteroids (ICS) and LABA or biological treatment like Omalizumab, patients with a mean ACQ-5 score of 3.3 ± 1.1 or used a median of eight salbutamol puffs per day for rescue reliever therapy [interquartile range (IQR) 4–15] and a median of two formations requiring prednisolone per patient (IQR 0–5) in the six months before treatment. Patients with allergies to relevant drugs in this study, acute respiratory infection prior to admission, communication disorders or mental diseases, those that were unable to complete three BT sessions for various reasons, other respiratory diseases such as emphysema, cystic fibrosis, bronchiectasis, mechanical upper airway obstruction, and so on, and patients who failed 6-month follow-up were excluded. This study was approved by the Ethics Committee of Scientific Research Review of Shenzhen Hospital, University of Chinese Academy of Sciences (Ethics No.: GKDSY-LL-XJS-202001), and the patients and their families provided informed consent.
Pre-BT Evaluation
At baseline, demographic information and anthropometric data such as age, gender, disease course, history of smoking, history of allergies, height, weight, and body mass index (BMI) were collected. Additional measurements included baseline lung functions (Spirometric measurements of FEV1, FVC, and FEV1%), bronchial dilation test, percentage of blood eosinophils, fractional exhaled nitric oxide (FeNO), and baseline ACQ score.
BT Procedure
Bronchial thermoplasty (BT) was performed using the Alair bronchial thermoforming system (AsthmatxInc Company, USA) and the BF260 bronchoscope (Olympus, Japan). Under direct vision, the probe was deployed in the airways one by one from the small airway ≥3mm to the leaf bronchial opening in order from far to near, continuously without repeating. The first BT procedure consisted of treatment of the right lower lobe bronchus and right main bronchus; the second session was delivered to the left lower lobe bronchus and left main bronchus, and the third BT session was delivered to bilateral upper lobes. All 3 BT sessions were carried out by the same experienced respiratory interventionist. The interval between procedures was ≥ 3 weeks. Prednisone, 30 mg OD was administered orally 3 days before BT, the day of the procedure, and 1 day after the procedure. “Groups” of patients were used to group patients according to the main bronchial ablation, and “cohorts” of patients were adopted for distinguishing patients in line with the number of radiofrequency activations.
Measurement Indicators
The number of activations in the 3 sessions and for the main bronchi was recorded. Spirometric measurements of FEV1, FEV1, and FVC % predicted were measured, with ACQ score and lung function assessed one day before the first session and repeated at 6 months after completion of the 3 sessions. The improvement in ACQ (post-BT ACQ score minus pre-BT ACQ score) was computed, and any drugs used to prevent or alleviate symptoms were also noted. An improvement of ≥0.5 points on the ACQ-5 score, which is the currently recognized minimum improvement, was used to define a clinical responder, and the patients have divided into responders and non-responders accordingly.11
Statistical Analysis
All data analyses were conducted using SPSS22.0 software (SPSS Inc., Chicago, IL, USA). Measurable data were expressed as mean ± standard deviation or median [interquartile range (IQR)]. To compare data with a normal distribution, independent samples- or paired sample-T tests were utilized, whereas non-parametric tests were used to analyze data with a skewed distribution. To compare the category data, Pearson’s Chi-square tests (with continuity correction when applicable) were utilized. Where the sample size was very small, the data was assumed to be non-parametric and a Mann–Whitney U-test was used. Logistic least absolute shrinkage and selection operator (LASSO) regression was thus applied before univariate analysis. LASSO regression is performed to shrink the sum of the absolute value of regression coefficients, forcing and producing coefficients that are exactly 0, then selecting for the nonzero variables to remain in the model. The factors affecting the clinical response to BT was analyzed using multivariate logistic regression analysis. The factors influencing ACQ improvement were then modeled and analyzed using multiple linear analysis. The potential associations between ACQ change and its influencing factors were assessed using Pearson’s correlation coefficient (R2). The clinical response of BT with activation frequencies was also predicted using receiver operating characteristic (ROC) analysis. A P-value <0.05 was considered statistically significant. A P-value <0.1 was referenced, otherwise no valid values (NS) were used.
Results
Patient Characteristics
A total of 106 patients with severe refractory asthma completed all the sessions and 6 months follow-up were enrolled and randomly divided into two groups according to the stratified randomized block strategy: the group not combined with main bronchial ablation (group A, n= 55) and the group combined with main bronchial ablation (group B, n=51). All patients had received high doses of ICS in the past year and were using LABAs and long-acting cholinergic receptor antagonists (LAMAs) but none had been treated with omalizumab or endotracheal intubation and mechanical ventilation in the past. Before BT sessions, there was no statistically significant difference in age, disease course, smoking status, allergies, percentage of blood eosinophils, FeNO, height, weight, BMI, lung function, ACQ score, or clinical response between groups A and B. (Table 1).
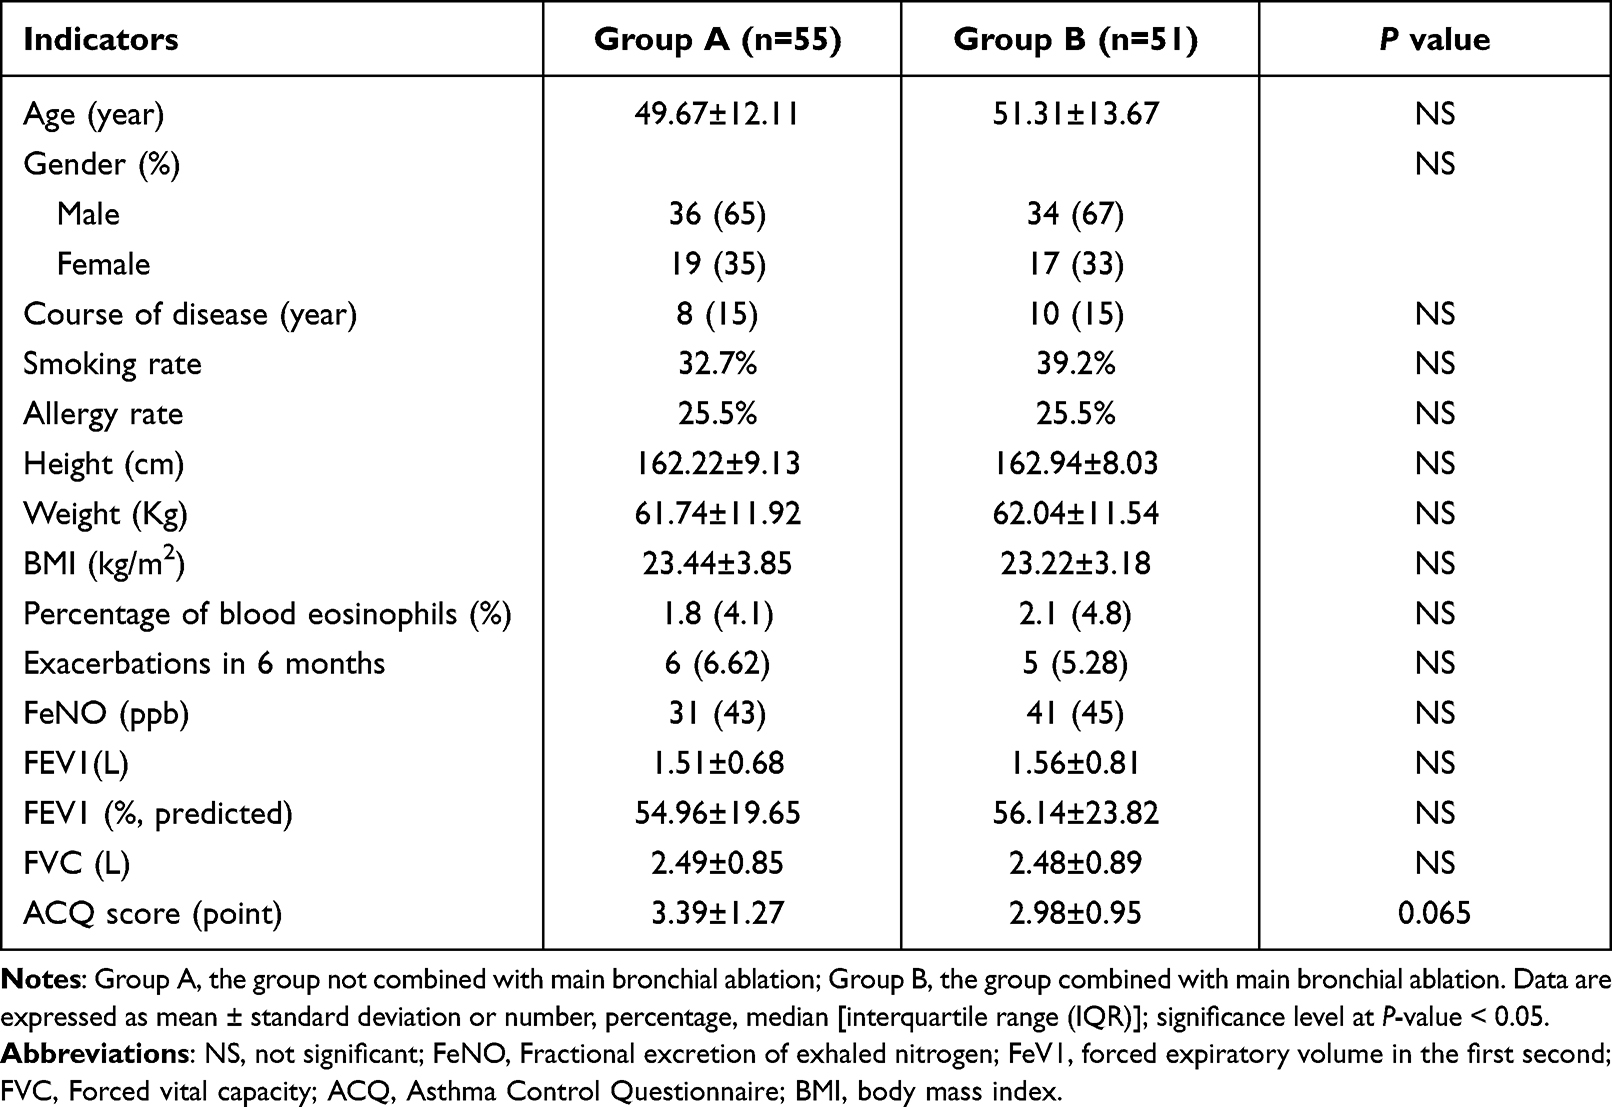 |
Table 1 Comparison of Baseline Patient Characteristics |
Therapeutic Effects of and Clinical Response to BT
In total, patients in both groups received 318 BT sessions. Compared to pre-BT, the FEV1 (1.54 ± 0.75 vs 1.93 ± 0.82), FEV1% predicted (55.53 ± 21.66 vs 66.19 ± 22.51), FVC (2.49 ± 0.87 vs 2.92 ± 0.94), ACQ (3.19 ± 1.14 vs 1.26 ± 0.63), and exacerbations in the last six months (5.74 ± 2.47 vs 0.29 ± 0.69) were significantly improved six months after BT (all P < 0.001). With a clinically significant improvement in ACQ of ≥0.5,11 89 of the 106 patients were designated as “responders” (Group A: 48 patients, 72.75±15.59 activations; Group B: 41 patients, 68.82 ± 15.41 activations). The 17 patients with an ACQ improvement <0.5 (Group A: 7 patients, 56.0 ± 13.90 activations; Group B: 10 patients, 55.17 ± 12.96 activation) were designated as the ‘non-responders’. The BT-response rates in groups A and B were 87.3% and 80.4%, respectively, with no significant difference between groups.
Patients were classified into responders and non-responders based on their clinical response to BT sessions. The responders were significantly younger (48.43 ± 12.19 vs 61.12 ± 11.045), had a lower smoking rate (31.4% vs 58.8%), more activations (total activations and the third activations), better lung function with a higher FEV1 (1.67 ± 0.72 vs 0.84 ± 0.39), higher FEV1 (%, predicted) (59.22 ± 20.89 vs 36.17 ± 14.29) and FVC (2.64 ± 0.83 vs 1.70 ± 0.57), as well as an improved ACQ score (3.30 ± 1.15 vs 2.60 ± 0.85) (all P< 0.05). The combination of main bronchial ablation, on the other hand, had no obvious effect on the clinical response to BT (Table 2). Because the second BT session was done in the left main bronchus, the activation number in responding and non-responding patients when coupled with main bronchial ablation was significantly higher than when not combined with main bronchial ablation (P < 0.05). However, the activation number of the responders with or without the combination with main bronchial ablation was significantly greater (P < 0.05) than that in the non-responders with or without the combination of main bronchial ablation (Figure 1).
 |
Table 2 Comparison of Indicators Between Responders and Non-Responders |
 |
Figure 1 Total activation numbers in BT responders and non-responders in main bronchial ablation and non-main bronchial ablation groups. Abbreviation: BT, bronchial thermoplasty. Notes: The box-plot displaying the total radiofrequency activation numbers of three BT sessions in responders and non-responders of each group. The mean values are presented in small squares inside the box bodies. Group A, the group combined with main bronchial ablation; Group B, the group combined with main bronchial ablation. Blue color represents responders to BT, while the red color represents non-responders. *P < 0.05 compared with the mean value of non-responders. |
Analysis of the Factors Affecting the Clinical Response to BT
LASSO Regression
LASSO regression was used to determine the factors influencing the clinical response to BT. The dependent variable was the clinical response to BT, and the independent variables were the baseline ACQ score, baseline FEV1 (%, predicted), baseline FEV1, baseline FVC, activation number, whether combined with left and right main bronchial ablation, gender, age, height, weight, BMI, disease course, smoking history, acute exacerbations in the last six months, use of hormones, percentage of blood eosinophils, and FeNO. According to Table 3, ACQ, FEV1 (%, predicted), FVC, and activation number in the third BT session had a significant and positive effect on clinical response to BT, while age and post-BT prednisone had a significant and negative effect on the clinical response to BT. However, others parameters, including activation site, showed no significant predicting effect on clinical response to BT, indicating the age, ACQ, FEV1 (%, predicted), FVC, and activation number were the main influencing factors for clinical response to BT.
 |
Table 3 The Estimated Coefficients of Lasso Regression |
Univariate Analysis
The dependent variable in the univariate analysis was a clinical response to BT, while the independent factors were baseline ACQ score, baseline FEV1 (% predicted), baseline FEV1, baseline FVC, activation number, and combination with left and right main bronchial ablation. Although LASSO analysis revealed that combined left and right main bronchial ablation did not significantly predict BT response, it was included in the logistic regression due to its clinical importance. The univariate analysis revealed that the coefficients (β) were all positive and the odds ratios (OR) were > 1 for baseline ACQ score, baseline FEV1 (%, predicted), baseline FEV1, baseline FVC, activations for the third BT session, and the total activations, suggesting that they were protective factors for the BT response (Table 4).
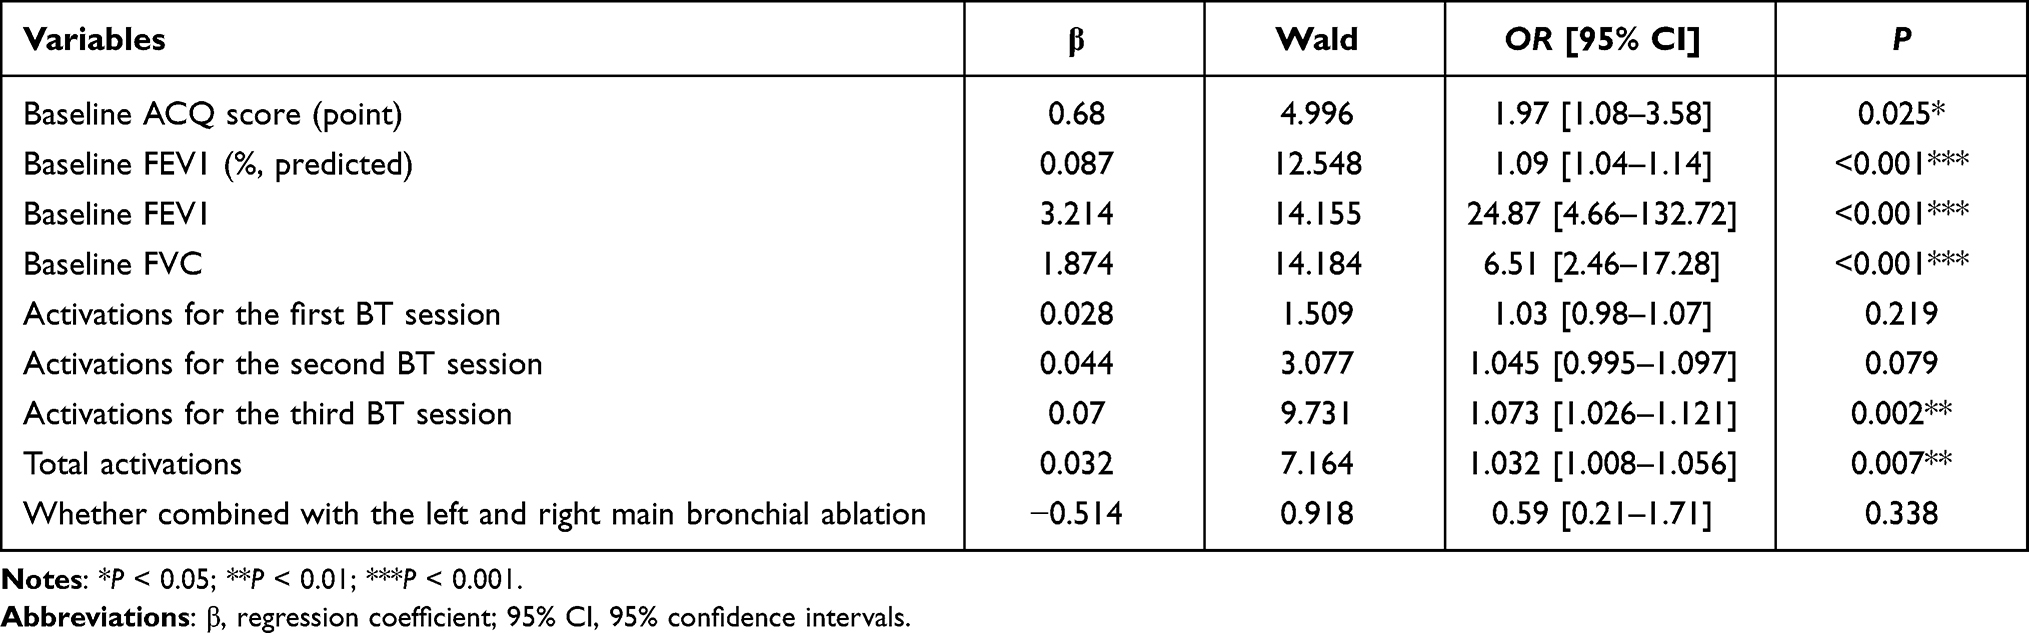 |
Table 4 Univariate Analysis for Clinical Response to BT |
Multivariate Analysis
The tolerance and variance inflation factor (VIF) were analyzed to diagnose multicollinearity within the prognostic factors. For baseline FEV1 and activation number, the tolerances were < 0.1 and VIF was 10.9, indicating collinearity. We eliminated the baseline FEV1 and activation number from the model to eliminate the impact of multicollinearity among the components, and the variables with P < 0.05 in the univariate analysis were included in the multivariate logistic regression analysis. The baseline ACQ score and baseline FEV1 (%, predicted) were both independent factors influencing the BT response as shown in Table 5.
 |
Table 5 Logistic Regression for the Influencing Factors of Clinical Response to BT |
The BT response depends on ACQ improvement before and after BT sessions, thus, linear regression was performed with ACQ improvement before and six months after BT sessions (Y) as the dependent variable and the independent variables included gender (X1), age (X2), course of disease (X3), smoking history (X4), the combination with the ablations of left and right main bronchus (X5), height (X6), weight (X7), BMI (X8), percentage of blood eosinophils (X9), FeNO (X10), baseline ACQ score (X11), baseline FEV1 (%, predicted) (X12), baseline FEV1 (X13) and baseline FVC (X14). The estimated coefficients of baseline ACQ and baseline FEV1 (%, predicted) were −1.005 (P < 0.001) and −0.013 (P < 0.001), respectively (Table 6), indicating that the baseline ACQ score and baseline FEV1 (%, predicted) were both independent factors influencing the ACQ improvement.
 |
Table 6 Parameter Estimation and Hypothesis Testing for the Influencing Factors of ACQ Improvement Before and 6 Months After BT Sessions |
Further correlation and regression analyses were conducted to explore the influence of the above factors on ACQ improvement, showing that there was a strong linear relationship between baseline ACQ and ACQ improvement (r = 0.861 for Pearson correlation analysis, P = 0.000). The equation was as follows: ACQ delta = −0.935x + 1.058 (R2 = 0.741, P < 0.05, Figure 2). There was also a linear relationship between activation frequency in the third BT session and ACQ improvement (r = −0.239 for Pearson correlation analysis, P = 0.013), and the equation was as follows: ACQ delta = −0.019x - 0.605 (R2 = 0.057, P < 0.05, Figure 3).
 |
Figure 2 Correlation between baseline ACQ and ACQ improvement. Abbreviation: ACQ, Asthma Control Questionnaire scores. Notes: Linear regression analysis was performed to evaluate the relationship between the baseline ACQ and ACQ improvement from baseline. A greater baseline ACQ value resulted in a greater negative delta ACQ value (namely, the greater improvement in ACQ) (R2 = 0.741, P <0.05). Delta ACQ: post-BT ACQ score minus pre-BT ACQ score. |
 |
Figure 3 Correlation between activation number in the third BT session and ACQ improvement. Abbreviation: RF, radiofrequency activation. Notes: Linear regression analysis was performed to evaluate the relationship between the RF_activation in the third BT session and ACQ improvement from baseline. A greater number of activation number in the third BT session indicated the greater negative delta ACQ value (namely, the greater improvement in ACQ) (R2 = 0.741, P <0.05). |
Influence of the Activation Number in BT Sessions on the Therapeutic Effect
To further analyze the effect of activation number on BT therapeutic effect, patients were divided into 3 cohorts according to the BT activation number, including Cohort A (RF_activations < 170), Cohort B (170 ≤ RF_activations < 200 activations) and Cohort C (RF_activations ≥ 200 activations). Analysis of the total number of activation in the three cohorts showed that 29 cases received <170 activations (cohort A), 42 cases who received ≥170 to <200 activations (cohort B), and 35 cases who received ≥ 200 activations (cohort C). Furthermore, when the parameters of the three cohorts were compared, we found that patients in cohort C were younger, taller, had higher FeNO, and had better baseline lung function, but the non-response rate was significantly lower than the other two patient cohorts, and the difference was statistically significant (ANOVA, all P<0.05, Table 7). After 6 months of follow-up, cohort C with ≥200 activations had a lower ACQ score and better lung function than those in cohort A with <170 activations (Table 3, Figures 4–7, aP< 0.05).
 |
Table 7 Comparison Among the Cohorts with Different Activation Numbers |
 |
Figure 4 Post-BT ACQ score in each cohort with different activation numbers. Notes: The box-plot showing the distribution of ACQ scores at 6 months after BT procedure in three cohorts. The mean values are presented in small squares inside the box bodies. Cohort A, patients who received <170 activations; Cohort B, patients who received ≥170 to <200 activations; and Cohort C, patients who received ≥ 200 activations.*P < 0.05 compared with the mean value of Cohort A. |
 |
Figure 5 Post-BT FVE1 (%, predicted) in each cohort with different activation numbers. Abbreviations: FVE1 (%, predicted), forced expiratory volume in 1 sec (FEV1)% predicted. Notes: The box-plot showing the distribution of FVE1 (%, predicted) at 6 months after BT procedure in three cohorts. *P < 0.05 compared with the Cohort A. |
 |
Figure 6 Post-BT FEV1 in each cohort with different activation numbers. Notes: The box-plot showing the distribution of FEV1 at 6 months after BT procedure in three cohorts. *P < 0.05 compared with the mean value of Cohort A. |
 |
Figure 7 Post-BT FVC in each cohort with different activation numbers. Notes: The box-plot showing the distribution of FVC at 6 months after BT procedure in three cohorts. *P < 0.05 compared with the mean value of Cohort A. |
ROC Analysis to Predict the Clinical Response to BT with Activation Frequencies
ROC analysis showed that the activation frequencies had different predictive values for the clinical response to BT (Figure 8). The area under the curve (AUC) was 0.584 (95% CI: 0.484–0.679) when predicting the clinical response to BT with the activation number in the first BT session. When the cut-off value was 52 and the Jordan index was 22.67%, the diagnostic efficiency was the highest. The sensitivity and specificity were 69.66% and 52.94%, respectively. The positive predictive value (PPV) was 88.6% (95% CI 82.1–92.9%) and the negative predictive value (NPV) was 25% (95% CI 16.2–36.6%), with a P-value of 0.270.
 |
Figure 8 ROC curves in predicting the clinical response to BT with different activation numbers. Abbreviation: ROC, receiver operating characteristic. Notes: RF_activation in the 1st BT, the activation number in the first BT session; RF_activation in the 2nd BT, the activation number in the second BT session; RF_activation in the 3rd BT, the activation number in the third BT session; Total activations, the total activation number of the three BT sessions. |
When predicting the clinical response to BT with the activation number in the second BT session, the AUC was 0.643 (95% CI 0.545–0.734). When the cut-off value was 60, the diagnostic efficiency was the highest, with a Jordan index of 32.91%. The sensitivity and specificity were 50.56% and 82.35%, respectively, the PPV was 93.7% (95% CI 84.0–97.7%) and NPV was 24.1% (95% CI 19–30.1%), with a P-value of 0.054.
The AUC was 0.75 (95% CI 0.656–0.829) when predicting clinical response to BT with the activation number in the third BT session. The diagnostic efficiency was the highest when the cut-off value was 64 with the Jordan index of 41.64%. The sensitivity and specificity were 65.17% and 76.47%, respectively, the PPV was 93.5% (95% CI 85.9–97.2%) and NPV was 29.5% (95% CI 22.2–38.2%), with a P-value of <0.001.
When predicting the clinical response to BT using total activations, the AUC was 0.728 (95% CI 0.633–0.81). When the cut-off value was 181 and the Jordan index was 42.7%, the diagnostic efficiency was the highest. The sensitivity and specificity were 66.29% and 76.47%, respectively, the PPV was 93.7% (95% CI 86.1–97.2%) and NPV was 30.2% (95% CI 22.6–39.1%), with a P-value of 0.0012.
Discussion
Asthma is a heterogeneous disease characterized by chronic airway inflammation. Approximately 3–5% of adult patients with refractory asthma are insensitive to conventional inhalation therapy,12–16 and certain patients are ineligible for anti-interleukin (IL)-5 monoclonal antibody (mAb) and anti-immunoglobulin (Ig)E mAb, thus BT becomes their treatment of choice.1,17 Recent studies have shown that BT ablation of the middle lobe bronchi is also safe and feasible;18 however, to avoid the risk of middle lobe syndrome, the right middle lobe was not treated in this study. Although the ASM is hyperplastic in the initial stages of asthma,19,20 our proceduralist found that at least three catheter electrodes of the four electrode arms adhering to the bronchial airway wall would produce effective activation. To increase the activation number and the activated area, ablation treatment was performed for the left and right main bronchi in the first and second BT sessions to improve the clinical response and lung function in asthma patients.
After combining with the main bronchial ablation, the activation number of the BT was significantly increased in both the responders and non-responders, but the response rate to BT was not improved, indicating that the main bronchial ablation did not affect the therapeutic efficacy of BT. As a result, main bronchial ablation provides no additional benefit to BT-treated asthma patients. Bronchial asthma is defined by small airway lesions, and BT improves asthma by ablating the ASM in the small airways but not the major bronchi. Although the major bronchial ablation increased total BT activations, it had no significant effect on the effect of BT in other airways since the activation number of BT in other airways remained the same. As shown in Figure 1, the activation number of the responders was greater than the non-responders regardless of the combination with the main bronchial ablation, suggesting that the two groups may have different characteristics that result in different responses to BT. Therefore, we compared demographic and basement characteristics between groups, revealing that responders were younger, less likely to smoke, had better lung function, and had higher values of FeNO, basement ACQ, and activation number. Specifically, in the third BT session on the upper lobes, the activation number was significantly greater in the responding group than in the non-responders, suggesting that the activation number, especially that in the third BT session, may affect the therapeutic efficacy of BT.
Langton et al4 confirmed that the activation number was a key determinant for the clinical response to BT, which was consistent with the results of our study after the LASSO regression and univariate analysis. However, further logistic regression showed that only baseline values of ACQ score and FEV1 (%, predicted) were independent factors affecting the clinical response to BT sessions. Because of its collinearity with other factors, the activation number was removed from logistic regression.
Similar to the research conducted by Shota Yamamoto et al,21 this study also revealed that baseline lung function [baseline FEV1 and baseline FEV1% predicted] might exert certain influence on BT activation number. Moreover, correlation and regression studies showed that total BT activations were not associated with clinical response to BT, except for a weak correlation ACQ improvement in the third BT session. As a result, the activation number might not be the major determinant of the clinical response to BT.
In contrast to the previous results of Langton et al,4 we found that the total activations were not correlated with the clinical response to BT or ACQ improvement. In this research, the activation number was raised as much as possible to achieve the optimum therapeutic effect. Approximately 99% of our patients received more than 140 activations in BT sessions, and 72% received more than 170 activations in total, with the average activation number in the responding and non-responders reaching 194.92 ± 30.73 and 172.09 ± 26.82, respectively. However, the study of Langton et al involved fewer patients (24) and activations (130±11.4) possibly contributing to the inconsistent results. Accordingly, the higher activation number in our study might weaken the influence of total activation number on clinical response to BT. The 106 patients were divided into three cohorts according to their activation number to further understand their influence on the clinical response to BT. As shown in Table 3, Cohort C was significantly younger and taller and had a higher value of FeNO, better baseline lung function, and lower non-responding rate than the other two groups. Initially, we focused on age distribution of patients. The three cohorts of patients were all aged over 40 years. It is suggested that adult patients diagnosed with asthma at the age of over 40 years old mostly experience non-allergic asthma.22 Besides, the asthma-related symptoms can hardly be relieved, and refractory asthma may easily occur.23 Moreover, metabolic changes with age also result in the difference in therapeutic response to asthma drugs as well as increased application of oral steroids and monoclonal antibodies.24 Consequently, refractory asthma in older patients has poor responsiveness to conventional drug therapy,25 while BT has become an effective measure. Additionally, some research indicates that, the increase in age may contribute to the decreased relative abundance of asthma airway smooth muscle or the occurrence of pathological changes such as airway remodeling,26 thereby reducing the response to BT treatment. Based on the above-mentioned research results, the clinical features and treatments of patients with refractory asthma may be different due to the changes in metabolic features, airway pathology and pathogenesis.25 Meanwhile, an older age may result in the poorer response to BT treatment.
Our results suggest that the ACQ score, FEV1, FEV1 (%, predicted), and FVC in all three cohorts improved at six months after BT sessions. Notably, these values in younger Cohort C were much greater than in Cohort A. The possible reasons may be that patients in cohort C were younger with a shorter course of disease, and so the better baseline lung function. In addition, it can be speculated that the shorter course of disease may be related to the milder airway remodeling and the higher airway smooth muscle abundance. Therefore, patients in Cohort C may have better response to BT treatment.
Furthermore, in the third BT session, the activation number exhibited a weak correlation with the corresponding ACQ improvement, and the activated area was the largest of the three BT sessions. Therefore, it is hypothesized that the greater the activation number, the more ablated the ASM,4,16 providing more relief of asthma symptoms. Based on the above analysis, it is possible that the therapeutic effect of BT can only be significantly improved after the activation number reaches a certain high level accompanied by a certain amount of ASM ablation. Therefore, the total number of activations did not correlate with the clinical response to BT, it partially affected BT therapeutic effect. In this regard, it is recommended that patients should complete three BT sessions if the surgical complications are tolerable, and maximally increase the activation number as much as possible to get the most out of their BT treatment.
Given that the clinical response to BT is mostly determined by ACQ improvement, a multiple linear regression analysis was conducted to investigate its impact. In line with the logistic regression results, the multiple linear regression also confirmed that baseline values of ACQ and FEV1 (%, predicted) were the main factors affecting ACQ improvement. Further correlation and linear regression analysis revealed a strong linear relationship between baseline ACQ and ACQ improvement, indicating that the higher the baseline ACQ score, the greater the ACQ improvement six months following BT sessions. Recent study has shown that BT sessions were equally effective for patients with FEV1 (%, predicted) < 50%, and the incidence of post-BT adverse events was not increased.27 In this study, the clinical response to BT could be strengthened by the improvement in FEV1 (%, predicted). Besides, the higher the pre-BT ACQ score and the more pre-BT symptoms of asthma, the better the post-BT response. The use of hormones, on the other hand, had no influence on the therapeutic benefits of BT. As a result, baseline lung functions should be improved to the maximum extent possible in order to optimize therapy effectiveness.
The ROC curves revealed that the AUC and Jordan index when predicting the clinical response to BT with the activations in the third BT session were comparatively close to those for the total activations but significantly higher than for the first and second BT session. The activations of the third BT session, as well as the overall number of activations, exhibited some predictive effects for the clinical response to BT. The cut-off value for the threshold of activations in the third BT session and the total activations was 64 and 181, respectively, suggesting that the activations in the third BT treatment and total should be more than 64 and 181, respectively, for an improved clinical response to BT. Regarding the weak correlation with ACQ improvement, the activations in the third BT session should be increased as much as possible to further improve the therapeutic efficacy of BT.
Langton et al28 identified baseline factors that predicted clinical response to BT and found that severe asthma patients with higher baseline ACQ score, more acute attacks, and more frequent use of short-acting β2-receptor agonist (SABA) had more significant post-BT improvement and a stronger clinical response to BT, which was consistent with the current study. In addition, our results also showed that other baseline factors such as gender, age, obesity, percentage of blood eosinophils, and smoking history did not affect the clinical response to BT. Based on these results, we could infer that BT is also effective for elderly patients with a smoking history and obesity, and can be more widely applied in asthma patients, especially those with refractory asthma. However, for the deficiencies of single-center and lack of control group, it is necessary to carry out a multi-center randomized controlled experiment in the follow-up study to further verification in a larger perspective sample size.
In conclusion, the activation number of BT, especially in the third BT session, was relative to and predictive of the clinical response to BT. A higher ACQ score and better lung function before the BT procedure were significantly associated with an improved clinical response to BT. Therefore, it is advised to improve patients’ baseline lung function before three consecutive BT sessions and to boost activations overall and in the third BT session without main bronchial ablation.
Conclusion
Main bronchial ablation had no significant effect on the clinical response to BT. The baseline ACQ score and FEV1 (%, predicted) are independent factors influencing the clinical response to BT. Increasing the number of activations in BT sessions might significantly improve BT’s therapeutic efficacy, with the activation number in the third BT session being associated with and predictive of clinical response to BT.
Abbreviations
ACQ, Asthma Control Questionnaire; AIR, Asthma Intervention Research; BMI, Body Mass Index; BT, Bronchial thermoplasty; FeNO, Fractional excretion of exhaled nitrogen; FeV1, Forced expiratory volume in the first second; FVC, Forced Vital Capacity; FeV1/FVC, Ratio of FeV1/FVC.
Ethics Approval and Consent to Participate
The study was performed in compliance with the guidelines for human studies and conducted ethically in accordance with the World Medical Association Declaration of Helsinki. Participants provided written informed consent, and the study was authorized by the Scientific Research Review Ethics Committee of the Chinese Academy of Sciences’ Shenzhen Hospital (approval number: LL-KT-2020140).
Acknowledgments
FL had full access to all of the data in the study and takes responsibility for the integrity of the data and the accuracy of the data analysis, including and especially any adverse effects. TW, PAK, ZH, LL, WH, SH, FH, PF, JG, HD, and GY contributed substantially to the study design, data analysis and interpretation, and the writing of the manuscript.
Funding
This study was funded by the Special Fund for the economic development of GuangMing District (2020R01002).
Disclosure
The authors report no conflicts of interest in this work.
References
1. GINA. Global strategy for asthma management and prevention: updated April 2019; 2019. Available from: www.ginasthma.org/.
2. Goorsenberg AWM, d’Hooghe JNS, Srikanthan K, et al. TASMA research group. Bronchial thermoplasty induced airway smooth muscle reduction and clinical response in severe asthma. The TASMA randomized trial. Am J Respir Crit Care Med. 2021;203(2):175–184. doi:10.1164/rccm.201911-2298OC
3. Wechsler ME, Laviolette M, Rubin AS, et al. Bronchial thermoplasty: long-term safety and effectiveness in patients with severe persistent asthma. J Allergy Clin Immunol. 2013;132:1295–1302. doi:10.1016/j.jaci.2013.08.009
4. Langton D, Sha J, Ing A, et al. Bronchial thermoplasty: activations predict response. Respir Res. 2017;18(1):134. doi:10.1186/s12931-017-0617-7
5. Pretolani M, Dombret MC, Thabut G, et al. Reduction of airway smooth muscle mass by bronchial thermoplasty in patients with severe asthma. Am J Respir Crit Care Med. 2014;190(12):1452–1454. doi:10.1164/rccm.201407-1374LE
6. Chakir J, Haj-Salem I, Gras D, et al. Effects of bronchial thermoplasty on airway smooth muscle and collagen deposition in asthma. Ann Am Thorac Soc. 2015;12(11):1612–1618. doi:10.1513/AnnalsATS.201504-208OC
7. Mayse ML, Laviolette M, Rubin AS, et al. Clinical pearls for bronchial thermoplasty. J Bronchol. 2007;14(2):115–123. doi:10.1097/LBR.0b013e318054dbed
8. Facciolongo N, Menzella F, Lusuardi M, et al. Recurrent lung atelectasis from fibrin plugs as a very early complication of bronchial thermoplasty: a case report. Multidiscip Respir Med. 2015;10(1):9. doi:10.1186/s40248-015-0002-7
9. Trivedi A, Pavord ID, Castro M. Bronchial thermoplasty and biological therapy as targeted treatments for severe uncontrolled asthma. Lancet Respir Med. 2016;4(7):585–592. doi:10.1016/S2213-2600(16)30018-2
10. Chung KF, Wenzel SE, Brozek JL, et al. International ERS/ATS guidelines on definition, evaluation and treatment of severe asthma. Eur Respir J. 2014;43(2):343–373. doi:10.1183/09031936.00202013
11. Juniper EF, Svensson K, Mörk AC, Ståhl E. Measurement properties and interpretation of three shortened versions of the asthma control questionnaire. Respir Med. 2005;99(5):553–558. doi:10.1016/j.rmed.2004.10.008
12. Burn J, Sims AJ, Patrick H, et al. Efficacy and safety of bronchial thermoplasty in clinical practice: a prospective, longitudinal, cohort study using evidence from the UK severe asthma registry. BMJ Open. 2019;9(6):26742–26743. doi:10.1136/bmjopen-2018-026742
13. Seeley EJ, Alshelli I, Canfield J, et al. The impact of bronchial thermoplasty on asthma-related quality of life and controller medication use. Respiration. 2019;98(2):165–170. doi:10.1159/000499404
14. Yamamura K, Hara J, Ohkura N, et al. Increased cough receptor sensitivity to capsaicin predicts a positive bronchial thermoplasty response: a single-center retrospective study. J Bronchol Interv Pulmonol. 2019;26(2):137–141. doi:10.1097/LBR.0000000000000577
15. Blaiss MS, Castro M, Chipps BE, et al. Guiding principles for use of newer biologics and bronchial thermoplasty for patients with severe asthma. Ann Allergy Asthma Immunol. 2017;119(6):533–540. doi:10.1016/j.anai.2017.09.058
16. Thomson NC. Recent developments in bronchial thermoplasty for severe asthma. J Asthma Allergy. 2019;12:375–387. doi:10.2147/JAA.S200912.14
17. Thomson NC. Bronchial thermoplasty as a treatment for severe asthma: controversies, progress and uncertainties. Expert Rev Respir Med. 2018;12(4):269–282. doi:10.1080/17476348.2018.1444991
18. Eisenmann S, Schütte W, Funke F, et al. Bronchial thermoplasty including the middle lobe bronchus significantly improves lung function and quality of life in patients suffering from severe asthma. Lung. 2019;197(4):493–499. doi:10.1007/s00408-019-00240-5
19. Berair R, Saunders R, Brightling CE. Origins of increased airway smooth muscle mass in asthma. BMC Med. 2013;11:145. doi:10.1186/1741-7015-11-145
20. James AL, Noble PB, Drew SA, et al. Airway smooth muscle proliferation and inflammation in asthma. J Appl Physiol. 2018;125(4):1090–1096. doi:10.1152/japplphysiol.00342.2018
21. Yamamoto S, Iikura M, Kakuwa T, et al. Can the number of radiofrequency activations predict serious adverse events after bronchial thermoplasty? A retrospective case-control study. Pulm Ther. 2019;5(2):221–233. doi:10.1007/s41030-019-00103-7
22. Pakkasela J, Ilmarinen P, Honkamäki J, et al. Age-specific incidence of allergic and non-allergic asthma. BMC Pulm Med. 2020;20(1):9. doi:10.1186/s12890-019-1040-2
23. Honkamäki J, Piirilä P, Hisinger-Mölkänen H, et al. Asthma remission by age at diagnosis and gender in a population-based study. J Allergy Clin Immunol Pract. 2021;9(5):1950–1959.e4. doi:10.1016/j.jaip.2020.12.015
24. Kelly RS, Sordillo JE, Lutz SM, et al. Pharmacometabolomics of bronchodilator response in asthma and the role of age-metabolite interactions. Metabolites. 2019;9(9):179. doi:10.3390/metabo9090179
25. Milger K, Korn S, Buhl R, et al. Age- and sex-dependent differences in patients with severe asthma included in the German asthma net cohort. Respir Med. 2020;162:105858. doi:10.1016/j.rmed.2019.105858
26. Bullone M, Pouyet M, Lavoie JP. Age associated changes in peripheral airway smooth muscle mass of healthy horses. Vet J. 2017;226:62–64. doi:10.1016/j.tvjl.2017.07.007
27. Langton D, Ing A, Fielding D, et al. Safety and effectiveness of bronchial thermoplasty when FEV1 less than 50%. Chest. 2019;157(19):33753–5.22. doi:10.1016/j.chest.2019.08.2193
28. Langton D, Wang W, Sha J, et al. Predicting the response to bronchial thermoplasty. J Allergy Clin Immunol Pract. 2020;8(4):1253–1260.e2. doi:10.1016/j.jaip.2019.10.034
 © 2022 The Author(s). This work is published and licensed by Dove Medical Press Limited. The
full terms of this license are available at https://www.dovepress.com/terms
and incorporate the Creative Commons Attribution
- Non Commercial (unported, 3.0) License.
By accessing the work you hereby accept the Terms. Non-commercial uses of the work are permitted
without any further permission from Dove Medical Press Limited, provided the work is properly
attributed. For permission for commercial use of this work, please see paragraphs 4.2 and 5 of our Terms.
© 2022 The Author(s). This work is published and licensed by Dove Medical Press Limited. The
full terms of this license are available at https://www.dovepress.com/terms
and incorporate the Creative Commons Attribution
- Non Commercial (unported, 3.0) License.
By accessing the work you hereby accept the Terms. Non-commercial uses of the work are permitted
without any further permission from Dove Medical Press Limited, provided the work is properly
attributed. For permission for commercial use of this work, please see paragraphs 4.2 and 5 of our Terms.