Back to Journals » Risk Management and Healthcare Policy » Volume 14
Correlation Between the Triglyceride–Glucose Index and High Risk of Cardiovascular Disease: A Cohort Study of 102,061 Subjects from Tianjin, China
Authors Zhang Y, Ren L, Ren M, Yang H, Li K, Cong H, Guo Z
Received 20 April 2021
Accepted for publication 14 June 2021
Published 2 July 2021 Volume 2021:14 Pages 2803—2810
DOI https://doi.org/10.2147/RMHP.S316484
Checked for plagiarism Yes
Review by Single anonymous peer review
Peer reviewer comments 3
Editor who approved publication: Professor Steven Coughlin
Yingyi Zhang,1 Libin Ren,1 Min Ren,2 Hua Yang,1 Kunmeng Li,1 Hongliang Cong,1 Zhigang Guo3
1Department of Cardiology, Tianjin Chest Hospital, Tianjin, 300222, People’s Republic of China; 2Tianjin Cardiovascular Institute, Tianjin, 300222, People’s Republic of China; 3Department of Cardiac Surgery, Tianjin Chest Hospital, Tianjin, 300222, People’s Republic of China
Correspondence: Hongliang Cong
Department of Cardiology, Tianjin Chest Hospital, No. 261 of Taierzhuang South Road, Jinnan District, Tianjin, 300222, People’s Republic of China
Tel +86 13702102871
Email [email protected]
Zhigang Guo
Department of Cardiac Surgery, Tianjin Chest Hospital, No. 261 of Taierzhuang South Road, Jinnan District, Tianjin, 300222, People’s Republic of China
Tel +86 13821002900
Email [email protected]
Objective: This study aims to investigate the correlation between triglyceride–glucose index (TyG) and the risk of cardiovascular disease (CVD).
Methods: A total of 102,061 permanent residents of Tianjin, China, aged 35– 75 years were surveyed. A questionnaire, physical examination, and blood tests for biochemical markers were conducted for all subjects. The risk of CVD was judged based on the results, identifying the population with a high risk of CVD. TyG was calculated for all subjects who were then grouped into TyG quartiles. The correlation between TyG and the detection rate of subjects with a high risk of CVD was analyzed using the chi-square test and Pearson’s correlation analysis. The cut-off points and the magnitude of the predictive effect of TyG in determining a high risk of CVD were identified by calculating the TyG through analysis of the receiver operator characteristic (ROC) curve.
Results: The surveyed population consisted of 39,598 males (38.8%) and 62,463 females (61.2%). The average age was 55.84 ± 10.27 years. A statistically significant difference in the incidence of a high CVD risk between subjects in the four groups divided by the TyG levels was identified (p < 0.01). Pearson’s correlation analysis showed that TyG was correlated with all risk factors for CVD (p < 0.01). The maximum Youden’s J statistic for determining the high risk of CVD was found at a TyG of 9.04 (specificity 0.575, sensitivity 0.754). The area under the ROC curve was 0.780 (confidence interval [CI]: 0.777, 0.783, p < 0.01).
Conclusion: TyG index is closely related to the aggregation of cardiovascular risk factors and is correlated with the judgment results of the screening population’s high risk of CVD, suggesting that more attention should be paid to the identification and control of multiple risk factors in the population with significantly elevated TyG.
Keywords: triglyceride–glucose index, cardiovascular disease, risk, insulin resistance
Introduction
Cardiovascular disease (CVD) has become the primary cause of death in China,1 and the prevention and treatment is a top priority of chronic disease management. To achieve early prevention, screening to identify the population at high risk of CVD and identification and targeted intervention management of high-risk populations has been carried out in China. Using traditional risk factors to identify high-risk populations, studies in various countries have introduced several scoring prediction models.2 In recent years, foreign researchers have proposed that the triglyceride–glucose index (TyG), a synthetic index of fasting blood glucose (FBG) and triglycerides (TGs), is a valuable indicator of insulin resistance (IR).3 IR is considered to be important in the pathophysiological basis of diabetes mellitus (DM) development and many CVDs,4 and plays a vital role in the development of CVD.
TyG has been shown in cross-sectional studies on CVDs as positively correlated with higher symptomatic coronary artery disease (CAD) prevalence, metabolic, and behavioral risk factors and can be used as a marker of atherosclerosis.5 It has been said that correlation does not imply causation, so using the TyG index as an indicator of CAD patients is questionable.6 In a recent study that looked at the incidence of cardiovascular events with a median longitudinal follow-up of 8.2 years, patients in the highest TyG index quartile had a higher risk of stroke and myocardial infarction (MI) compared with those in the lowest TyG index quartile. These effects were independent of age, sex, smoking, alcohol consumption, physical activity, body mass index (BMI), systolic blood pressure, and total cholesterol (TC).7 There are still few relevant studies on the application value of the TyG index in CVD risks and event rates, and the number of observed subjects studied by Da Silva et al are small.5 At the same time, abnormal blood glucose and lipid metabolism are risk factors for coronary heart disease, so evaluating the TyG product index in patients with coronary heart disease may cause bias.
The relationship refers to the association between TyG and the aggregation of cardiovascular risk factors and between TyG and the judgment of the high-risk population of CVD. Predicting cardiovascular risk with the most stable, comprehensive, and low-cost index possible is of great benefit. In this study, screening data from the community were used to explore the correlation between the TyG and CVD risk in Chinese adults to provide a basis for the effective prevention of CVD.
Study Subjects and Methods
Data in this study were obtained from the survey sites in Tianjin for the Early Screening and Comprehensive Intervention Program for Population at High Risk of CVD in China. This study used Tianjin region screening data sourced from 2017–2019 in the Major Public Health Service Project “Early Screening and Comprehensive Intervention for Population at High Risk of CVD.” This was supported by the Ministry of Finance and the National Health Planning Commission of China as part of the China Patient-Centered Evaluative Assessment of Cardiac Events study (PEACE). The screening process and the content of the questionnaire were published in the British Medical Journal in 2016.8
Subjects
A total of 102,061 permanent residents aged 35–75 from 45 community health service and village health centers in eight administrative regions of Tianjin were included in the 2017–2019 Tianjin survey. This study was conducted with approval from the Ethics Committee of Tianjin Chest Hospital. This study was conducted in accordance with the Declaration of Helsinki. Written informed consent was obtained from the survey respondents.
Data Collection
The study consisted of three parts: the questionnaire, a physical examination, and a blood test for biochemical markers. The questionnaire survey collected the following data: (1) demographic characteristics, including name, gender, ethnicity, ID number, current household status, current marital status, educational background, and total household income in the past year, (2) personal habits, such as smoking and alcohol consumption, (3) medical history, including a history of hypertension, stroke, DM, and MI, and (4) family history of CVD and stroke.
Data collected during the physical examination included blood pressure, height, weight, and waist circumference. Blood was drawn to obtain FBG and four blood lipids measurements: total cholesterol (TC), TGs, high-density lipoprotein cholesterol (HDL-C), and low-density lipoprotein cholesterol (LDL-C).
Face-to-face surveys were conducted by survey staff who had all received identical training. Collected data from the physical examinations and laboratory tests were double-entered and checked individually to eliminate inconsistent data.
Criteria for Determining a High Risk of CVD
The criteria for identifying high-risk groups for CVD were published in the British Medical Journal in 2016. It was proposed based on the 2007 WHO guidelines for assessing and managing cardiovascular risk in preventing CVDs.9 Considering that the level of blood lipids in the Chinese population is lower than that in the Western population, according to the survey of blood lipids in China, the standard of blood lipids is adjusted to LDL ≥4.14 mmol/L or HDL ≤0.78 mmol/L. Specific judgment criteria are as follows: the following parameters were used to identify a high risk of CVD: (1) a history of MI, (2) a history of percutaneous coronary intervention, (3) a history of coronary artery bypass surgery, (4) a history of stroke, (5) the presence of hypertension, grade 2 or higher, (6) LDL-C ≥4.14 mmol/L, (7) HDL-C ≥0.78 mmol/L, and (8) a 10-year CVD risk of ≥20% according to the risk assessment prediction chart in the 2007 WHO Guidelines for Cardiovascular Risk Assessment and Management.10 Subjects with at least one of the above criteria were regarded as belonging to a population with a high risk of CVD.
Formula for TyG: 11 TyG = Ln (Fasting serum TG [mg/dl] × FBG [mg/dl]/2)
Definitions of CVD Risks
(1) Hypertension: systolic blood pressure ≥140 mmHg, average diastolic blood pressure ≥90 mmHg, or a history of hypertension.12
(2) DM: FBG ≥7 mmol/L, or a history of DM, or a history of taking hypoglycemic medication.13
(3) Blood lipid abnormalities: TC ≥5.2 mmol/L or 200 mg/dL, HDL-C <1.0 mmol/L or 40 mg/dL, non-high density lipoprotein cholesterol ≥4.1 mmol/L or 160 mg/dL, LDL-C ≥3.4 mmol/L or 130 mg/dL, TG ≥1.7 mmol/L or 150 mg/dL.14
(4) Obesity: BMI ≥28 kg/m2.15
(5) Smoking: current smokers, ex-smokers were not included.
Statistical Analysis
The SPSS 25.0 software was adopted for data analysis. Subjects were divided into four groups, Q1, Q2, Q3, and Q4, according to TyG quartiles. Normally distributed data were expressed as (X ± S), and the independent sample t-test was used to compare two groups. The one-way-ANOVA test was used for comparison among groups. Countable data were expressed as rates, and comparisons between the two groups were conducted using a four-cell table chi-square test. A value of p < 0.05 was considered to be statistically significant. The Youden’s J statistic of the ROC curve was used to determine the TyG cut-off point predicting a high CVD risk, and the area under the curve (AUC) was calculated.
Results
General Characteristics of the Study Subjects
A total number of 102,061 subjects were included in this study, of which 39,598 (38.8%) were male and 62,463 (61.2%) were female, with an average age of 55.84 ± 10.27 years. After grouping the subjects into TyG quartiles, the differences between the four groups in respect of the following parameters were all statistically significant (p < 0.01): gender, age, body mass index (BMI), TC, TG, HDL-C, LDL-C, FBG, and history of smoking, alcohol consumption, hypertension, DM, coronary heart disease, and stroke (Table 1).
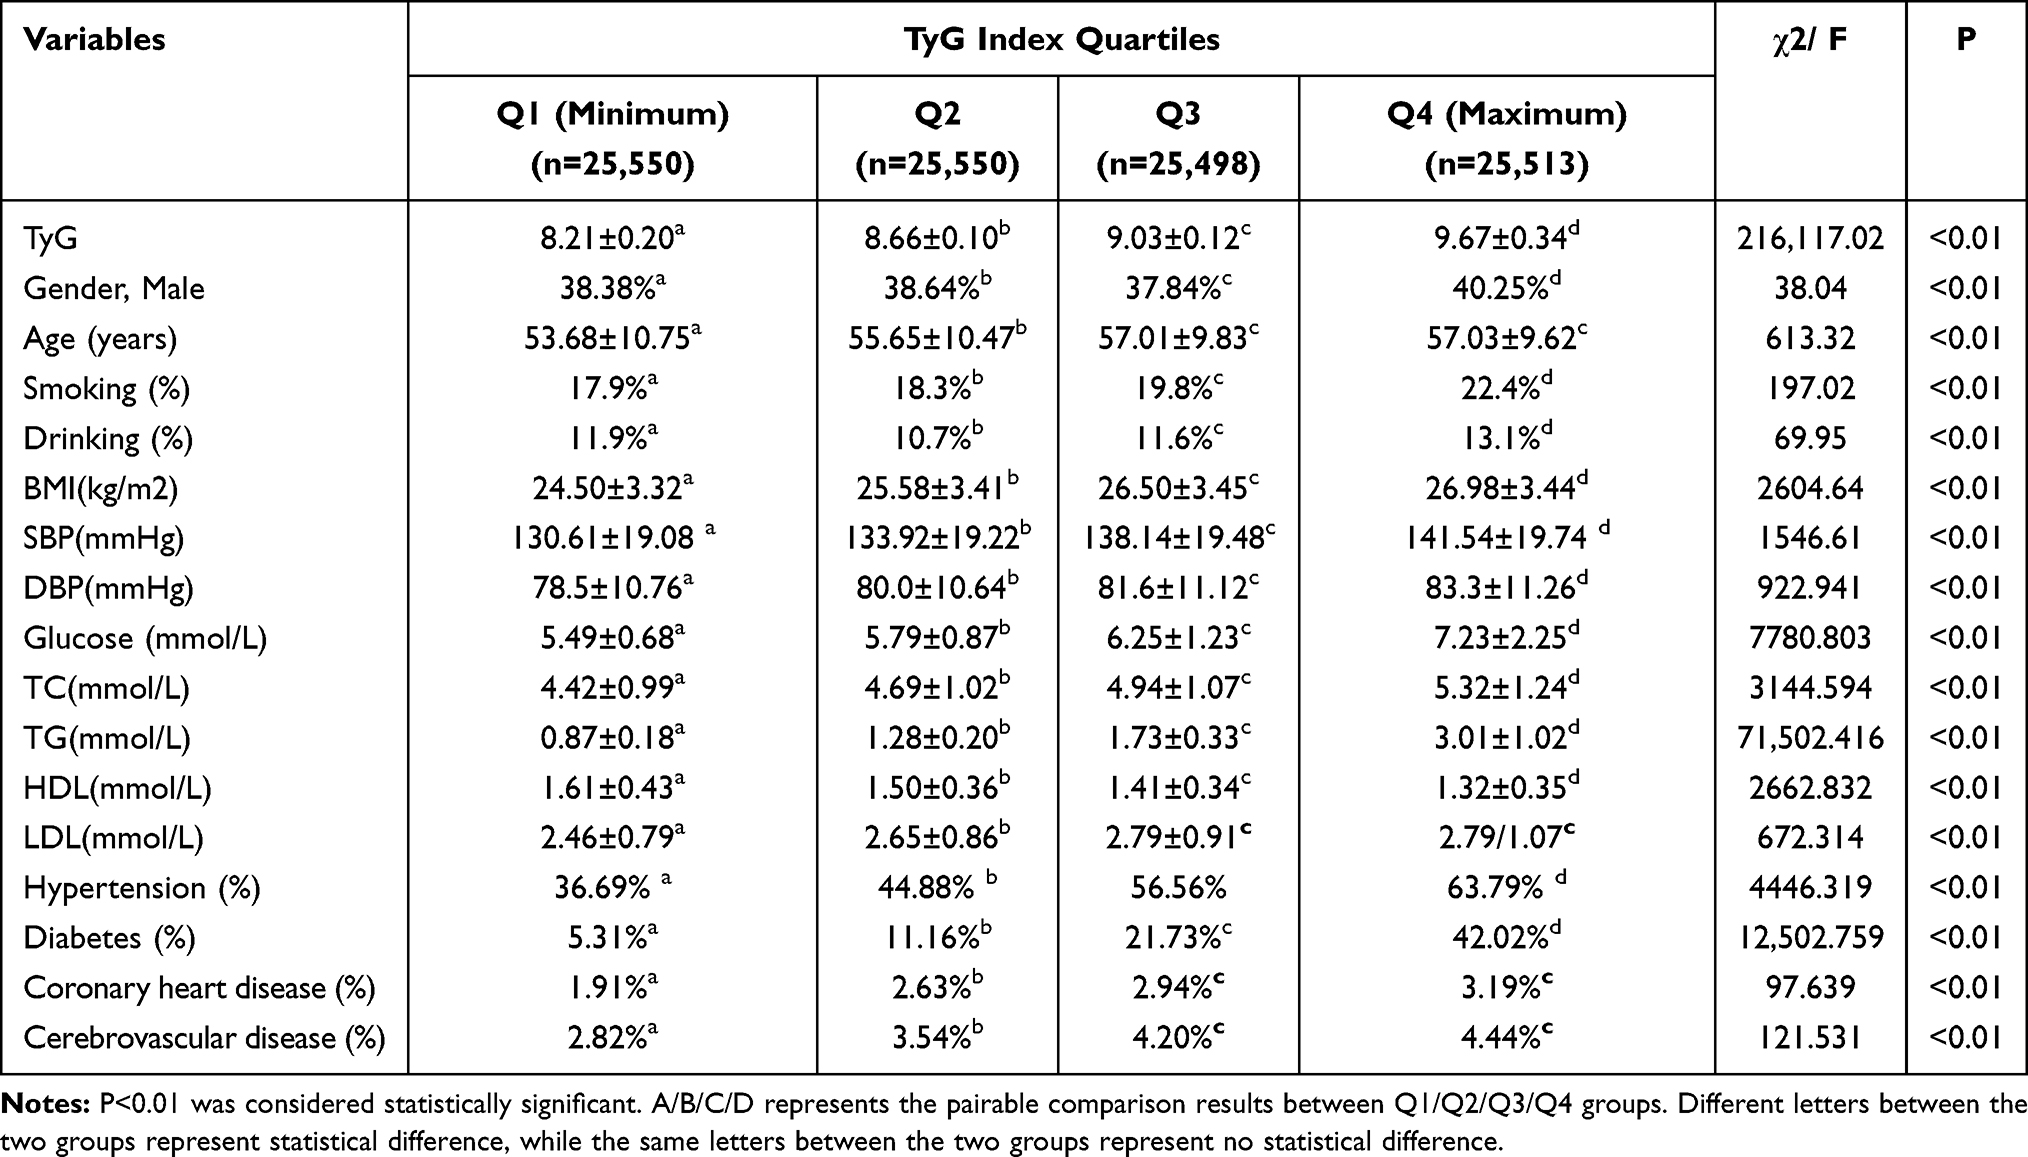 |
Table 1 Comparison of the Main Risk Factors Among the Four Groups According to the Quartiles of TyG |
TyG and Subjects with Multiple Traditional Cardiovascular Risk Factors
Combined cardiovascular disease risk factors were counted separately for each group by TyG index quartile group. The enrolled risk factors included smoking, obesity, history of hypertension, history of DM and dyslipidemia. The results showed that the distribution of subjects with 0 to ≥3 risk factors was statistically different among the four groups (χ2 = 16,692.61, p < 0.01), and the proportion of subjects with a combination of two, three or more risk factors increased significantly with increasing TyG (Table 2 and Figure 1).
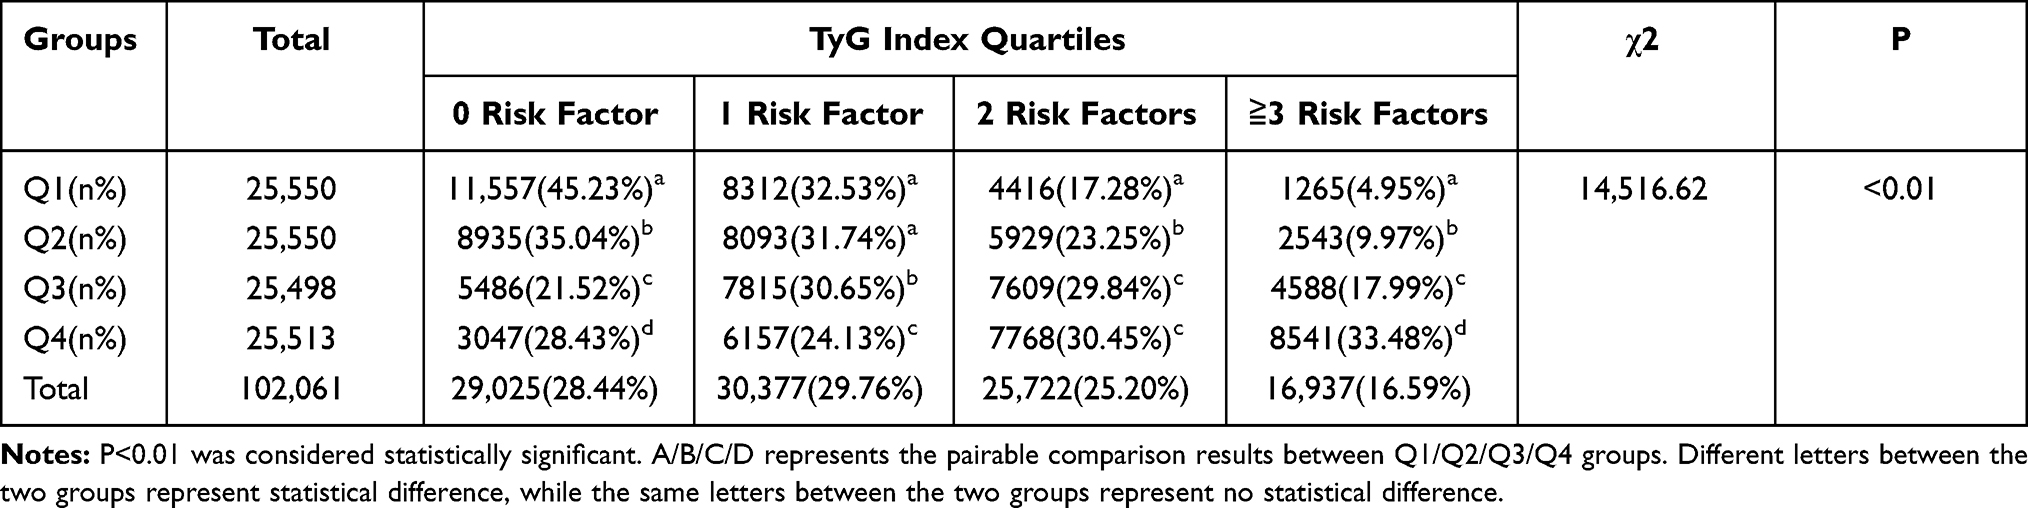 |
Table 2 Comparison of the Aggregation of Risk Factors of Cardiovascular Disease Among the Groups According to the Quartiles of TyG |
 |
Figure 1 Aggregation of risk factors of cardiovascular disease among the groups according to the quartiles of TyG. |
TyG and the Detection Rate of a High CVD Risk
After grouping the subjects by TyG quartiles, the detection rate of subjects with a high risk of CVD was 16.7%, 19.9%, 26.1%, and 32.3% in the four groups from low to high TyG quartiles, respectively. On analysis, these differences were statistically significant (χ2 = 2005.70, p < 0.01), as shown in Table 3 and Figure 2. Pearson correlation analysis showed that TyG was correlated with the detection rate of subjects with a high risk of CVD (r = 0.144, p < 0.01), as shown in Table 4. The results of the ROC curve analysis showed that a TyG of 9.04 (specificity 0.575, sensitivity 0.754) had the highest Yordon index for determining a high CVD risk and was the most effective threshold value for this purpose. The AUC of the ROC curve was 0.780 (CI: 0.777, 0.783, p < 0.01), as shown in Figure 3.
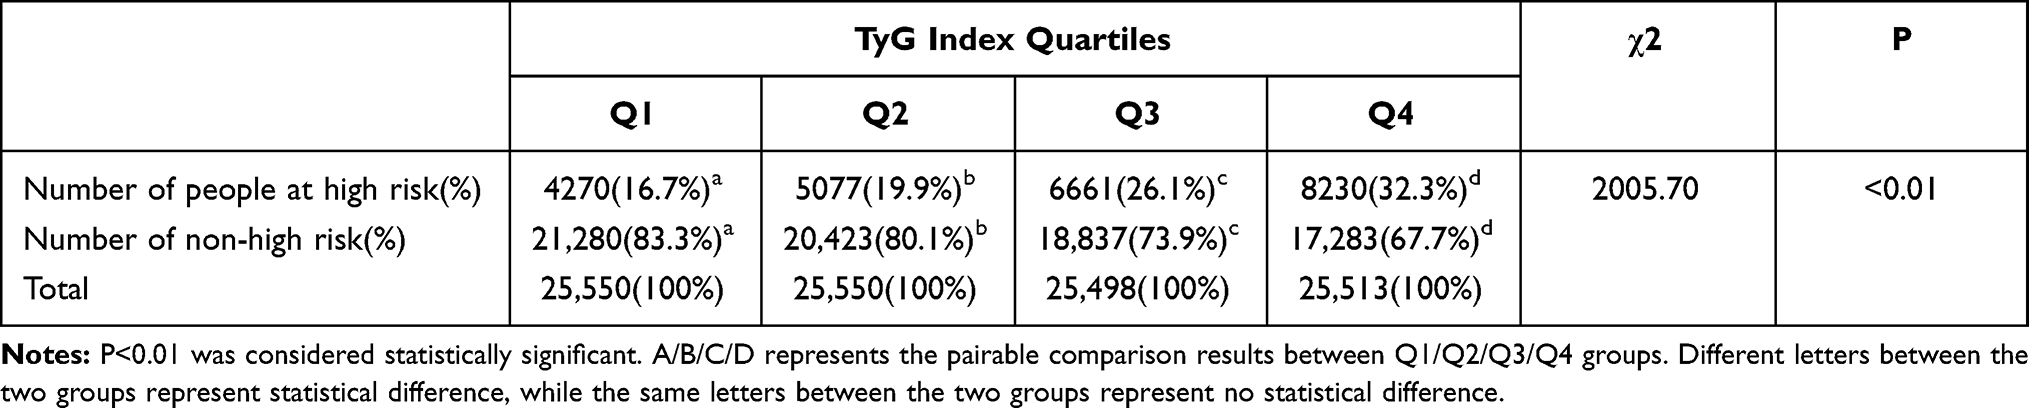 |
Table 3 Comparison of the Proportion of Subjects with High-Risk Factors of Cardiovascular Disease Among the Groups According to the Quartiles of TyG |
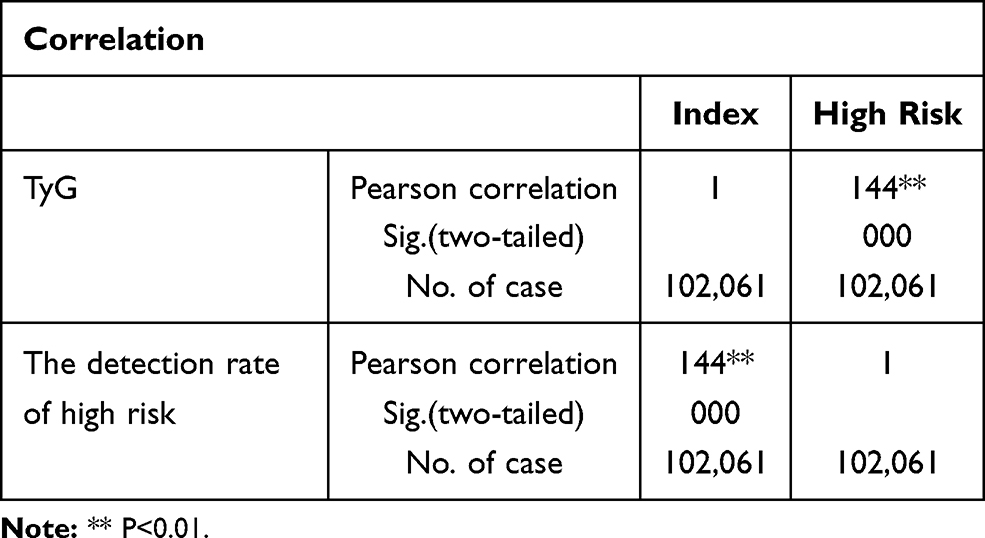 |
Table 4 Correlation Between TyG and the High Risk of Cardiovascular Disease |
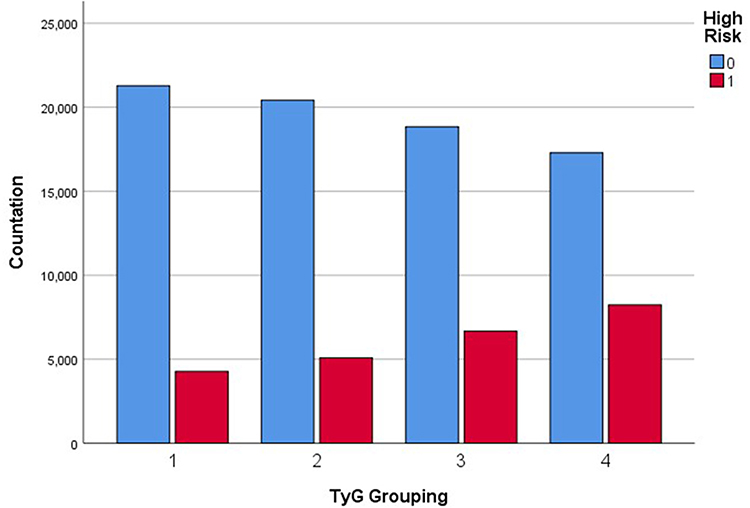 |
Figure 2 Number of subjects with high-risk factors of cardiovascular disease among the groups according to the quartiles of TyG. |
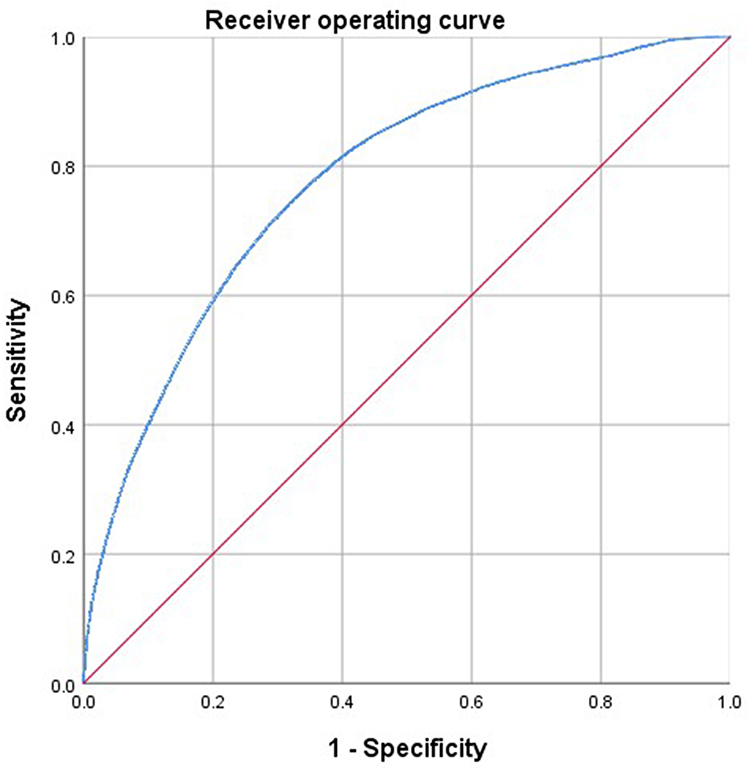 |
Figure 3 The ROC curve of TyG in predicting the high risk of cardiovascular disease. |
Discussion
In this study, analysis of data from 102,061 subjects identified that TyG was correlated with CVD risk. As the TyG increases, the aggregation of CVD risk factors increases significantly, and the number of people with a high risk of CVD increased significantly.
TyG has been widely investigated as an important index reflecting IR.16 IR is considered to be important in the pathophysiological basis for the development of DM and CVD.4 In recent years, TyG has gained attention in the areas of DM and metabolism and has had a positive effect on the evaluation and prediction of IR and metabolic syndrome in diabetic patients.17 Currently, there are studies investigating the correlation between TyG and both hypertension and atherosclerotic CVD. Cross-sectional studies have shown that elevated TyG is significantly correlated with a high risk of hypertension and isolated systolic hypertension in middle-aged and elderly populations. TyG has a more substantial discriminatory power for hypertension than other indicators, such as lipid and blood glucose.18,19 Longitudinal follow-up studies have also confirmed that a higher TyG is correlated with an increased risk of subsequent onset of hypertension.20
It has been shown that individuals in quartiles with a higher TYG index are more likely to develop atherosclerosis compared to quartiles with a lower TYG index,21 and studies have also shown an association between increased TyG and cardiovascular disease,22,23 stroke,24 and atherosclerotic plaque formation events such as coronary artery stenosis.25
Da Silva et al5 found that body weight, BMI, waist circumference(WC), waist circumference/height ratio, visceral adiposity index(VAI), Systolic blood pressure (SBP), Diastolic blood pressure(DBP), TC, LDL-C, and LDL-C/HDL-C ratio, dyslipidemia, diabetes, hypertension, physical inactivity, and smoking were positively correlated with TyG index. On the other hand, the TyG index was negatively correlated with age and HDL-C. The results were independent of gender and drug use. This study was carried out to investigate the relationship between TyG and cardiovascular risk based on screening the population. The study data were obtained from the Early Screening and Comprehensive Intervention Program for Population at High Risk of CVD conducted in China. This program enrolled permanent residents aged 35–75 years in Tianjin, including healthy adults and patients diagnosed with CVD and cerebrovascular disease. The enrolled subjects were divided into four groups according to the TyG quartiles. The baseline data concerning gender, age, blood pressure, lipids, FBG, and CVD in each group were used for comparison among groups. It was found that with an increasing TyG, there was an associated increase in the proportion of males, average age, blood levels of LDL-C, TC, TG, BMI, and proportion of patients with hypertension, DM, and hyperlipidemia. An increase in TyG was also associated with a decrease in HDL-C levels. These group differences were all statistically significant. These findings are broadly consistent with those of Da Silva. Smoking, obesity, hypertension, hyperlipidemia, and abnormal blood sugar are the main risk factors for CVDs. The aggregation of risk factors in the same individual can increase the risk of disease. The number of traditional cardiovascular risk factors (smoking, obesity, history of hypertension, history of DM, and dyslipidemia) present for each of the subjects were counted as one each and summed as a total. The concentration of cardiovascular risk factors is prevalent in the adult population in China. This study found that 41.8% of the population had CVD risk factor aggregation (≥2 risk factors). The subjects were also divided into four subgroups based on the TyG quartiles. The analysis found that the proportion of subjects with two, three, or more traditional risk factors increased with elevated TyG. It indicates that the aggregation of CVD risk factors increases significantly with the increase of TyG.
A cohort study conducted in Spain22 showed that after a follow-up period in the study population, multivariate Cox regression results showed that the increase of TyG index could elevate the risk of CVD (HR and 95% CI: 2.32:1.65 ~ 3.26). Moreover, the combined application of the Framingham model and TyG index in the prediction of this study is better than that of the Framingham model alone. There are no definitive findings on whether TyG can be used to determine the risk for those with a high risk of CVD. In this study, the cohort established by our screening was used to determine CVD risk according to the WHO judgment criteria, and TyG and the detection rate of subjects with a high risk of CVD were analyzed. The results showed that a correlation existed between the two, and the corresponding AUC of the ROC curve was 0.780 (CI: 0.777, 0.783, p < 0.01), suggesting that TyG may have a particular predictive value in identifying a high CVD risk.
In terms of the influence of drugs, hypoglycemic and lipid-lowering drugs can affect blood glucose and blood lipid levels, and diuretics and β-blockers in antihypertensive drugs may also affect blood glucose and blood lipid levels, which we have also taken into consideration. The study population is community residents. According to our analysis of the study population, the patients who used hypoglycemic drugs accounted for 10.8% of the study population and 54.2% of the diabetic population, but the blood glucose control rate (fasting blood glucose <7.0 mmol/L) was only 15.4%. Only 4.7% of the study population used lipid-lowering drugs. Among patients with hypertension, 5.8% received diuretics, and 3.8% received beta-blockers, mainly low-dose hydrochlorothiazide (12.5 mg) and indapamide (2.5 mg), with metoprolol and bisoprolol as the main beta-blockers. The use of these drugs was not sufficient to influence the results of this study.
TyG is a simple and novel synthetic index, and the cross-sectional survey data collected in this study confirmed a strong correlation between TyG and a high CVD risk in the Chinese adult population. However, as this study was based on a cross-sectional survey, it is difficult to prove a causal relationship between TyG and disease onset, which is a study limitation. In addition, this study failed to differentiate TyG by age and did not show whether subjects in different age groups would have other predictive values. A long-term follow-up should be conducted in future studies to investigate the role of TyG in predicting the disease risk in other age groups in China using large sample cohorts to provide a strong contribution to the prevention of CVD.
Conclusion
TyG index is closely related to the aggregation of cardiovascular risk factors and is correlated with the judgment results of the screening population’s high risk of CVD, suggesting that more attention should be paid to the identification and control of multiple risk factors in the population with significantly elevated TyG.
Disclosure
The authors report no conflicts of interest in this work.
References
1. Annual Report on Cardiovascular Health and Diseases in China 2019. China national cardiovascular disease center. Beijing Sci Press. 2020;9.
2. Damen JA, Hooft L, Schuit E, et al. Prediction models for cardiovascular disease risk in the general population: systematic review. BMJ. 2016;353:i2416. doi:10.1136/bmj.i2416
3. Tripolino C, Irace C, Scavelli FB, et al. Triglyceride glucose index and common carotid wall shear stress. J Investig Med. 2014;62(2):340–344. doi:10.2310/JIM.0000000000000043
4. Laakso M. Is insulin resistance a feature of or a primary risk factor for cardiovascular disease? Curr Diab Rep. 2015;15(12):105.
5. da Silva A, Caldas APS, Hermsdorff HHM, et al. Triglyceride-glucose index is associated with symptomatic coronary artery disease in patients in secondary care. Cardiovasc Diabetol. 2019;18(1):89. doi:10.1186/s12933-019-0893-2
6. Alizargar J, Bai CH, Hsieh NC, Wu SV. Use of the triglyceride-glucose index (TyG) in cardiovascular disease patients. Cardiovasc Diabetol. 2020;19(1):8. doi:10.1186/s12933-019-0982-2
7. Hong S, Han K, Park CY. The triglyceride glucose index is a simple and low-cost marker associated with atherosclerotic cardiovascular disease: a population-based study. BMC Med. 2020;18(1):361. doi:10.1186/s12916-020-01824-2
8. Lu J, Xuan S, Downing NS, et al. Protocol for the China PEACE (Patient-centered Evaluative Assessment of Cardiac Events) Million Persons Project pilot. BMJ Open. 2016;6(1):e010200. doi:10.1136/bmjopen-2015-010200
9. World Health Organization. Prevention of cardiovascular disease. Guidelines for assessment and management of cardiovascular risk. Geneva: WHO; 2007.
10. Mendis S, Lindholm LH, Mancia G, et al. World Health Organization (WHO) and International Society of Hypertension (ISH) risk prediction charts: assessment of cardiovascular risk for prevention and control of cardiovascular disease in low and middle-income countries. J Hypertens. 2007;25(8):1578–1582. doi:10.1097/HJH.0b013e3282861fd3
11. Simental-Mendía LE, Rodríguez-Morán M, Guerrero-Romero F. The product of fasting glucose and triglycerides as surrogate for identifying insulin resistance in apparently healthy subjects. Metab Syndr Relat Disord. 2008;6(4):299–304. doi:10.1089/met.2008.0034
12. China Hypertension Prevention and Control Guidelines Revision Committee, Hypertension Alliance (China) Cardiovascular Disease Branch of Chinese Medical Association, Hypertension Professional Committee of Chinese Physicians Association. Guidelines for the prevention and treatment of hypertension in China (2018 revised edition). Chin Cardiovasc J. 2019;24(1):24–56.
13. Chinese Medical Association. Diabetes Division, Guidelines for the prevention and treatment of type 2 diabetes in China (2017 edition). Chin J Diabetes. 2018;10(1):4–67.
14. Joint Committee on Revision of the Guidelines for the Prevention and Treatment of Dyslipidemia in Chinese Adults. Guidelines for the Prevention and Treatment of Dyslipidemia in Chinese Adults (2016 Revision). China Circulation J. 2016;31(10):937–953.
15. China Working Group on Obesity. Guidelines for the prevention and control of overweight and obesity in chinese adults (excerpt). J Nutr. 2004;01:1–4.
16. Toro-Huamanchumo CJ, Urrunaga-Pastor D, Guarnizo-Poma M, et al. Insulin Resistance and Metabolic Syndrome Research Group. Triglycerides and glucose index as an insulin resistance marker in a sample of healthy adults. Diabetes Metab Syndr. 2019;13(1):272–277. doi:10.1016/j.dsx.2018.09.010
17. da Silva A, Caldas APS, Rocha DMUP, Bressan J. Triglyceride-glucose index predicts independently type 2 diabetes mellitus risk: a systematic review and meta-analysis of cohort studies. Prim Care Diabetes. 2020;14(6):584–593. doi:10.1016/j.pcd.2020.09.001
18. Jian S, Su-Mei N, Xue C, Jie Z, Xue-Sen W. Association and interaction between triglyceride-glucose index and obesity on risk of hypertension in middle-aged and elderly adults. Clin Exp Hypertens. 2017;39(8):732–739. doi:10.1080/10641963.2017.1324477
19. Zhu B, Wang J, Chen K, et al. A high triglyceride glucose index is more closely associated with hypertension than lipid or glycemic parameters in elderly individuals: a cross-sectional survey from the Reaction Study. Cardiovasc Diabetol. 2020;19(1):112. doi:10.1186/s12933-020-01077-6
20. Zheng R, Mao Y. Triglyceride and glucose (TyG) index as a predictor of incident hypertension: a 9-year longitudinal population-based study. Lipids Health Dis. 2017;16(1):175. doi:10.1186/s12944-017-0562-y
21. Lee SB, Ahn CW, Lee BK, et al. Association etween triglyceride glucose index and arterial stiffness in Korean adults. Cardiovasc Diabetol. 2018;17:41. doi:10.1186/s12933-018-0692-1
22. Sánchez‑íñigo L, Navarro‑González D, Fernández‑Montero A, Pastrana‑Delgado J, Martínez JA. The TyG index may predict the development of cardiovascular events. Eur J Clin Invest. 2016;46:189–197. doi:10.1111/eci.12583
23. Jin J-L, Cao Y-X, Wu L-G. Triglyceride glucose index for predicting cardiovascular outcomes in patients with coronary artery disease. J Thorac Dis. 2018;10:6137–6146. doi:10.21037/jtd.2018.10.79
24. Sánchez‑Iñigo L, Navarro‑González D, Fernández‑Montero A, Pastrana‑Delgado J, Martínez J. Risk of incident ischemic stroke according to the metabolic health and obesity states in the Vascular Metabolic CUN cohort. Int J Stroke. 2017;12:187–191. doi:10.1177/1747493016672083
25. Salazar J, Bermúdez V, Olivar LC, et al. Insulin resistance indices and coronary risk in adults from Maracaibo city, Ven‑ezuela: a cross sectional study. F1000Research. 2018;7:44. doi:10.12688/f1000research.13610.1
 © 2021 The Author(s). This work is published and licensed by Dove Medical Press Limited. The
full terms of this license are available at https://www.dovepress.com/terms
and incorporate the Creative Commons Attribution
- Non Commercial (unported, 3.0) License.
By accessing the work you hereby accept the Terms. Non-commercial uses of the work are permitted
without any further permission from Dove Medical Press Limited, provided the work is properly
attributed. For permission for commercial use of this work, please see paragraphs 4.2 and 5 of our Terms.
© 2021 The Author(s). This work is published and licensed by Dove Medical Press Limited. The
full terms of this license are available at https://www.dovepress.com/terms
and incorporate the Creative Commons Attribution
- Non Commercial (unported, 3.0) License.
By accessing the work you hereby accept the Terms. Non-commercial uses of the work are permitted
without any further permission from Dove Medical Press Limited, provided the work is properly
attributed. For permission for commercial use of this work, please see paragraphs 4.2 and 5 of our Terms.