Back to Journals » Clinical Optometry » Volume 17
Correlation Between Retinal Vascular Oxygen Saturation, Red Blood Cell Parameters and Hemorheology Parameters in Healthy Adults
Authors Chang L ![]() , Li D
, Li D ![]() , Zhu K, Liu M, Duan J
, Zhu K, Liu M, Duan J
Received 20 December 2024
Accepted for publication 25 June 2025
Published 1 August 2025 Volume 2025:17 Pages 231—240
DOI https://doi.org/10.2147/OPTO.S513381
Checked for plagiarism Yes
Review by Single anonymous peer review
Peer reviewer comments 2
Editor who approved publication: Mr Simon Berry
Lu Chang,1 Dan Li,2 Keyu Zhu,1 Mei Liu,3 Junguo Duan1
1Chengdu Univerisity of Taditional Chinese Medicine, Chengdu, Sichuan, People’s Republic of China; 2Ningbo Eye Hospital, Wenzhou Medical University, Ningbo, Zhejiang, People’s Republic of China; 3Ankang Hospital of Traditional Chinese Medicine, Ankang, Shaanxi, People’s Republic of China
Correspondence: Junguo Duan, Chengdu University of Traditional Chinese Medicine, No. 37 Shierqiao Road, Jinniu District, Chengdu, Sichuan, 610036, People’s Republic of China, Tel +86 28-68890066 ; +86 13808048959, Fax +86 28-68224933, Email [email protected]
Purpose: Investigate the correlation between retinal vascular oxygen saturation and red blood cell parameters, hemorheology parameters in healthy adults.
Methods: The study recruited 120 healthy volunteers, and their elbow venous blood was drawn for examination of RBC parameters and hemorheology. The retinal oximeter measured the retinal vascular oxygen saturation, including retinal arteriolar oxygen saturation (SaO2), venous oxygen saturation (SvO2) and arteriovenous oxygen saturation Difference (AVD). The Pearson Correlation and Spearman’s Correlation methods were used to analyze the correlation between the SaO2, SvO2, AVD and the red blood cell parameters,hemorheology parameters.
Results: The analysis yielded a statistically significant correlation between SaO2 and BMI (r=0.184, P=0.044). SvO2 was associated with Gender (r=− 0.227, P=0.013), HGB (r=− 0.190, P=0.038), HCT (r=− 0.236, P=0.009), RDW-CV (r=0.228, P=0.012), WBRIH (r=0.019, P=0.037), WBVL 1/s (r=− 0.194, P=0.034), WBVM 50/s (r=− 0.206, P=0.024), WBVH 150/s (r=− 0.211, P=0.021) and WBVH 200/s (r=− 0.222, P=0.015). AVD was associated with Gender (r=− 0.318, P=0.000), BMI (r=0.269, P=0.003), RBC (r=0.282, P=0.002), HGB (r=0.263, P=0.004), RBCSI (r=0.187, P=0.041), WBRIH (r=0.289, P=0.001), WBRVH (r=0.247, P=0.006), WBVL 1/s (r=0.220, P=0.016), WBVL 10/s (r=0.289, P=0.001), WBVM 50/s (r=0.323, P=0.000), WBVH 150/s (r=0.320, P=0.000) and WBVH 200/s (r=0.320, P=0.000). Gender (β=− 0.297, P=0.005), BMI (β=0.208, P=0.023), PV (β=− 0.304, P=0.000) were independent predictors of AVD.
Conclusion: Retinal vascular oxygen saturation is correlated with many RBC parameters and hemorheology parameters, indicating that RBC and rheological characteristics of peripheral blood may affect the transport and metabolism of retinal oxygen and are closely related to retinal microcirculation.
Translational Relevance: The relationship between retinal blood oxygen saturation and red blood cell and hemorheology parameters confirmed the close correlation between ocular microcirculation and systemic blood circulation, which provided a prospective diagnosis and treatment strategy for microcirculatory-related eye diseases.
Keywords: retinal vascular oxygen saturation, retinal oximetry, retinal microcirculation, RBC parameters, hemorheology
Introduction
Retinal oxygen saturation, a key indicator for assessing microcirculatory status, quantifies the oxygen-binding capacity of hemoglobin in retinal blood vessels. Its measurement is based on the differential light absorption rates of oxygenated and deoxygenated hemoglobin at specific wavelengths, utilizing noninvasive retinal oximetry.1 In recent years, this technology has been widely applied in disease research, revealing characteristic alterations in retinal oxygen saturation among patients with systemic conditions such as diabetic retinopathy,2 glaucoma,3 and chronic kidney disease,4 suggesting potential associations with underlying pathological mechanisms.
Beyond pathological contexts, physiological factors influencing retinal oxygen saturation have garnered attention, yet existing findings remain contradictory. For instance, age exhibits both positive5 and negative6 correlations with arteriolar oxygen saturation (SaO₂) and venular oxygen saturation (SvO₂) across studies. Similarly, the effects of refractive status,7–9 vascular diameter,10,11 and ambient light intensity12 lack consensus. Notably, while hemodynamic parameters (eg, retinal capillary flow) and serum biomarkers (eg, HbA1c, lipid profiles) have been implicated in retinal metabolic disorders,13,14 their relationships with retinal oxygen saturation in healthy individuals remain underexplored.
Based on these gaps, we propose the central hypothesis: retinal vascular oxygen saturation in healthy adults is significantly associated with red blood cell parameters, hemorheological indices and systemic circulatory characteristics, and these associations reflect an interaction between ocular microcirculation and systemic blood circulation. By integrating retinal oxygen saturation data with hematological profiling, this study aims to identify key determinants of retinal oxygen metabolism, providing a theoretical foundation for early detection of microcirculatory dysfunction.
Methods
This study was an observational cross-sectional study of healthy adults. It was conducted following the tenets of the Declaration of Helsinki and was approved by the Medical Ethics Committee of Ineye Hospital of Chengdu University of Traditional Chinese Medicine (Approval Number: 2021yh-021). A total of 120 healthy volunteers were enrolled in this study, who all had full knowledge of the study and voluntarily signed the informed consent form before participation.
Inclusion and Exclusion Criteria
The Inclusion criteria of this study were best-corrected visual acuity more than 1.0, refractive errors lower or equal −6.00/+3.00 dioptres, age between 18 and 75 years old, Body Mass Index (BMI) between 18.5 and 23.9. The exclusion criteria of this study were pregnant or lactating women, a history of diabetes, hypertension, cardiovascular and respiratory diseases and other severe diseases and mental illness, a history of eye trauma, eye surgery and glaucoma, retinitis pigmentosa, age-related macular degeneration, retinal artery or vein occlusion and other eye diseases, long-term history of cigarette, alcohol and other unhealthy habits.
Inspection
120 healthy adults were enrolled in this study. Each participant underwent the same examination: Height, Weight, Routine Blood Examination, Hemorheology Examination, Visual Acuity (logMAR), IOP (TopconCT-80A, Topcon Inc., Tokyo, Japan), Slit-Lamp Examination (Keeler SL4, Keeler Co. Ltd, Berkshire, UK), Ophthalmoscope Examination (YZ6F, 66 Vision-Tech Co. Ltd, Suzhou, China), Retinal Oximetry (Oxymap T1, Oxymap ehf., Reykjavik, Iceland).
Each participant arrived at the hospital on an empty stomach and rested for 30 minutes before examination. The researchers first performed Visual Acuity, IOP, Slit-Lamp Examination, Ophthalmoscope Examination to exclude eye diseases. Then the elbow vein blood of participants was drawn for Routine Blood Examination and Hemorheology Examination.
The subjects did not take any drugs affecting blood rheology and microcirculation within 2 weeks before the blood draw, and had blood test on an empty stomach in the morning of the same day. The reagents and quality control products used for blood drawing were provided by the manufacturer, and the specific inspection procedures were conducted in strict accordance with the laboratory instrument operation manual. RBC-related parameters were analyzed using the automatic five-classification blood cell analyzer (DH76, Dymind Biotechnology Co. Ltd., Shenzhen, China) and the parameters for their analysis included Red Blood Cell (RBC), Hemoglobin (HGB), Hematocrit (HCT), Mean Corpuscular Volume (MCV), Mean Corpuscular Hemoglobin (MCH), Mean Corpuscular Hemoglobin Concentration (MCHC), Red Blood Cell Distribution Width-Standard Deviation (RDW-SD), Red Blood Cell Distribution Width-Coefficient of Variation (RDW-CV). Hemorheological parameters were analyzed using the automatic blood viscosity analyzer (South990-ACC2000, Nanfang Numerical Control Equipment Co., Ltd, Chongqing, China), the parameters for their analysis included Plasma Viscosity (PV), Red Blood Cell Stiffness Index (RBCSI), Red Blood Cell Aggregation Index (RBCAI), Red Blood Cell Deformation Index (RBCDI), Whole Blood Relative Index Low-cut (WBRIL), Whole Blood Relative Index High-cut (WBRIH), Whole Blood Reduced Viscosity Low-cut (WBRVL), Whole Blood Reduced Viscosity High-cut (WBRVH), Whole Blood Viscosity Low-cut 1/s (WBVL 1/s), Whole Blood Viscosity Low-cut 10/s (WBVL 10/s), Whole Blood Viscosity Mid-cut 50/s (WBVM 50/s), Whole Blood Viscosity High-cut 150/s (WBVH 150/s), Whole Blood Viscosity High-cut 200/s (WBVH 200/s).
The pupil were dilated to a diameter of 6~8 mm by using Compound Tropicamide Eye Drops before retinal oximetry. The fundus images acquisition were performed under darkroom conditions. The fundus images were taken in a 50°field centred at the optic disc and the light flash was set at 50 Ws. The right eye of each subject was selected for the study. The fundus images were analysed by Oxymap Analyzer software (Oxymap T1, Version 1.2, the interface is shown in Figures 1 and 2). The measurement zone was a concentric circle area centered on the optic disc, which inner circle diameter was 1.5 times the optic disc and the outer circle was 3 times the optic disc. Small retinal vessels with width more than 8 pixels and length more than 100 pixels within the region were selected for analysis. If there were branching blood vessels, the parent branch vessel was selected. If the length of the parent branch was less than 100 pixels, the sub-branch was selected. At the intersections of vessels, the distal segment was selected unless the length of it was less than 100 pixels. The mean retinal vessel oxygen saturation level was calculated as shown in the following formula: S=(S1*D14+S2*D24+S3*D34+…+Sn*Dn4)/(D14+D24+D34+…+Dn4), where S represented Mean oxygen saturation, Sn represented saturation of n vessel segment, Dn represented diameter of n vessel segment. The Arteriovenous Oxygen Saturation Difference (AVD) is calculated as the difference between SaO2 and SvO2, expressed as: AVD=SaO2-SvO2.
 |
Figure 1 The original image captured using the Oxymap Analyzer software. |
 |
Figure 2 In the Oxymap Analyzer software, blood vessels are automatically identified. The redder the color of the blood vessels, the higher the blood oxygen saturation, while the greener the color, the lower the blood oxygen saturation. |
Statistical Analysis
A priori power analysis was performed using GPower (Version 3.1). Based on an expected medium effect size (f2=0.15, f2=0.15), a significance level of α=0.05, and a power of 80%, the minimum required sample size was determined to be 85 participants. Our final sample of 120 participants exceeded this requirement, ensuring adequate statistical power.
The statistical analysis was performed using software IBM SPSS Statistics (Version 24.0) and Origin (Version 2024). All the data were performed for the test of normality using the Kolmogorov–Smirnov method. All normally distributed variables were reported as Mean±Standard Deviation (SD), and other variable as Median with Range. Pearson Correlation method was performed for the correlation between data meeting the normal distribution, while Spearman’s Correlation method was performed for the correlation between data not meeting the normal distribution. Furthermore, to account for potential confounding effects and evaluate the independent contributions of variables, multiple linear regression analyses were employed. To address multicollinearity, variables with variance inflation factors (VIF) >10 were excluded based on statistical thresholds and theoretical relevance, and the regression model was refitted to ensure stability and interpretability. All statistical tests were two-tailed, with a corrected significance threshold of P<0.05.
Results
A total of 120 eyes were enrolled in this study, 32 (26.67%) males and 88 (73.33%) females. The mean±standard deviation of each normally distributed variables can be seen in detail in Table 1 and Table 2.
 |
Table 1 Descriptive Statistical Data for Normally Distributed Variables |
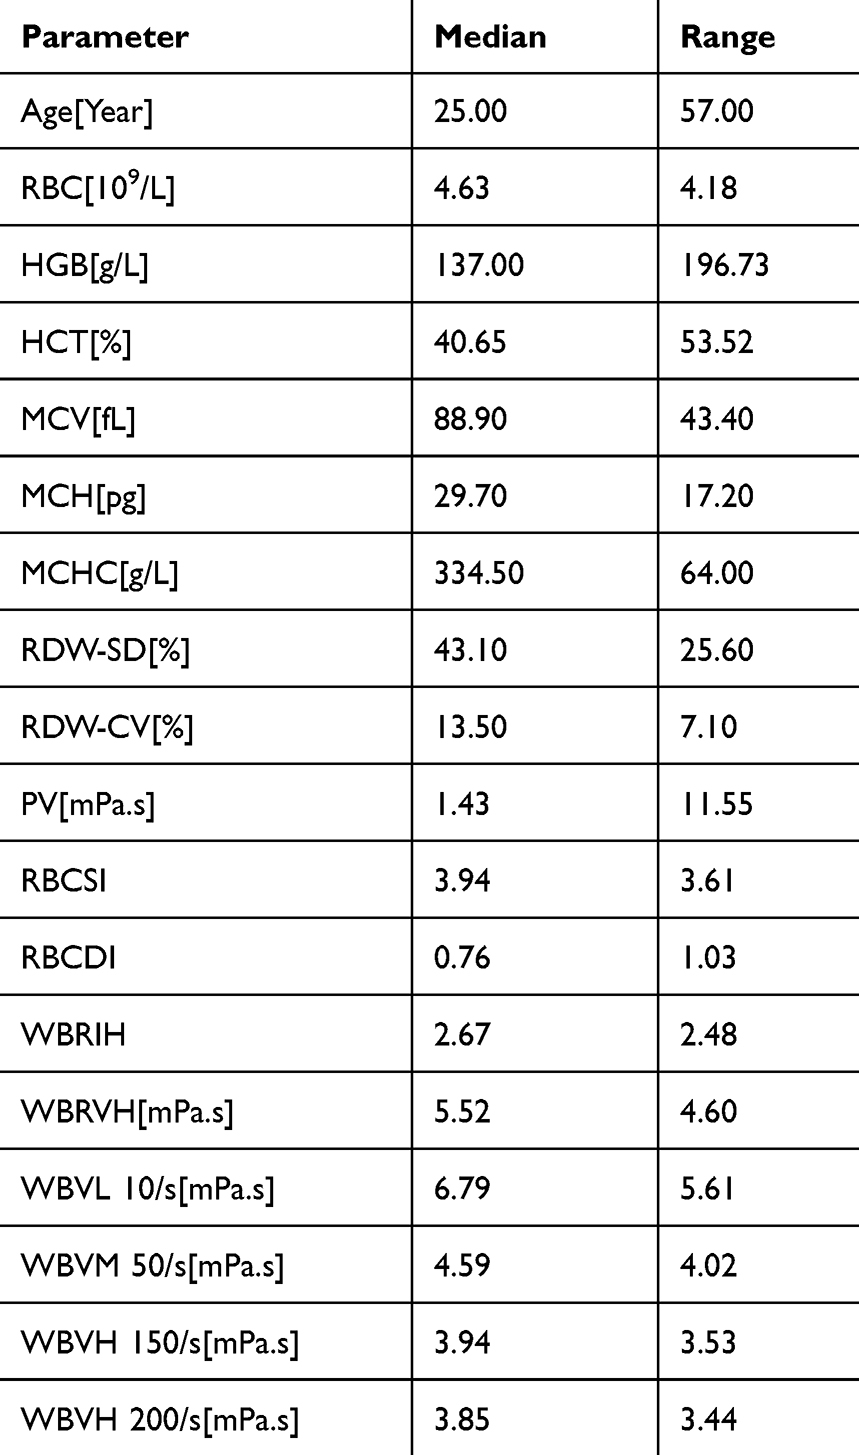 |
Table 2 Descriptive Statistical Data for Other Variables |
The analysis yielded a statistically significant correlation between SaO2 and BMI (r=0.184, P=0.044). SvO2 was associated with Gender (r=−0.227, P=0.013), HGB (r=−0.190, P=0.038), HCT (r=−0.236, P=0.009), RDW-CV (r=0.228, P=0.012), WBRIH (r=0.019, P=0.037), WBVL 1/s (r=−0.194, P=0.034), WBVM 50/s (r=−0.206, P=0.024), WBVH 150/s (r=−0.211, P=0.021) and WBVH 200/s (r=−0.222, P=0.015). AVD was associated with Gender (r=−0.318, P=0.000), BMI (r=0.269, P=0.003), RBC (r=0.282, P=0.002), HGB (r=0.263, P=0.004), RBCSI (r=0.187, P=0.041), WBRIH (r=0.289, P=0.001), WBRVH (r=0.247, P=0.006), WBVL 1/s (r=0.220, P=0.016), WBVL 10/s (r=0.289, P=0.001), WBVM 50/s (r=0.323, P=0.000), WBVH 150/s (r=0.320, P=0.000) and WBVH 200/s (r=0.320, P=0.000). These can be seen in detail in Table 3. The correlation heat map is shown in Figure 3.
 |
Table 3 Correlation Between SaO2, SvO2, AVD and Red Blood Cell Parameters, Hemorheology Parameters |
 |
Figure 3 The correlation heat map of all the parameters. * represents statistically significant differences. Blue represents the negative correlation between parameters, red represents the positive correlation between parameters. The deeper the color, the stronger correlation. |
This study aimed to conduct multiple linear regression analysis on the research data to explore the relationships between variables. However, preliminary analysis revealed that multiple data points exhibited multicollinearity issues (VIF> 10). Therefore, the data were first screened, and Gender, Age, BMI, RBC, HGB and PV. These representative and relatively independent indicators were selected for the multiple linear regression analysis. Multiple linear regression analyses revealed that the model for AVD was statistically significant (R2=0.479, F=5.596, P=0.000), whereas models for SaO₂ (R2=0.300, F=0.869, P=0.092) and SvO₂ (R2=0.311, F=2.023, P=0.068) did not reach significance. Further examination of individual predictors in the AVD model indicated that gender (β=−0.297, P=0.005), BMI (β=0.208, P=0.023), PV (β=−0.304, P=0.000) was independently associated with AVD. These can be seen in detail in Table 4.
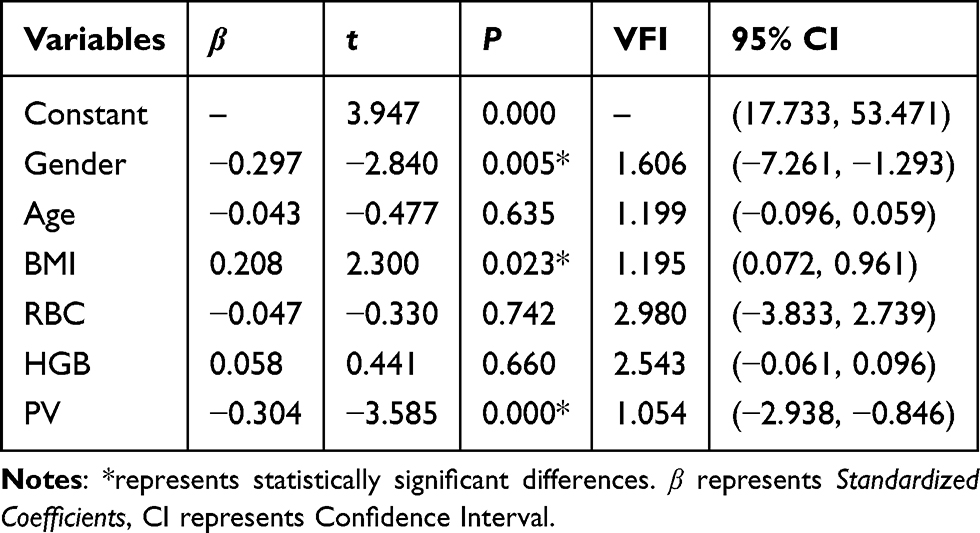 |
Table 4 Multiple Linear Regression Analysis of AVD and Red Blood Cell Parameters, Hemorheology Parameters |
Discussion
This study was the first to reveal the dynamic correlations between retinal vascular oxygen saturation and RBC parameters as well as hemorheological characteristics in healthy adults, systematically elucidating the interactive mechanisms among RBC function, hemorheological properties and retinal oxygen metabolism.
Correlation Between Gender, Age and BMI with Retinal Oximetry Measures
The results of this study confirmed that gender was an independent negative predictor of AVD, suggesting that the retinal oxygen uptake and utilization may be different in women and men. In previous studies, the influence of gender on retinal vascular oxygen saturation has been inconsistent. Some investigations demonstrated no significant association between retinal vascular oxygen saturation and gender,15,16 while others identified gender-related differences.17 This discrepancy might be explained by the observation that venous oxygen saturation decreases with age at a faster rate in males compared to females, a phenomenon potentially attributable to sex-specific patterns of vascular aging and hemodynamic regulation.17
The results also suggested that SaO2, SvO2 and AVD were not related with age. Several previous studies had explored the relationship between age and retinal vascular oxygen saturation. Geirsdottir et al17 found that SaO2 was not correlated with age in healthy people, while SvO2 was negatively correlated with age, and AVD was negatively correlated with age. However, Man et al5 found a positive relationship between SaO2, SvO2 and age, while Jani et al6 found a negative relationship between SaO2, SvO2 and age. The differences in these results may be related to the ethnic differences,16 the age range of the sample population, the opacity of the dioptric media, and the confounding factors such as having other diseases.
BMI is a widely used parameter of reflecting human obesity and nutritional degree. The results suggested that SaO2 and AVD were related with BMI, and BMI existed as an independent factor of AVD, which was consistent with the findings of Liu et al.18 Related studies had shown that there was a positive correlation between human BMI and blood hemoglobin content, which can directly affect the measurement value of retinal vascular oxygen saturation. In addition, women had a significantly lower basal metabolic rate than men.19 From this, we can speculate that the retinal vascular oxygen saturation can reflect the systemic nutritional metabolic state of the human body to a certain extent. In some eye diseases with retinal microcirculation disorders, controlling a certain BMI can be used as an important means of adjuvant treatment.
Correlation Between RBC Parameters with Retinal Oximetry Measures
The results of this study showed that the correlation of retinal vascular oxygen saturation and RBC parameters were mainly focused on RBC, HGB, HCT and RDW-CV. RBC is the carrier of the body for transporting oxygen, while HGB is the oxygen transport protein. HCT refers to packed RBC relative to whole blood, which indirectly reflects the amount of RBC and HGB and determines the oxygen-carrying capacity of blood.20 RDW-CV reflects the difference in RBC volume, and its elevation represents the dysregulation of RBC homeostasis, including impaired erythropoiesis and abnormal RBC survival,21 which is associated with various diseases of hypoxemia.22 The results of this study suggested a positive correlation between SvO2 and RDW-CV, indicating that high RDW-CV may reduce the absorption and utilization of oxygen in retinal tissue. In the process of retinal microcirculation, oxygen is freely diffused from HGB to various retinal tissues for its physiological function,23 and the level of retinal oxygen saturation can reflect the function of oxygenation and metabolism.24 The more mature RBC, the more HGB that can transport oxygen. Thus, due to the different oxygen partial pressure, more oxygen is distributed to various retinal tissues, so the lower the SvO2, the higher the AVD.
Based on the existing technology, we are unable to measure RBC and HGB in retinal blood vessels, but the correlation between peripheral RBC parameters and retinal vascular oxygen saturation explored in this study can initially reflect the relationship between systemic blood circulation and retinal microcirculation. We can speculate that individuals with high RBC and high HGB have higher oxygen demand and utilization in their retina and more active retinal microcirculation.
Correlation Between Hemorheology with Retinal Oximetry Measures
The results of this study showed that the correlation between retinal vascular oxygen saturation and hemorheology were mainly focused on RBCSI, WBRIH, WBRVH, WBVL 1/s, WBVL 10/s, WBVM 50/s, WBVH 150/s and WBVH 200/s. Hematheology is the parameter of the physical properties of blood cells, the properties of blood flow and the interaction state with the vascular wall. It is closely related to the deformation, aggregation, surface charge, changes in plasma composition, shear force of blood and other factors of RBC. The main determinants of whole blood viscosity are HCT, PV, fibrinogen level and the properties of RBC, including stiffness, aggregation and deformation.25 Under pathological conditions, RBC deforms, aggregates, stiffness decreases, while blood viscosity increases and other circulating cells and endothelial cells are activated, leading to vascular occlusion and slow blood flow, which affecting hemorheology parameters.26 Abnormal hemorheological parameters can directly affect the blood perfusion of tissues, thus leading to tissue metabolic disorders and hypoxia, while hypoxia can also cause the change of hemorheological parameters. Kang et al27 found that hypoxia can increase whole blood viscosity, so as to impair the function of RBC and promote the platelet aggregation, leading to various hypoxic diseases. In addition, Esteva et al28 found that hypoxia can cause a significant reduction in PV. As one of the most vigorous tissues of systemic oxygen metabolism, the retina needs abundant oxygen for its physiological function, and oxygen is closely related to hemorheology parameters. Plasma viscosity emerges as a critical determinant of intraretinal oxygen gradients, exerting significant modulation over oxygen availability within the retinal ganglion cell microenvironment through its impact on capillary perfusion dynamics.29 Cross-sectional evidence have linked PV to critical ocular disease markers, including retinal vascular occlusions, glaucoma, diabetic retinopathy,30–32 suggesting PV’s role as a shared hemodynamic risk modulator across diverse retinal pathologies. The results of this study showed the correlation between multiple hemorheology parameters and retinal vascular oxygen saturation, and PV was an independent factor affecting ADV after excluding various confounding factors.
Consequently, we can know that retinal vascular oxygen saturation is correlated with many RBC and hemorheological parameters, indicating that RBC and peripheral blood features may affect the transport and metabolism of retinal oxygen, and are closely related to retinal microcirculation.
Limitations
Our study has several limitations. For instance, we did not control for the gender ratio of participants. In addition, we did not collect systemic oxygen circulation parameters such as blood gas analysis and peripheral oxygen saturation. As a cross-sectional study, it was not possible to observe the longitudinal effects of various factors on retinal oxygen metabolism. We plan to address these aspects in future research to obtain more comprehensive findings.
Conclusion
This study demonstrated significant associations between retinal vascular oxygen saturation and systemic circulatory parameters, including gender, BMI, erythrocyte characteristics and hemorheological indices, establishing a robust connection between retinal oxygen dynamics and systemic hemodynamics. Gender, BMI and PV were identified as independent determinants of AVD. These observations suggest that systemic circulatory mechanisms, mediated by oxygen transport efficiency and metabolic adaptation, may critically influence retinal function, offering potential pathways to mitigate hypoxia-induced microvascular dysfunction. Future investigations should prioritize causal validation of these systemic–retinal interactions and evaluate their disease-specific manifestations in several conditions.
Acknowledgment
This study was supported by the National Natural Science Foundation of China, grant number: 82074335. The funding organization had no role in the design or conduct of this research.
Disclosure
All authors declared no potential conflicts of interest.
References
1. Garg AK, Knight D, Lando L, Chao DL. Advances in retinal oximetry. Transl Vis Sci Technol. 2021;10(2):5. doi:10.1167/tvst.10.2.5
2. Wang XL, Cai FR, Gao YX, Zhang J, Zhang M. Changes and significance of retinal blood oxygen saturation and oxidative stress indexes in patients with diabetic retinopathy. World J Diabetes. 2022;13(5):408–416. doi:10.4239/wjd.v13.i5.408
3. Cheng CS, Lee YF, Ong C, et al. Inter-eye comparison of retinal oximetry and vessel caliber between eyes with asymmetrical glaucoma severity in different glaucoma subtypes. Clin Ophthalmol. 2016;10:1315–1321. doi:10.2147/OPTH.S96529
4. Ooi QL, Tow FK, Deva R, et al. The microvasculature in chronic kidney disease. Clin J Am Soc Nephrol. 2011;6(8):1872–1878. doi:10.2215/CJN.10291110
5. Man RE, Sasongko MB, Kawasaki R, et al. Associations of retinal oximetry in healthy young adults. Invest Ophthalmol Vis Sci. 2014;55(3):1763–1769. doi:10.1167/iovs.13-13320
6. Jani PD, Mwanza JC, Billow KB, Waters AM, Moyer S, Garg S. Normative values and predictors of retinal oxygen saturation. Retina. 2014;34(2):394–401. doi:10.1097/IAE.0b013e3182979e7b
7. Ge S, Zhou Y, Li C, Zhang M. Retinal vascular oxygen saturation in a sample of Chinese myopic adults. Invest Ophthalmol Vis Sci. 2023;64(14):13. doi:10.1167/iovs.64.14.13
8. Ge S, Yang L, Zhou Y, Li C, Zhang J. Retinal vascular oxygen saturation in adults with anisometropia. Transl Vis Sci Technol. 2023;12(4):14. doi:10.1167/tvst.12.4.14
9. Liu X, Wang S, Liu Y, et al. Retinal oxygen saturation in Chinese adolescents. Acta Ophthalmol. 2017;95(1):e54–e61. doi:10.1111/aos.13167
10. de Jong FJ, Vernooij MW, Ikram MK, et al. Arteriolar oxygen saturation, cerebral blood flow, and retinal vessel diameters. The Rotterdam study. Ophthalmology. 2008;115(5):887–892. doi:10.1016/j.ophtha.2007.06.036
11. Mohan A, Dabir S, Yadav NK, Kummelil M, Kumar RS, Shetty R. Normative database of retinal oximetry in Asian Indian eyes. PLoS One. 2015;10(4):e0126179. doi:10.1371/journal.pone.0126179
12. Hardarson SH, Basit S, Jonsdottir TE, et al. Oxygen saturation in human retinal vessels is higher in dark than in light. Invest Ophthalmol Vis Sci. 2009;50(5):2308–2311. doi:10.1167/iovs.08-2576
13. Khoobehi B, Firn K, Thompson H, Reinoso M, Beach J. Retinal arterial and venous oxygen saturation is altered in diabetic patients. Invest Ophthalmol Vis Sci. 2013;54(10):7103–7106. doi:10.1167/iovs.13-12723
14. Eliasdottir TS, Bragason D, Hardarson SH, et al. Retinal oximetry measures systemic hypoxia in central nervous system vessels in chronic obstructive pulmonary disease. PLoS One. 2017;12(3):e0174026. doi:10.1371/journal.pone.0174026
15. Yang W, Fu Y, Dong Y, et al. Retinal vessel oxygen saturation in a healthy young Chinese population. Acta Ophthalmol. 2016;94(4):373–379. doi:10.1111/aos.12943
16. Bisignano KK, Smith JD, Harrison WW. Variations in retinal oxygen saturation in a diverse healthy population. Clin Optom. 2024;16:147–155. doi:10.2147/OPTO.S468076
17. Geirsdottir A, Palsson O, Hardarson SH, Olafsdottir OB, Kristjansdottir JV, Stefánsson E. Retinal vessel oxygen saturation in healthy individuals. Invest Ophthalmol Vis Sci. 2012;53(9):5433–5442. doi:10.1167/iovs.12-9912
18. Liu X, He X, Yin Y, et al. Retinal oxygen saturation in 1461 healthy children aged 7-19 and its associated factors. Acta Ophthalmol. 2019;97(3):287–295. doi:10.1111/aos.14043
19. Lazzer S, Bedogni G, Lafortuna CL, et al. Relationship between basal metabolic rate, gender, age, and body composition in 8780 white obese subjects. Obesity. 2010;18(1):71–78. doi:10.1038/oby.2009.162
20. Reinhart WH. The optimum hematocrit. Clin Hemorheol Microcirc. 2016;64(4):575–585. doi:10.3233/CH-168032
21. Wang J, Wan Z, Liu Q, et al. Predictive value of red blood cell distribution width in chronic obstructive pulmonary disease patients with pulmonary embolism. Anal Cell Pathol. 2020;2020:1935742. doi:10.1155/2020/1935742
22. Yčas JW. Toward a blood-borne biomarker of chronic hypoxemia: red cell distribution width and respiratory disease. Adv Clin Chem. 2017;82:105–197. doi:10.1016/bs.acc.2017.06.002
23. Werkmeister RM, Schmidl D, Aschinger G, et al. Retinal oxygen extraction in humans. Sci Rep. 2015;5(1):15763. doi:10.1038/srep15763
24. Liu R, Spicer G, Chen S, Zhang HF, Yi J, Backman V. Theoretical model for optical oximetry at the capillary level: exploring hemoglobin oxygen saturation through backscattering of single red blood cells. J Biomed Opt. 2017;22(2):25002. doi:10.1117/1.JBO.22.2.025002
25. Yelmen N, Ozdemir S, Guner I, et al. The effects of chronic long-term intermittent hypobaric hypoxia on blood rheology parameters. Gen Physiol Biophys. 2011;30(4):389–395. doi:10.4149/gpb_2011_04_389
26. Laurance S, Marin M, Colin Y. Red blood cells: a newly described partner in central retinal vein occlusion pathophysiology? Int J Mol Sci. 2023;24(2):1072. doi:10.3390/ijms24021072
27. Kang J, Li Y, Hu K, et al. Chronic intermittent hypoxia versus continuous hypoxia: same effects on hemorheology? Clin Hemorheol Microcirc. 2016;63(3):245–255. doi:10.3233/CH-151973
28. Esteva S, Panisello P, Torrella JR, Pagés T, Viscor G. Blood rheology adjustments in rats after a program of intermittent exposure to hypobaric hypoxia. High Alt Med Biol. 2009;10(3):275–281. doi:10.1089/ham.2008.1086
29. Causin P, Guidoboni G, Malgaroli F, Sacco R, Harris A. Blood flow mechanics and oxygen transport and delivery in the retinal microcirculation: multiscale mathematical modeling and numerical simulation. Biomech Model Mechanobiol. 2016;15(3):525–542. doi:10.1007/s10237-015-0708-7
30. Kolar P. Risk factors for central and branch retinal vein occlusion: a meta-analysis of published clinical data. J Ophthalmol. 2014;2014:724780. doi:10.1155/2014/724780
31. Michalska-Małecka K, Słowińska-łozyńska L, Romaniuk W. Influence of rheological factors on the development of primary open angle glaucoma. Klin Oczna. 2012;114(2):135–137.
32. Pepple DJ, Reid HL. Alterations in hemorheological determinants and glycated hemoglobin in black diabetic patients with retinopathy. J Natl Med Assoc. 2009;101(3):258–260. doi:10.1016/s0027-9684(15)30854-3
 © 2025 The Author(s). This work is published and licensed by Dove Medical Press Limited. The
full terms of this license are available at https://www.dovepress.com/terms
and incorporate the Creative Commons Attribution
- Non Commercial (unported, 4.0) License.
By accessing the work you hereby accept the Terms. Non-commercial uses of the work are permitted
without any further permission from Dove Medical Press Limited, provided the work is properly
attributed. For permission for commercial use of this work, please see paragraphs 4.2 and 5 of our Terms.
© 2025 The Author(s). This work is published and licensed by Dove Medical Press Limited. The
full terms of this license are available at https://www.dovepress.com/terms
and incorporate the Creative Commons Attribution
- Non Commercial (unported, 4.0) License.
By accessing the work you hereby accept the Terms. Non-commercial uses of the work are permitted
without any further permission from Dove Medical Press Limited, provided the work is properly
attributed. For permission for commercial use of this work, please see paragraphs 4.2 and 5 of our Terms.