Back to Journals » Clinical Ophthalmology » Volume 16
Correlation Between Optical Coherence Tomography and Photopic Negative Response of Flash Electroretinography in Ganglion Cell Complex Assessment in Glaucoma Patients
Authors Awwad MH ![]() , Ossama Nada, Hamdi MM, El-Shazly AA, Elwan S
, Ossama Nada, Hamdi MM, El-Shazly AA, Elwan S
Received 30 December 2021
Accepted for publication 11 March 2022
Published 23 March 2022 Volume 2022:16 Pages 893—904
DOI https://doi.org/10.2147/OPTH.S356436
Checked for plagiarism Yes
Review by Single anonymous peer review
Peer reviewer comments 4
Editor who approved publication: Dr Scott Fraser
Mohammad Hasan Awwad, Ossama Nada, Momen Mahmoud Hamdi, Amany Abd El-Fattah El-Shazly, Sheriff Elwan
Ophthalmology Department, Faculty of Medicine, Ain Shams University, Cairo, Egypt
Correspondence: Mohammad Hasan Awwad, Misr Lel Tayaran St., New Nozha, Cairo, 11843, Egypt, Tel +201003604524, Email [email protected]
Purpose: To investigate the correlation between the photopic negative response (PhNR) of the light-adapted flash electroretinography (ERG) and measurements of standard automated perimetry (SAP) and optical coherence tomography (OCT) in assessment of retinal ganglion cells’ (RGCs) affection in glaucoma.
Patients and Methods: A cross-sectional study included 40 eyes of glaucoma patients and 40 eyes of age- and gender-matched normal subjects. Participants underwent a complete ophthalmologic assessment, SAP, OCT, and light-adapted flash ERG using the extended PhNR protocol of the International Society for Clinical Electrophysiology of Vision (ISCEV). Glaucomatous eyes were divided into 3 subgroups: mild (n = 15), moderate (n = 11) and severe glaucoma (n = 14) according to the mean deviation (MD) of SAP. Measurements of SAP, OCT and ERG parameters were analyzed, and correlations between PhNR measurements and other study measurements were evaluated.
Results: PhNR amplitudes and PhNR/b-wave ratios were significantly reduced in glaucoma cases compared to healthy controls, and they showed a significant and progressive decline across the three glaucoma subgroups (P < 0.05). An exception to this is PT (b-wave peak to PhNR trough) PhNR amplitude where its reduction was statistically non-significant when comparing between controls and mild glaucoma cases (P = 0.178), and between moderate and severe glaucoma cases (P = 0.714). PhNR amplitudes and PhNR/b-wave ratios correlated significantly with SAP and OCT parameters (P < 0.05).
Conclusion: PhNR correlates well with SAP and OCT parameters in glaucoma assessment. PhNR could be a valuable supplementary tool for objective assessment of the RGCs’ function in glaucoma.
Keywords: glaucoma, retinal ganglion cells, standard automated perimetry, optical coherence tomography, photopic negative response, electroretinography
Introduction
Glaucoma is a multifactorial disease that is characterized by progressive loss of retinal ganglion cells (RGCs) and subsequent visual field loss, where elevated intraocular pressure (IOP) is deemed its major risk factor.1 It typically progresses slowly and remains asymptomatic until an advanced stage. Early glaucoma detection is therefore challenging but is vitally important to preserve functional vision.2 The cornerstones of glaucoma diagnosis include detecting structural changes via slit lamp funduscopic examination, fundus stereophotographs and optical coherence tomography (OCT), and detecting functional changes using standard automated perimetry (SAP).3 Visual field testing using SAP aims at detecting functional changes in cases with suspected disease and monitoring disease progression in those with established glaucoma.4
Despite the widespread use of SAP, there are significant limitations to it. Presence of characteristic visual field defects can confirm the diagnosis, but as many as 30% to 50% of RGCs may be lost before any functional changes are detected with SAP.5 This phenomenon is due to the nature of the SAP testing parameters, where stimulus intensities are scaled by logarithmic transformation, so visual field changes are minimized at high decibel levels and amplified at low decibel levels, leading to significant RGC loss in early disease being translated into relatively small decreases in visual field function.6 In addition, SAP is subjective, so there can be marked variability on repeated testing, even in stable patients. Patients dislike the length and frequency of field testing, performance pressure, and difficulty in understanding testing instructions, and clinicians dislike the perceived non-objectivity in SAP as they must be reassured that testing progression is an authentic reflection of disease progression.7 Thus, there is an increasing interest in objective, quicker and repeatable imaging tests for glaucoma assessment.8
One of the objective means of glaucoma assessment is OCT, which can obtain high-resolution topographic images and measurements of the optic nerve head (ONH), peripapillary retinal nerve fiber layer (RNFL), and macular ganglion cell complex (GCC) for assessing glaucomatous damage.9 Electroretinography (ERG) is an objective method for assessing retinal function, contrary to SAP. The International Society for Clinical Electrophysiology of Vision (ISCEV) extended protocol describes an extension to the ERG Standard, namely the photopic negative response (PhNR) of the light-adapted flash ERG. The PhNR is a negative wave that follows the b-wave and is indicative of the function of RGCs and their axons.10 The PhNR is a sensitive marker which can be reduced with RGC dysfunction that occurs in glaucoma as well as other forms of optic neuropathy and other conditions affecting the inner retinal layers.11 Our study aimed to investigate the correlation between the PhNR and measurements of SAP and OCT in the assessment of RGCs’ affection in glaucoma.
Patients and Methods
This is a cross-sectional study that was conducted at the Ophthalmology Department, Ain Shams University Hospitals (Cairo, Egypt). Study subjects were selected from patients attending the ophthalmology outpatient clinics during the recruitment period, which took place between March 2019 and October 2021. The study adhered to the Tenets of the Declaration of Helsinki and was approved by the Ethical Committee of Ain Shams University. Informed consent was obtained from all participants for enrollment in the study after a full explanation of the nature of the testing procedures.
A consecutive sample of glaucoma cases (study group) and age- and gender-matched normal subjects (control group) were enrolled in the study. Adult (> 18 years old) diagnosed glaucoma patients (including Primary open angle glaucoma, Normal tension glaucoma and Pseudoexfoliation glaucoma) with clear optical media (cornea, crystalline lens and vitreous) were included in the study. Diagnosis was based on clinical examination which revealed characteristic glaucomatous optic disc changes (ISNT rule not followed, focal and/or diffuse thinning of neuroretinal rim, increased vertical cup/disc (C/D) ratio, and/or inter-eye asymmetry of ≥ 0.2 in the vertical C/D ratio with similar disc size), visual field examination and OCT evaluation of the ONH, peripapillary RNFL and macular GCC. Exclusion criteria included subjects with acute glaucomas or at risk of acute angle closure glaucoma with pupil dilatation (eg, shallow anterior chamber with narrow angle), secondary glaucomas, myopic and hyperopic refractive errors of spherical equivalent < −6 D and > +4 D respectively, best corrected visual acuity (BCVA) worse than 6/60, neurological diseases causing visual field defects, diabetes mellitus, posterior segment diseases and history of previous intraocular surgeries or retinal laser procedures.
Study participants were subjected to complete history taking and a comprehensive ophthalmologic examination, including refraction, BCVA assessment using the Landolt C visual acuity chart and conversion to logarithm of the minimum angle of resolution (LogMAR) notation, slit lamp biomicroscopy for anterior segment examination as well as for stereoscopic posterior segment examination using a + 90 D lens, and IOP measurement using Goldmann applanation tonometry. Study participants then underwent SAP using Humphrey Field Analyzer (Carl Zeiss Meditec Inc., Dublin, California, USA), OCT using Nidek RS-3000 Advance Capture spectral domain OCT (Nidek Inc., Gamagori, Aichi, Japan) and Light-adapted Flash Electroretinography (ISCEV PhNR protocol) using the Roland Consult RETIport/scan 21 (Brandenburg, Germany). Glaucoma cases were treated with topical hypotensive medications, either as a monotherapy or as a drug combination, such as prostaglandin analogues, beta-blockers, alpha-2 agonists, and carbonic anhydrase inhibitors.
Standard Automated Perimetry
We used the 24–2 Swedish interactive thresholding algorithm (SITA) Standard testing strategy with a stimulus of Goldman size III and a background luminance of 31.5 Apostilbs.12 The subject was given at least 5 minutes to adjust to the dimmed ambient lighting conditions, and the subject’s proper fixation and alignment were monitored throughout the test. If the visual field result was flagged as unreliable (according to the manufacturer’s guidelines13 of fixation losses >20% or false positive errors >15%), it was excluded from the analysis and subjects were encouraged to repeat the visual field assessment for that eye once again.
The measurable parameters recorded by the test included the mean deviation (MD), pattern standard deviation (PSD) and visual field index (VFI). Glaucomatous visual field defects were identified when (on two consecutive visual field examinations) the pattern deviation plot showed a cluster of ≥ 3 non-edge points that had sensitivities less than that of the lower 95% centile ranges (P < 0.05) with at least one less than the lower 99% centile range (P < 0.01), the PSD value was less than the lower 95% centile range (P < 0.05), or the Glaucoma Hemifield Test was outside the normal limits. Glaucomatous eyes were divided according to the MD into 3 subgroups: mild (MD > −6 dB), moderate (MD ≤ −6 dB and > −12 dB) and severe glaucoma (MD ≤ −12 dB).14
Optical Coherence Tomography
Study subjects’ pupils were dilated with 1% tropicamide eye drops (Mydriacyl, Alcon) prior to the OCT testing to increase the signal strength. Only reliable results (signal strength index ≥ 7/10 with no evident artifacts) were included in the analysis. For peripapillary RNFL and macular GCC imaging, raster scanning over a 6×6 mm2 area centered on the optic disc center (Disc Map protocol) and over a 9×9 mm2 area centered on the foveal center (Macula Map protocol), respectively, were conducted at a scan density of 512 A-scans × 128 B-scans. Peripapillary RNFL thickness was measured using a 3.45-mm-diameter circle automatically positioned around the optic disc, and GCC thickness was automatically measured between the internal limiting membrane and the outer boundary of the inner plexiform layer. We analyzed the average RNFL thickness in the entire 360° around the optic nerve head and the average GCC thickness of the whole 360° around the foveal center since the full field PhNR is supposed to reflect the function of RGCs throughout the ocular fundus. Other evaluated parameters included C/D ratio (horizontal and vertical), minimum rim/disc (R/D) ratio, disc area and cup area.15
Photopic Flash Electroretinography
The subject preparation and electrode application were as described in the ISCEV Standard for full-field photopic ERG.16 The subjects’ pupils were adequately dilated (approximately 8 mm in diameter) with 1% tropicamide eye drops (Mydriacyl, Alcon), and they were light adapted for 10 minutes if they were dark adapted for other testing prior to photopic ERG recording. A drop of Benoxinate hydrochloride 0.4% was used as a topical anesthetic agent before placing the recording electrodes. HK loop electrodes that contact the inferior conjunctival fornix and bulbar conjunctiva were used as active electrodes. Copper electrodes placed on the skin near each orbital rim, temporal to the corresponding eye, were used as reference electrodes. The skin was prepared by cleaning, and a suitable conductive gel applied to ensure good electrical connections. Good contact, consistent positioning and acceptable impedance (< 10 KOhm) of both active and reference electrodes were ensured. Another copper electrode was attached to the center of the patient’s forehead (ground electrode).
The testing was done according to ISCEV extended protocol for PhNR of the full-field ERG.10 The stimulus and background lights were produced by light emitting diodes (LED). A brief (4 ms) red LED flash (640 nm) at an intensity of 2 photopic candela seconds per meter squared (phot cd s m−2) on a rod saturating blue LED background (450 nm) at an intensity of 10 photopic candela per meter squared (phot cd m−2) was used. The inter-flash interval was 1 second. As for the recording bandwidth, the low- and high-frequency filters were set at 0.3 Hz and 300 Hz, respectively.
Patients were instructed to maintain a stable gaze at the center of the stimulus (the red flash) and were monitored via an infrared video camera in the stimulus dome to assess compliance and correct visual fixation. Because any deflection of the baseline by blinking strongly affected the shape of the PhNR, we discarded recordings with baseline deflections. An average of 3 repeated recordings for each eye was analyzed, and for each recording, 20 trials were used as sufficient repetitions to provide good signal-to-noise ratio (signal averaging). The total time of attendance was between 5 and 15 minutes for each subject. No follow-up visits were required; all recordings were made during a single session.
The amplitude of the a-wave was measured from the baseline to the minimum point in the trough of the a-wave, and that of the b-wave was measured from the trough of the a-wave to the peak of the b-wave. The PhNR amplitude was measured from the baseline to the maximum amplitude in the trough of the negative wave following the positive i-wave which comes after the b-wave (BT), and also measured from the peak of the b-wave to the maximum amplitude in the same trough (PT). Reporting of ERG results included measurements (latency and amplitude) of the a-wave, b-wave, PhNR (BT and PT) as well as a computation of the PhNR/b-wave ratios (BT/b and PT/b).
Statistical Analysis
Data analysis was done using Statistical Package for Social Sciences (SPSS) (version 28.0, IBM Corp., Armonk, NY, USA) as follows: Data normality assumption was tested with the Kolmogorov–Smirnov Test. Descriptive statistics of quantitative variables were presented as mean and standard deviation (SD) for normally distributed variables, and median and inter-quartile range (IQR) for non-normally distributed variables. Multiple groups of non-parametric data sets (p < 0.5) were compared using the Mann–Whitney U-test, while parametric data sets (p > 0.5) were compared using analysis of variance (ANOVA) and Tukey’s honestly significant difference Post-Hoc analysis for independent samples. The correlations were statistically calculated using Pearson’s correlation analysis in parametric data, and Spearman correlation analysis in non-parametric data. In all statistical analyses, P value < 0.05 was considered statistically significant.
Results
The final analysis of our study included 40 eyes of 25 glaucoma patients and 40 eyes of 23 healthy controls with age ranges from 20 to 68 years old and 23 to 67 years old, respectively. Gender distribution was identical in both groups, where they both had a male/female ratio of 23/17 (P = 1.00). Mild, moderate and severe glaucoma subgroups included 15, 11 and 14 eyes, respectively.
There was no significant difference in age or spherical equivalent between both groups. BCVA (LogMAR), MD, VFI, R/D ratio, peripapillary RNFL thickness and macular GCC thickness were significantly lower, while IOP, C/D ratio, PSD, horizontal and vertical C/D ratios (OCT measurements), and cup area were significantly higher in the study group than the control group (Table 1).
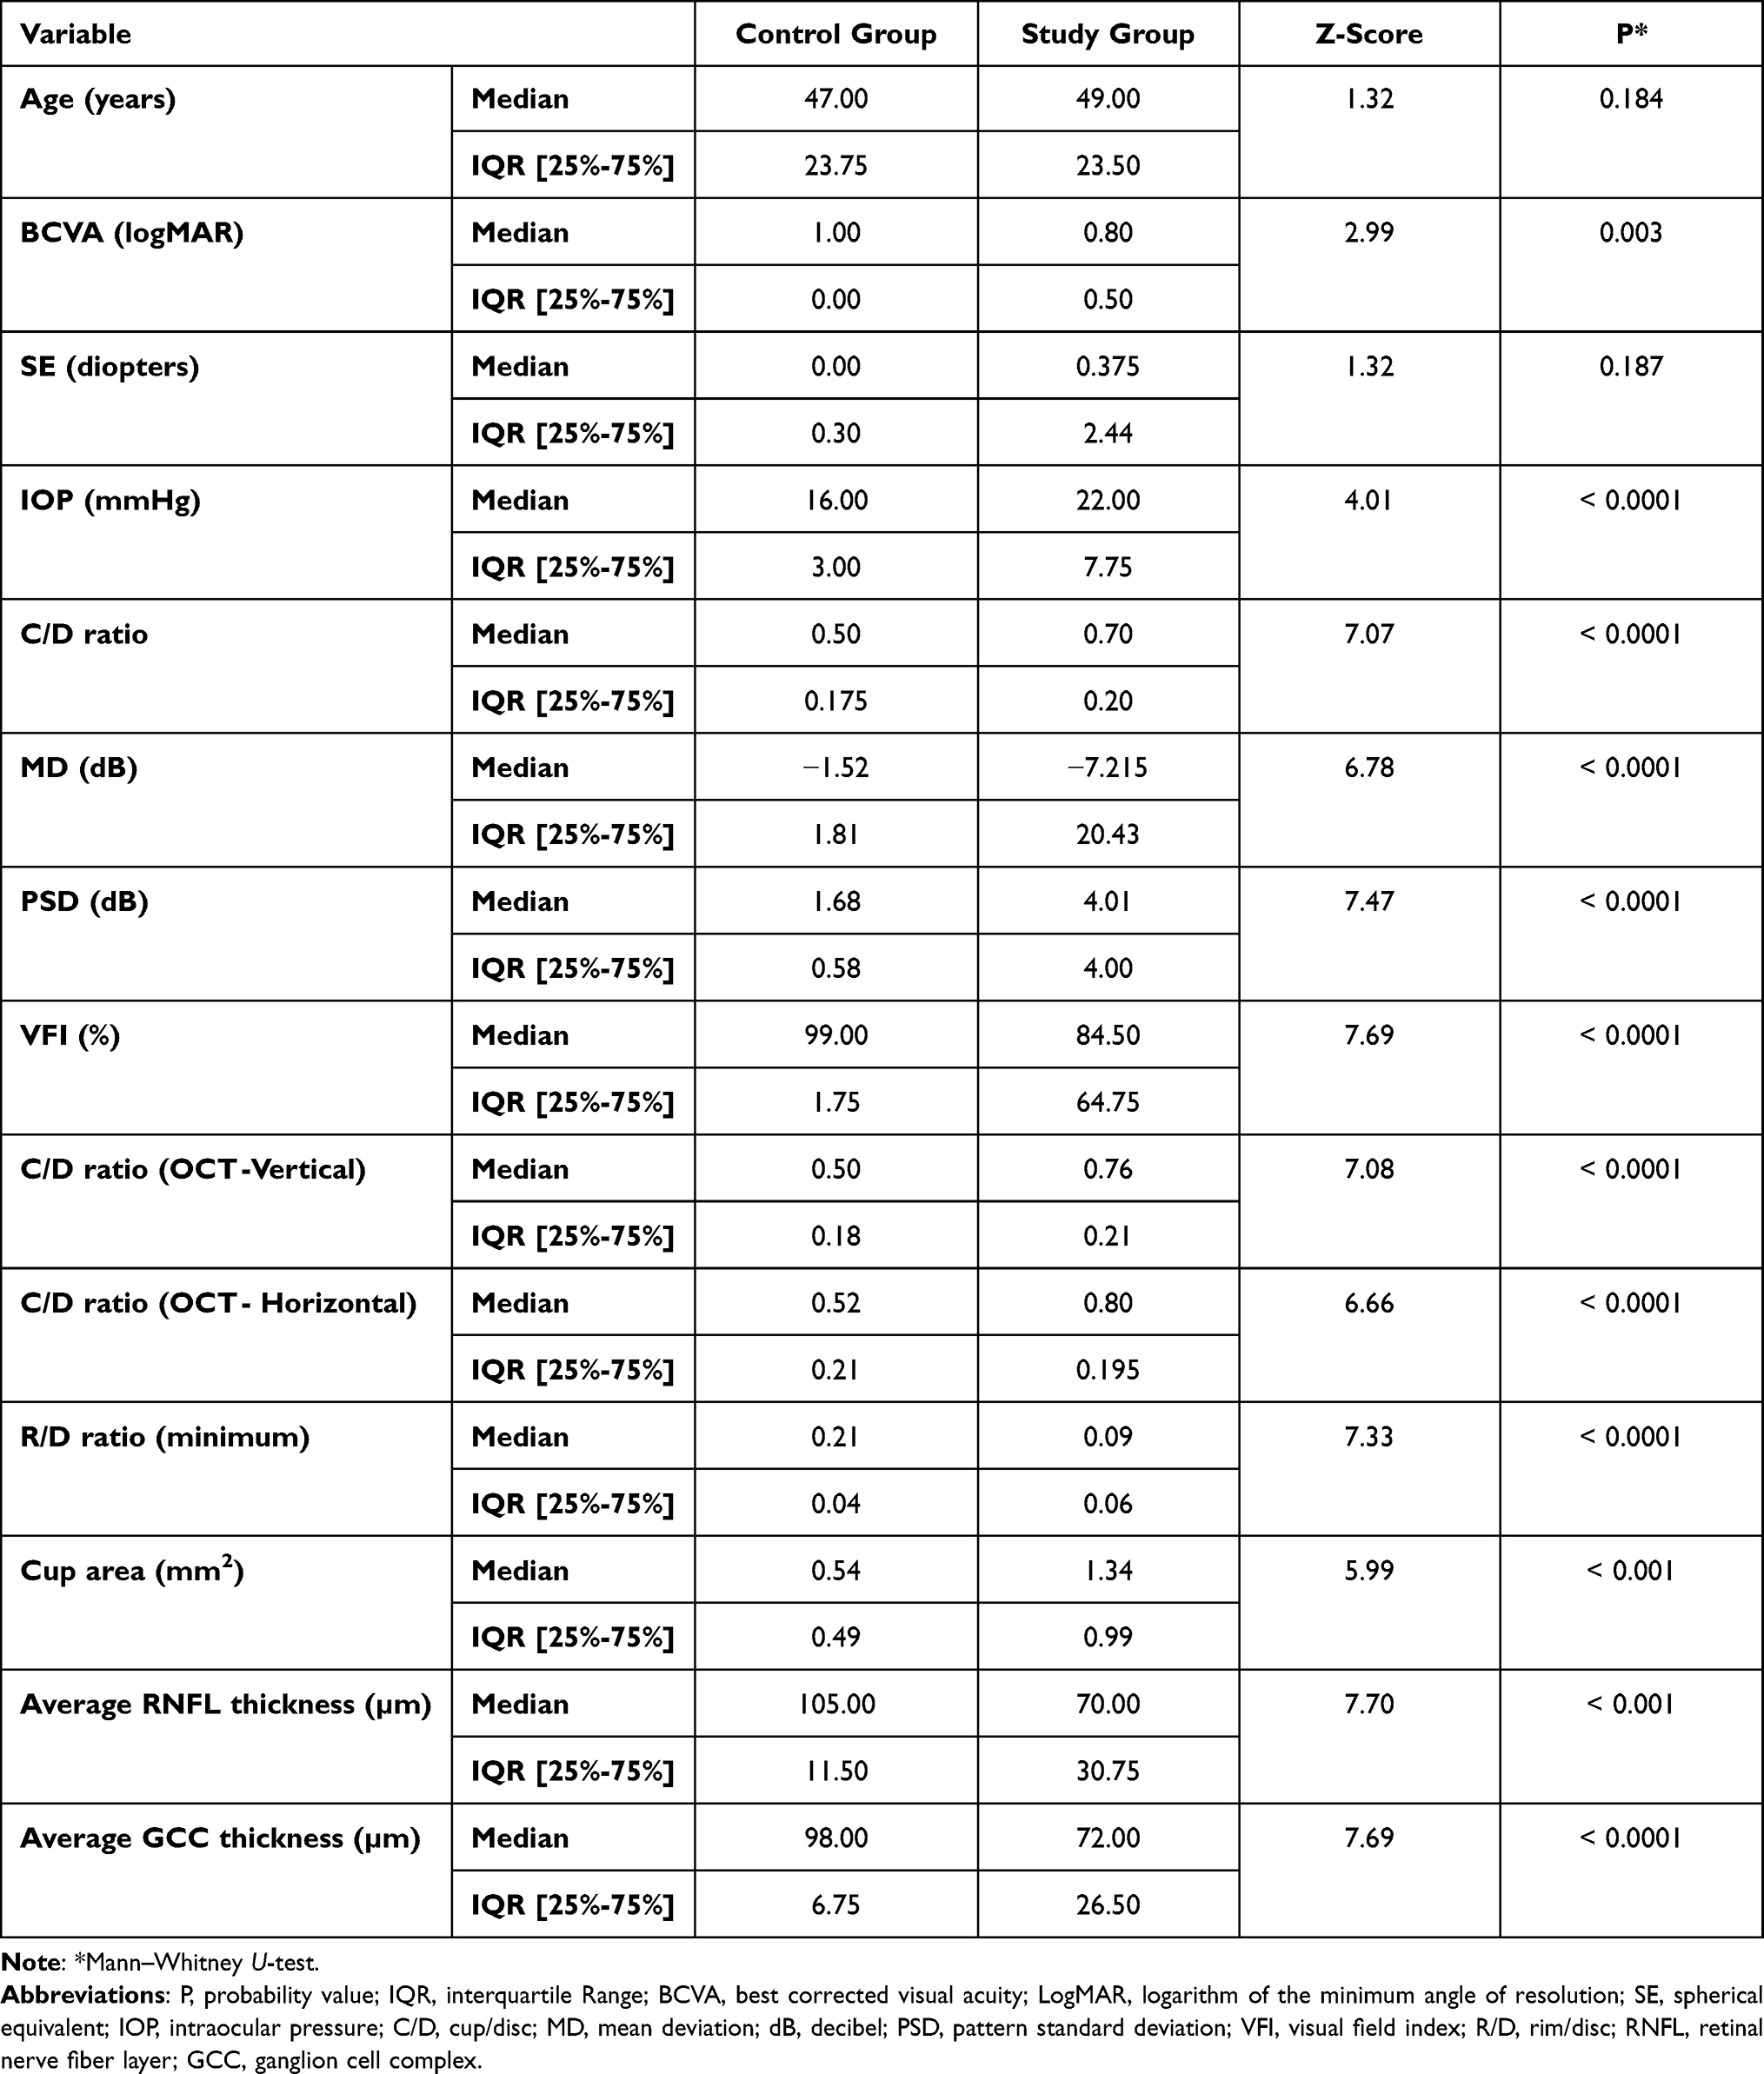 |
Table 1 Age, Clinical Characteristics, SAP Parameters and OCT Parameters in Both Groups |
Tables 2 and 3 outline the difference in values of ERG parameters between the study and control groups, and among the different glaucoma subgroups.
 |
Table 2 Photopic ERG Parameters in Both Groups |
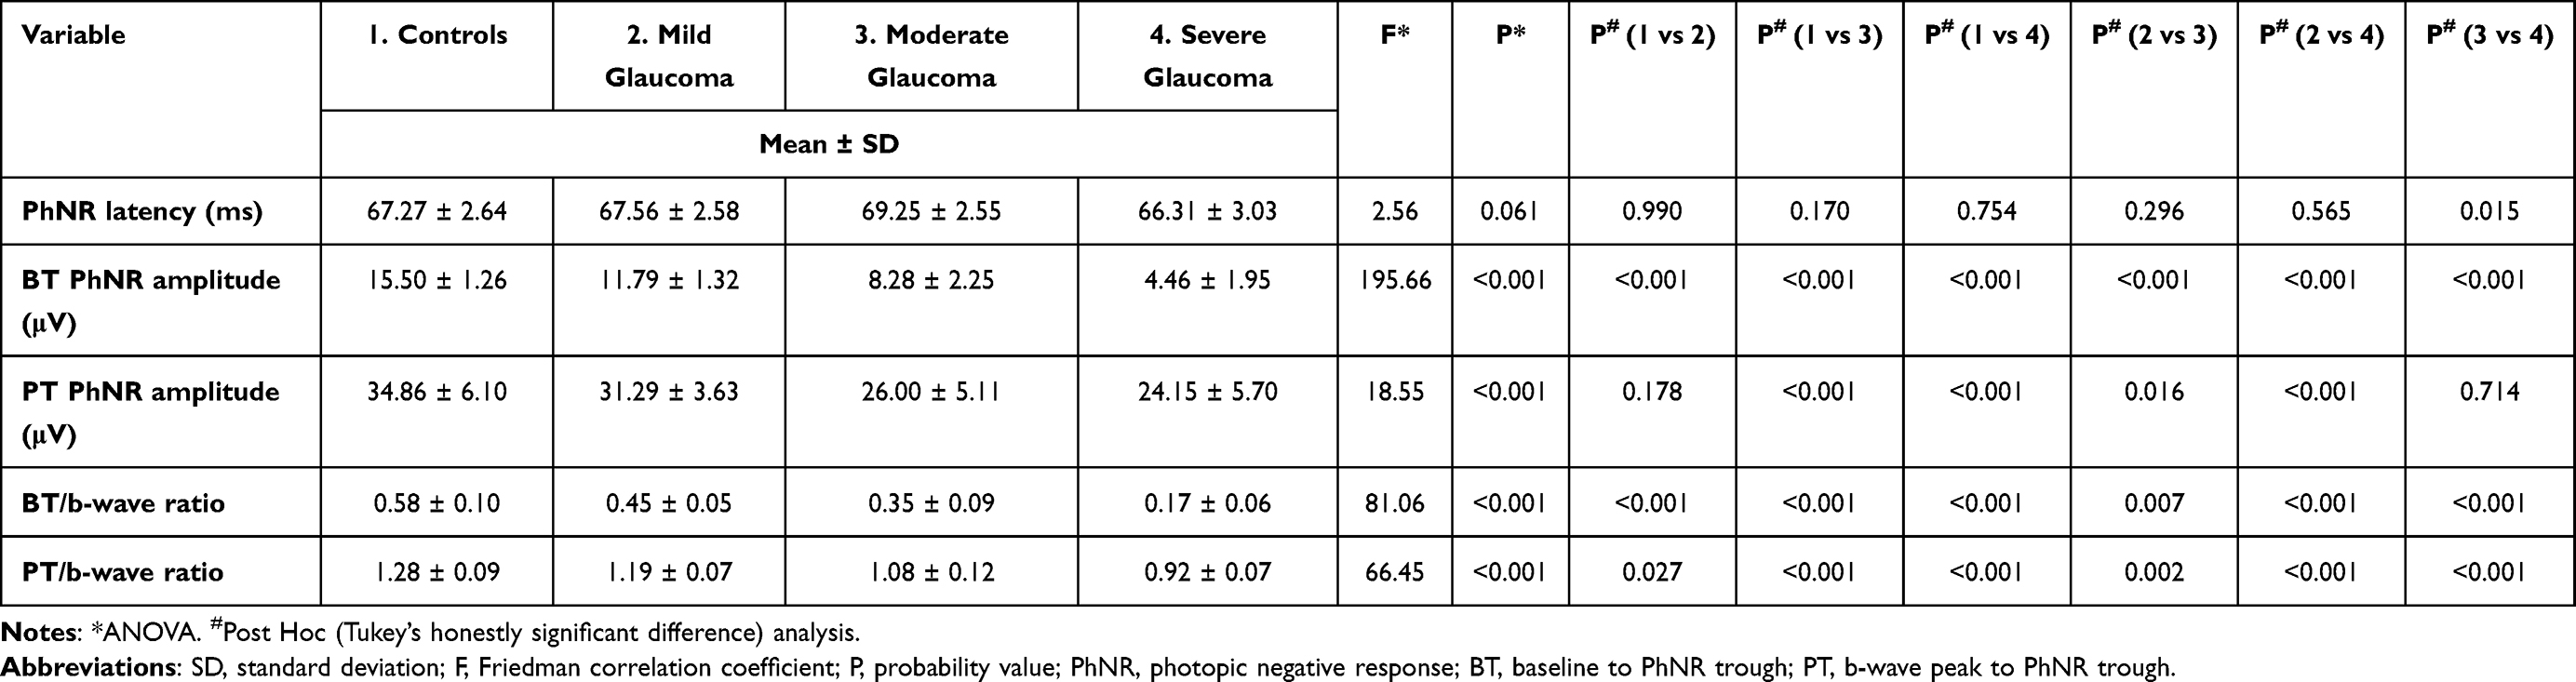 |
Table 3 PhNR Measurements Among the Control Group and the Three Glaucoma Subgroups |
b-wave latency and amplitude showed no significant difference between both groups, unlike a-wave latency and amplitude which were significantly lower in the study group than the control group.
PhNR latency showed no significant difference between both groups, and it was only significantly reduced in the severe glaucoma subgroup when compared to the moderate glaucoma subgroup.
PhNR amplitudes (BT and PT) were significantly lower in the study group than the control group, and significantly and progressively lower with increasing glaucoma severity across the three glaucoma subgroups, except for PT PhNR amplitude where its reduction was statistically non-significant when comparing the control group with the mild glaucoma subgroup, and also when comparing the moderate glaucoma subgroup with the severe glaucoma subgroup.
PhNR/b-wave ratios (BT/b and PT/b) were also significantly lower in the study group than the control group, and significantly and progressively lower with increasing glaucoma severity across the three glaucoma subgroups.
Representative PhNR waveforms from normal and glaucomatous eyes with their latency and BT amplitude values are shown in Figure 1.
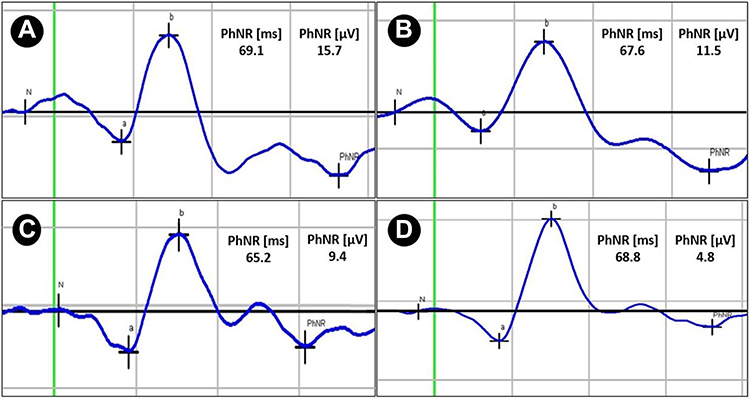 |
Figure 1 Photopic electroretinograms with measurements (latency and BT amplitude) of PhNR in (A) a control, (B) a mild glaucoma case, (C) a moderate glaucoma case and (D) a severe glaucoma case. |
PhNR latency showed no significant correlation with age or any of our study parameters. PhNR amplitudes (BT and PT) and PhNR/b-wave ratios (BT/b and PT/b) showed no significant correlation with age, but they showed a significant negative correlation with C/D ratio (vertical and horizontal) and PSD, and showed a significant positive correlation with MD, VFI, R/D ratio, average peripapillary RNFL thickness and average macular GCC thickness (Table 4). Correlation plots between PhNR parameters and MD, RNFL thickness and GCC thickness are shown in Figure 2.
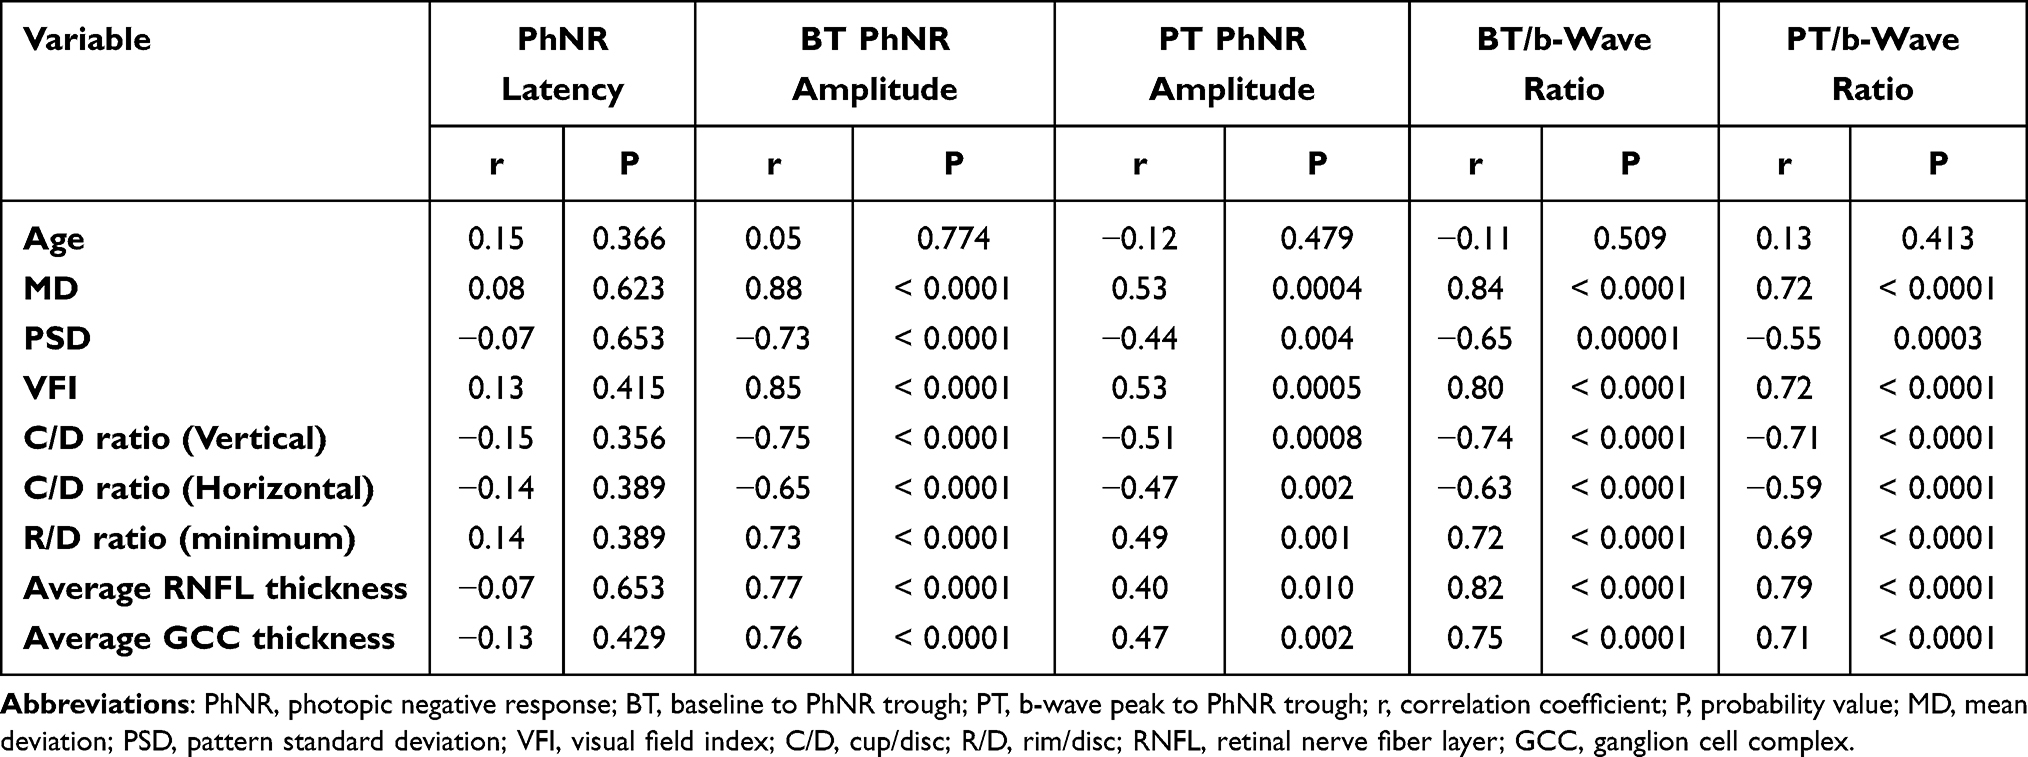 |
Table 4 Correlation of PhNR Measurements with Age, SAP Parameters and OCT Parameters in the Study Group |
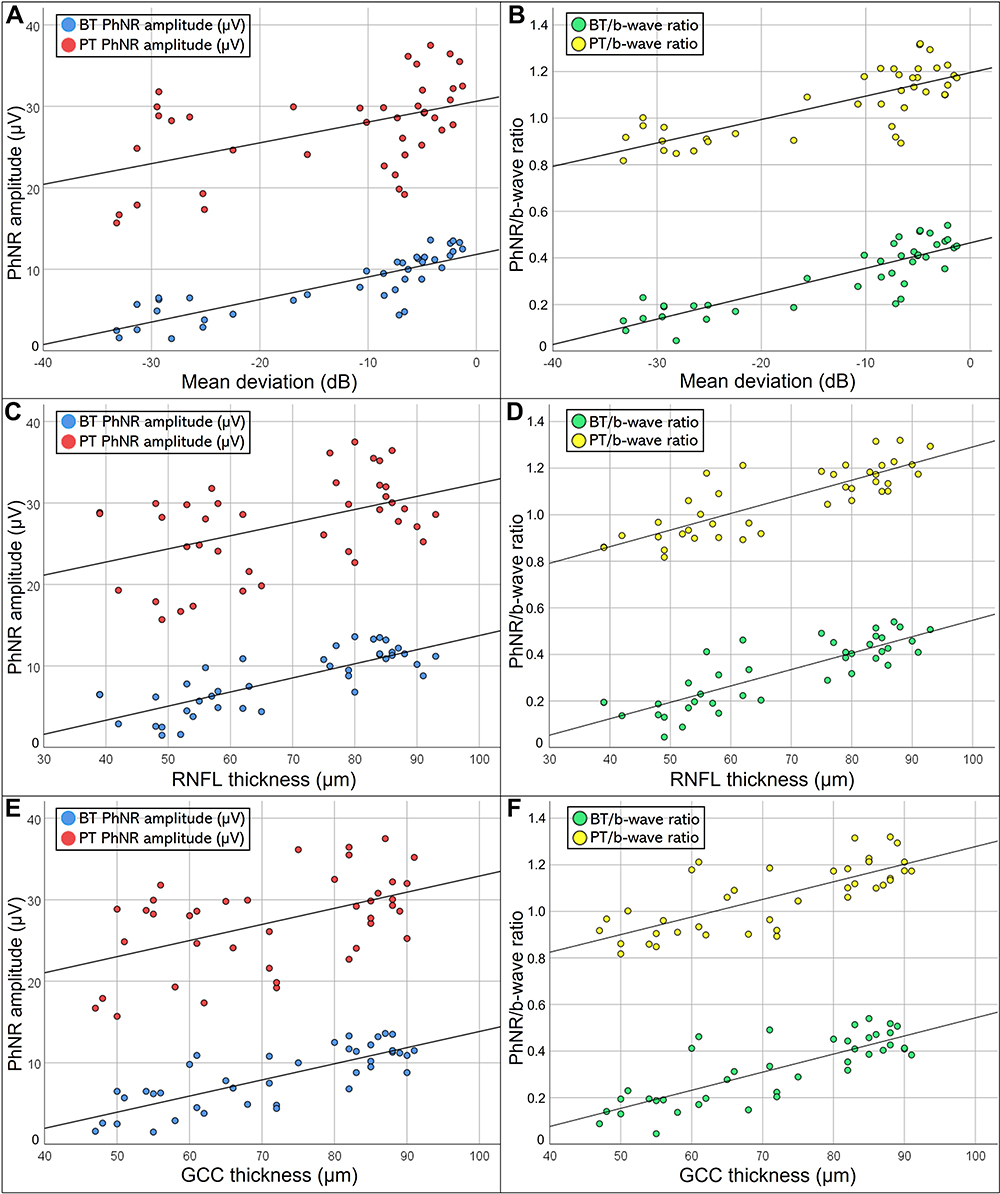 |
Figure 2 Scatter plots showing the correlation of PhNR measurements with (A and B) Mean deviation, (C and D) RNFL thickness and (E and F) GCC thickness in the study group. |
Discussion
In our study, we evaluated the PhNR values in both glaucomatous and normal eyes, and we investigated the correlation between PhNR and measurements of SAP and OCT in the assessment of RGCs’ affection in glaucoma. They seemed to correlate well with each other in glaucoma cases in our study group.
There is no clear explanation for the significant difference in a-wave amplitude between both groups. Rangaswamy et al17 have reported similar results (P = 0.0002) in patients with anterior ischemic optic neuropathy. Retrograde photoreceptor degeneration from RGCs through bipolar cells cannot explain our results, since there was no significant difference in b-wave amplitudes between both groups, probably because bipolar cells were not affected by glaucoma. The small sample size of this study makes it difficult to conclude that a-wave amplitude is reduced in glaucoma.
PhNR latency showed no significant difference between both groups as already known according to Viswanathan et al.18 This confirms that the neuronal alterations due to glaucoma affect the PhNR amplitude, leaving the latency relatively unchanged.11 On the other hand, BT PhNR amplitude and BT/b-wave ratio were significantly lower in the study group than the control group. These findings show the compatibility of our results with those of previously published studies that measured full field and focal PhNR values.18–26 Also, Preiser et al27 recorded PhNR and pattern electroretinography (PERG) in manifest and preperimetric glaucoma eyes, and found a significant reduction in PhNR amplitude (P = 0.0018), PhNR/b-wave ratio (P < 0.01), PERG amplitude and ratio (both P < 0.01) in manifest glaucoma cases when compared to healthy controls. On the other hand, a study by Cursiefen et al28 included severe glaucoma cases and showed a non-significant reduction of PhNR amplitude in cases compared to controls. This disagreement is probably attributed to other types of perimeter (Octopus) and electrodes (Henkes contact lens electrodes) used by them, as well as to the characteristics of the stimulus they have used to record PhNR (a white flash on a white background instead of a red flash on a blue background).
Our study also confirmed that BT PhNR amplitude and BT/b-wave ratio were significantly reduced in all three glaucoma subgroups when compared to healthy controls, in agreement with results of Nakamura et al and Kirkiewicz et al21,26 However, contrary to their findings, our study revealed that they were also significantly and progressively lower with increasing glaucoma severity. These discrepancies could be attributed to their larger sample sizes and to different electrode types used by them (DTL electrodes and Burian-Allen bipolar contact lens electrodes, respectively). In addition, Nakamura et al26 used a different ERG recording system (Neuropack MEB-2204), measured focal PhNR by eliciting focal ERGs, which is a different testing modality from our study, and they stated that although there was a progressive decline in the focal PhNR amplitude as the visual field results worsened, the measurement noise in PhNR recording may have led to the non-significance of their findings. Kaneko et al29 studied multifocal ERG in glaucoma patients using a stimulus centered on the fovea, with resulting waveforms consisting of a negative wave (N1) followed by a positive wave (P1) and another slow negative wave (N2), and found that the N2 amplitude (expressed as response density) and N2/P1 ratio recorded from the center of the stimulus area were significantly lower in all glaucoma stages compared to healthy controls (early glaucoma: p <0.01, intermediate and advanced glaucoma: p <0.00001) as well as with increasing glaucoma severity (P <0.0001). According to their results, they concluded that N2 wave corresponds to the PhNR of focal macular ERGs and represents the RGC activity of the corresponding retinal areas.
PhNR latency showed no significant correlation with age or other parameters in the study group, while Viswanathan et al18 found an increase in PhNR latency of about 8 ms with increasing age when comparing subjects in their third decade with subjects in their eighth decade of age (P < 0.005). This contradiction may be attributed to the lower overall age of subjects in our study and to the different electrode types (DTL electrodes) used by them. PhNR amplitudes did not show a significant correlation with age of our study subjects. Viswanathan et al18 showed a shallow decline in PhNR amplitude with age but the correlation was not statistically significant (P < 0.07).
PhNR amplitudes and PhNR/b-wave ratios showed a statistically significant correlation with SAP and OCT parameters in the study group. These results are consistent with previous studies which analyzed the correlation of BT PhNR amplitude and BT/b-wave ratio with SAP and OCT parameters.18,19,21–23 Viswanathan et al18 were the first to show that the PhNR amplitude correlated significantly (P < 0.05) with MD, corrected PSD and vertical C/D ratio. A study by Cvenkel et al19 showed that PhNR amplitude correlated significantly (P < 0.05) with peripapillary RNFL thickness in early glaucoma cases. However, their study did not include more advanced glaucoma stages. Machida et al23 found out that the decrease in PhNR amplitude and PhNR/b-wave ratio correlated significantly (P < 0.001) with the decrease in MD, RNFL thickness and R/D ratio, and with the increase in C/D ratio. The results of Shen et al20 also showed that the reduction of the PhNR amplitude correlated significantly (P < 0.05) with the decrease in the MD and average RNFL thickness. Kirkiewicz et al21 showed that PhNR amplitude and PhNR/b-wave correlated significantly (P < 0.05) with MD, however, they used the nerve fiber index (NFI) obtained from scanning laser polarimetry as a structural parameter in their study and found a significant correlation (P < 0.05) between them as well. Hara et al22 elicited PhNR using both red/blue stimuli and white/white stimuli, and found that PhNR amplitude correlated significantly (P <0.0005) with MD and peripapillary RNFL, and the correlation coefficients were generally better for the PhNR elicited by the red/blue stimuli than for the white/white stimuli. Our findings also agreed with the results of other studies that measured focal PhNR responses from local retinal areas.25,26,30 Tamada et al25 found that focal PhNR amplitudes and PhNR/b-wave ratios correlated significantly (P < 0.0001) with RNFL thickness in the corresponding sectors as well as with optic disc rim area and C/D ratio. Moreover, Nakamura et al26 and Machida et al30 concluded that focal PhNR amplitudes correlated significantly (P < 0.05) with GCC thickness in the corresponding macular areas. Kaneko et al29 found that the N2 wave response density in the center of stimulus area in multifocal electroretinograms was significantly correlated with the GCC thickness (p <0.0001) and mean SAP-determined sensitivity (p <0.0001) of the central retinal areas.
We have also outlined the results of the same analyses regarding PT PhNR amplitude and PT/b-wave ratio. It’s worth noting that the PT measurement is largely dominated by the b wave amplitude, which should be considered when interpreting a change in PhNR amplitude.10 This implies that BT amplitude is more indicative of RGC function in glaucoma than PT amplitude, which also includes the activity of bipolar cells.11 However, there was no significant difference in b-wave amplitudes among our study groups, strengthening the reliability of PT measurements in our study.
To the best of our knowledge, previous studies on the PhNR in glaucoma have neither yet explored the difference in PT PhNR amplitude and PT/b-wave ratio between glaucomatous and healthy eyes or between different glaucoma stages, nor have they investigated the correlation of PhNR latency, PT PhNR amplitude and PT/b-wave ratio with SAP and OCT parameters in glaucoma cases.
Our study had a number of limitations. First, the small sample size from a single center makes it difficult to draw a strong conclusion. Inclusion of both eyes in many of our subjects may confound our results. Also, there was no follow up of the study subjects. A prospective cohort study is needed to investigate the ability of PhNR to monitor progression of the disease over time and to assess its reliability in providing repeatable and reproducible results on separate occasions of PhNR recording. A disadvantage of the full field PhNR is that it reflects the function of RGCs receiving signals from cones throughout the ocular fundus and could miss early glaucomatous damage which usually begins in the paracentral field. Focal PhNR testing of the perifoveal and parafoveal areas may improve the detection of early PhNR reduction in mild glaucoma cases and its correlation with early changes in SAP and OCT.26,30
Conclusion
The results of this study confirm the value of PhNR in glaucoma assessment, and represent clinical evidence of the significant correlation that exists between the structural and the functional aspects of the RGCs and their axons. In conclusion, PhNR analysis could be a valuable supplementary tool for objective assessment of the RGCs’ function in glaucoma. Correlating its results with the reports of routine examinations can be helpful in the differential diagnosis of suspicious cases.
Abbreviations
RGC, retinal ganglion cell; IOP, intraocular pressure; OCT, optical coherence tomography; SAP, standard automated perimetry; ONH, optic nerve head; RNFL, retinal nerve fiber layer; GCC, ganglion cell complex; ERG, electroretinography; ISCEV, International Society for Clinical Electrophysiology of Vision; PhNR, photopic negative response; BCVA, best corrected visual acuity; LogMAR, logarithm of the minimum angle of resolution; SITA, Swedish interactive thresholding algorithm; MD, mean deviation; PSD, pattern standard deviation; VFI, visual field index; C/D, cup/disc; R/D, rim/disc; LED, light emitting diode; BT, baseline to PhNR trough; PT, peak of b wave to PhNR trough; SPSS, Statistical Package for Social Sciences; SD, standard deviation; IQR, interquartile range; ANOVA, analysis of variance; PERG, pattern electroretinography.
Disclosure
Prof. Dr. Sheriff Elwan reports non-financial support from Ecco/Marcyrl, non-financial support from Minapharm, personal fees from Minapharm, personal fees from Ecco/Marcyrl, non-financial support from Aljazeera university, Mogadishu, Somalia, non-financial support from West African Institute of Ophthalmology, Bamako, Mali, non-financial support from Egyptian ministry of foreign affairs, outside the submitted work. The authors report no other conflicts of interest in this work.
References
1. Agarwal R, Gupta S, Agarwal P, Saxena R, Agrawal S. Current concepts in the pathophysiology of glaucoma. Indian J Ophthalmol. 2009;57(4):257.
2. Lucy KA, Wollstein G. Structural and Functional Evaluations for the Early Detection of Glaucoma. Expert Rev Ophthalmol. 2016;11(5):367–376.
3. Denniss J, Turpin A, Mckendrick AM. Relating optical coherence tomography to visual fields in glaucoma: structure–function mapping, limitations and future applications. Clin Exp Optom. 2019;102(3):291–299.
4. Fidalgo BMR, Crabb DP, Lawrenson JG. Methodology and reporting of diagnostic accuracy studies of automated perimetry in glaucoma: evaluation using a standardised approach. Ophthalmic Physiol Opt. 2015;35(3):315–323.
5. Harwerth RS, Wheat JL, Fredette MJ, Anderson DR. Linking structure and function in glaucoma. Prog Retin Eye Res. 2010;29(4):249–271.
6. Medeiros FA, Zangwill LM, Bowd C, Mansouri K, Weinreb RN. The Structure and Function Relationship in Glaucoma: implications for Detection of Progression and Measurement of Rates of Change. Investig Opthalmology Vis Sci. 2012;53(11):6939.
7. Camp AS, Weinreb RN. Will Perimetry Be Performed to Monitor Glaucoma in 2025? Ophthalmology. 2017;124(12):S71–S75.
8. Phu J, Khuu SK, Yapp M, Assaad N, Hennessy MP, Kalloniatis M. The value of visual field testing in the era of advanced imaging: clinical and psychophysical perspectives. Clin Exp Optom. 2017;100(4):313–332.
9. Tatham AJ, Medeiros FA. Detecting Structural Progression in Glaucoma with Optical Coherence Tomography. Ophthalmology. 2017;124(12):S57–S65.
10. Frishman L, Sustar M, Kremers J, et al. ISCEV extended protocol for the photopic negative response (PhNR) of the full-field electroretinogram. Doc Ophthalmol. 2018;136(3):207–211.
11. Prencipe M, Perossini T, Brancoli G, Perossini M. The photopic negative response (PhNR): measurement approaches and utility in glaucoma. Int Ophthalmol. 2020;40(12):3565–3576.
12. Bourne RRA, Jahanbakhsh K, Boden C, et al. Reproducibility of visual field end point criteria for standard automated perimetry, full-threshold, and Swedish interactive thresholding algorithm strategies: diagnostic innovations in glaucoma study. Am J Ophthalmol. 2007;144(6):908–913.
13. Heijl A, Patella VM, Bengtsson B. The Field Analyzer Primer: Effective Perimetry.
14. Brusini P, Johnson CA. Staging Functional Damage in Glaucoma: review of Different Classification Methods. Surv Ophthalmol. 2007;52(2):156–179.
15. Kita Y, Hollό G, Kita R, Horie D, Inoue M, Hirakata A. Differences of Intrasession Reproducibility of Circumpapillary Total Retinal Thickness and Circumpapillary Retinal Nerve Fiber Layer Thickness Measurements Made with the RS-3000 Optical Coherence Tomograph. PLoS One. 2015;10(12):e0144721.
16. McCulloch DL, Marmor MF, Brigell MG, et al. ISCEV Standard for full-field clinical electroretinography (2015 update). Doc Ophthalmol. 2015;130(1):1–12.
17. Rangaswamy NV, Frishman LJ, Dorotheo EU, Schiffman JS, Bahrani HM, Tang RA. Photopic ERGs in patients with optic neuropathies: comparison with primate ERGs after pharmacologic blockade of inner retina. Invest Ophthalmol Vis Sci. 2004;45(10):3827–3837.
18. Viswanathan S, Frishman LJ, Robson JG, Walters JW. The photopic negative response of the flash electroretinogram in primary open angle glaucoma. Invest Ophthalmol Vis Sci. 2001;42(2):514–522.
19. Cvenkel B, Sustar M, Perovšek D. Ganglion cell loss in early glaucoma, as assessed by photopic negative response, pattern electroretinogram, and spectral-domain optical coherence tomography. Doc Ophthalmol. 2017;135(1):17–28.
20. Shen X, Huang L, Fan N, He J. Relationship among Photopic Negative Response, Retinal Nerve Fiber Layer Thickness, and Visual Field between Normal and POAG Eyes. ISRN Ophthalmol. 2013;2013:1–6.
21. Kirkiewicz M, Lubiński W, Penkala K. Photopic negative response of full-field electroretinography in patients with different stages of glaucomatous optic neuropathy. Doc Ophthalmol. 2016;132(1):57–65.
22. Hara Y, Machida S, Ebihara S, Ishizuka M, Tada A, Nishimura T. Comparisons of photopic negative responses elicited by different conditions from glaucomatous eyes. Jpn J Ophthalmol. 2020;64(2):114–126.
23. Machida S, Gotoh Y, Toba Y, Ohtaki A, Kaneko M, Kurosaka D. Correlation between photopic negative response and retinal nerve fiber layer thickness and optic disc topography in glaucomatous eyes. Invest Ophthalmol Vis Sci. 2008;49(5):2201–2207.
24. Machida S, Toba Y, Ohtaki A, Gotoh Y, Kaneko M, Kurosaka D. Photopic negative response of focal electoretinograms in glaucomatous eyes. Invest Ophthalmol Vis Sci. 2008;49(12):5636–5644.
25. Tamada K, MacHida S, Oikawa T, Miyamoto H, Nishimura T, Kurosaka D. Correlation between photopic negative response of focal electroretinograms and local loss of retinal neurons in glaucoma. Curr Eye Res. 2010;35(2):155–164.
26. Nakamura H, Hangai M, Mori S, Hirose F, Yoshimura N. Hemispherical focal macular photopic negative response and macular inner retinal thickness in open-angle glaucoma. Am J Ophthalmol. 2011;151(3):7645.
27. Preiser D, Lagrèze WA, Bach M, Poloschek CM. Photopic negative response versus pattern electroretinogram in early glaucoma. Invest Ophthalmol Vis Sci. 2013;54(2):1182–1191.
28. Cursiefen C, Korth M, Horn FK. The negative response of the flash electroretinogram in glaucoma. Doc Ophthalmol. 2001;103(1):1–12.
29. Kaneko M, Machida S, Hoshi Y, Kurosaka D. Alterations of Photopic Negative Response of Multifocal Electroretinogram in Patients with Glaucoma. Curr Eye Res. 2015;40(1):77–86.
30. Machida S, Kaneko M, Kurosaka D. Regional Variations in Correlation between Photopic Negative Response of Focal Electoretinograms and Ganglion Cell Complex in Glaucoma. Curr Eye Res. 2015;40(4):439–449.
 © 2022 The Author(s). This work is published and licensed by Dove Medical Press Limited. The
full terms of this license are available at https://www.dovepress.com/terms
and incorporate the Creative Commons Attribution
- Non Commercial (unported, 3.0) License.
By accessing the work you hereby accept the Terms. Non-commercial uses of the work are permitted
without any further permission from Dove Medical Press Limited, provided the work is properly
attributed. For permission for commercial use of this work, please see paragraphs 4.2 and 5 of our Terms.
© 2022 The Author(s). This work is published and licensed by Dove Medical Press Limited. The
full terms of this license are available at https://www.dovepress.com/terms
and incorporate the Creative Commons Attribution
- Non Commercial (unported, 3.0) License.
By accessing the work you hereby accept the Terms. Non-commercial uses of the work are permitted
without any further permission from Dove Medical Press Limited, provided the work is properly
attributed. For permission for commercial use of this work, please see paragraphs 4.2 and 5 of our Terms.