Back to Journals » Clinical Ophthalmology » Volume 8
Correlation between optic nerve head structural parameters and glaucomatous visual field indices
Authors Mizumoto K ![]() , Gosho M, Zako M
, Gosho M, Zako M ![]()
Received 15 February 2014
Accepted for publication 12 May 2014
Published 25 June 2014 Volume 2014:8 Pages 1203—1208
DOI https://doi.org/10.2147/OPTH.S62521
Checked for plagiarism Yes
Review by Single anonymous peer review
Peer reviewer comments 2
Kyoichi Mizumoto,1 Masahiko Gosho,2 Masahiro Zako1
1Department of Ophthalmology, Aichi Medical University, Nagakute, Aichi, Japan; 2Advanced Medical Research Center, Aichi Medical University, Nagakute, Aichi, Japan
Abstract: We examined associations between optic nerve head structural parameters and glaucomatous visual field indices. The study population included patients with glaucomatous optic neuropathy who were evaluated at Aichi Medical University, Nagakute, Aichi, Japan, from October 2010 to January 2011. A total of 57 eyes from 33 patients were assessed. We measured visual field using a Humphrey field analyzer, peripapillary retinal nerve fiber layer thickness (RNFL-T), and Bruch’s membrane opening-minimum rim width (BMO-MRW) using spectral domain optical coherence tomography, and rim area with referring three-dimensional photography. Spearman’s rank correlation coefficients were calculated between the threshold of visual sensitivity or total deviation of visual field and the following five optic nerve head structural parameters: RNFL-T length, BMO-MRW length, rim area, and calculated RNFL-T and BMO-MRW volumes (each length multiplied by rim area). The Akaike information criterion was calculated to determine which structural parameter was the best predictor of each visual field index. Threshold of visual sensitivity had correlation coefficients of 0.23 with global sector of RNFL-T, 0.32 with BMO-MRW, 0.14 with rim area, 0.21 with RNFL-T volume, and 0.26 with BMO-MRW volume. The correlation coefficients for each parameter with total deviation of visual field were 0.22, 0.33, 0.28, 0.36, and 0.37, respectively. The Akaike information criterion of BMO-MRW showed the smallest values in analyses of both threshold of visual sensitivity and total deviation. The present results show that RNFL-T volume and BMO-MRW volume were more strongly correlated with total deviation than BMO-MRW, but BMO-MRW appeared to be the best predictor of the two glaucomatous visual field indices.
Keywords: Bruch’s membrane opening-minimum rim width, glaucoma, retinal nerve fiber layer thickness, rim area, spectral domain optical coherence tomography, visual field
Introduction
Markers for glaucoma detection and risk profiling include several structural parameters within the optic nerve head (ONH). Recent use of spectral domain optical coherence tomography (SDOCT) to study the structure–function relationship in glaucoma reveals an association between loss of visual function in glaucoma and peripapillary retinal nerve fiber layer thickness (RNFL-T).1–3 Furthermore, a case control study in early glaucoma shows high sensitivity of the newly defined Bruch’s membrane opening-minimum rim width (BMO-MRW): ie, the shortest distance from the edge of the retinal pigment epithelium–Bruch’s membrane complex to the inner limiting membrane in the ONH, determined using SDOCT.4,5
Rim area in the ONH is another certain landmark for glaucoma detection and profiling. The accuracy of rim area measurement with SDOCT has been investigated,6 and data confirm the usefulness of optic disc rim area measured by SDOCT for early glaucoma detection.7 Morgan et al8 reported the accuracy of diagnosing glaucomatous optic disc damage based on neuroretinal rim area. Overall, these findings indicate that SDOCT is a promising technique, and that rim area is a structural parameter of absolute importance for glaucoma detection. The available data may also imply another type of important structural parameter in the ONH that seems to be closely associated with glaucomatous functional disorders – namely, RNFL-T volume and BMO-MRW volume.
In the present study we defined RNFL-T volume and BMO-MRW volume, which were calculated by multiplying rim area by RNFL-T and BMO-MRW, respectively. We next calculated Spearman’s rank correlations between the threshold of visual sensitivity or total deviation of visual field and the following five structural parameters in the ONH: RNFL-T and BMO-MRW lengths, rim area, and the calculated RNFL-T and BMO-MRW volumes. Finally, we calculated the Akaike information criterion (AIC)9 to determine which of the five ONH structural parameters was the best predictor of the threshold of visual sensitivity or total deviation of visual field among patients with glaucomatous optic neuropathy.
Methods
Patients
This study included patients with primary open-angle glaucoma who were seen at Aichi Medical University, Nagakute, Aichi, Japan, from October 2010 to January 2011. Exclusion criteria were history of any other ocular disease, previous ocular surgery, tilted disc, micropapillae, myopia lower than −10.0 diopter, hyperopia greater than +4.0 diopter, best-corrected visual acuity of less than 20/40, visual field test with more than 20% fixation losses, and false positive or false negative errors greater than 15%. The study protocol were approved by the internal review board of our institution, and all patients provided informed consent prior to study entry.
RNFL-T and BMO-MRW measurement by SDOCT
The SDOCT RS-3000 (Nidek Co., Ltd, Aichi, Japan) was used, along with the Nidek Advanced Vision Information System (NAVIS) EX version 1.3.0.3. (Nidek Co., Ltd). We used the optic disc radial 6 program (5.7 mm) and the optic disc map program (5.1×5.1 mm) as a scanning pattern. This version of the software automatically draws the contour line of the disc margin. RNFL-T was calculated automatically by the optic disc map program (5.1×5.1 mm) in NAVIS. We divided the ONH into six sectors as described by Garway-Heath et al10 and we calculated the mean, which was considered the RNFL-T for each sector.
The BMO-MRW was defined as the shortest distance from the edge of the retinal pigment epithelium–Bruch’s membrane complex to the inner limiting membrane at the rim.4,5 We measured this distance from the captured image using the optic disc radial 6 program, 12 regions of the optic disc at 30° intervals, on the manual setting using a measurement tool in the NAVIS program. We divided the ONH into six sectors as reported by Garway-Heath et al10 and calculated the mean, which was considered the BMO-MRW for each sector.
Rim area
An ophthalmologist with over 20 years of experience evaluated the optic disc stereographs, which were obtained using a Kowa nonmyd WX 3D Retinal Camera® (Kowa Company Ltd, Aichi, Japan) in stereo mode (angle of view: 34°, width: 20°, length: 27°). Based on the stereograph analysis, the ophthalmologist defined the optic disc and the cup borders on a scanning laser ophthalmoscope image from the optic disc map program (5.1×5.1 mm). The centroid of the optic disc (Figure 1A, green point) was determined on the scanning laser ophthalmoscope image using ImageJ 1.46r (Wayne Rasband National Institutes of Health, http://rsb.info.nih.gov/ij/). We added a layer to represent the boundary lines for six sectors using Adobe© Photoshop© CS5 Extended (Adobe Systems Incorporated, San Jose, CA, USA) (Figure 1A, red lines). We also added layers for the optic disc area (Figure 1B, blue oval) and the cup area (Figure 1C, yellow oval). These three layers were combined, and the resultant blue ring was defined as the rim area (Figure 1D). We defined 715 pixels as 5.1 mm because the image size of 715×715 pixels corresponded to the scan size of 5.1×5.1 mm on the optic disc map. Finally, each rim area, divided into six sectors, was calculated using Adobe Photoshop CS5 Extended (Adobe Systems Incorporated).
 | Figure 1 Measurement of the rim area of the right eye on images from a scanning laser ophthalmoscope. |
Visual field analysis
White-on-white standard automated perimetry was performed using a Humphrey Field Analyzer® Model 750 (Carl Zeiss Meditec, Jena, Germany) and the C-30-2 SITA-standard strategy. We used threshold decibel (dB) values and total deviation as glaucomatous indices for corresponding topographic locations of visual field. We analyzed the relationship between 52 data points of the right eye obtained from the threshold static perimeter and the six corresponding sectors of the optic disc. These points were separated from each other by 6° and from the horizontal and vertical meridians by 3°. A mirror image version was prepared using data obtained from examinations of the left eye. A geometric mean of threshold and a mean of total deviation were calculated for each individual sector.
Statistical analysis
All patients enrolled in the study were included in the statistical analysis. Spearman’s rank correlation coefficients were calculated to analyze the associations between the threshold of visual sensitivity or total deviation and the following five structural parameters: RNFL-T, BMO-MRW, rim area, RNFL-T volume, and BMO-MRW volume. Fisher’s transformation was applied to calculate P-values to test the hypotheses of zero correlation and differences between correlations. The threshold of visual sensitivity and total deviation for the global sector were analyzed using a linear mixed effect model, including each structural parameter as a fixed effect, and eye and sector as random effects, considering the repeated measurements on each patient. The AIC9 was calculated to determine which of the five structural parameters was the best predictor of the threshold of visual sensitivity or total deviation of visual field based on the aforementioned mixed effect model. Smaller AIC values indicated better models. A P-value of <0.05 was considered statistically significant. All statistical analyses were performed using SAS 9.3 (SAS Institute, Inc., Cary, NC, USA).
Results
The study included a total of 57 eyes from 33 patients (20 female and 13 male; mean age, 53.7±16.3 years; range, 20–78 years). Mean intraocular pressure measured with Goldmann applanation tonometry was 14.8±3.47 mmHg (range, 7–22 mmHg).
The threshold of visual sensitivity was significantly correlated with the global sectors of RNFL-T (r=0.23, P<0.001), BMO-MRW (r=0.32, P<0.001), rim area (r=0.14, P=0.007), RNFL-T volume (r=0.21, P<0.001), and BMO-MRW volume (r=0.26, P<0.001; Table 1). Pairwise comparison analysis showed that threshold of visual sensitivity was more significantly correlated with BMO-MRW than with RNFL-T, rim area, and RNFL-T volume. Threshold of visual sensitivity was also more significantly correlated with BMO-MRW volume than with rim area and RNFL-T volume.
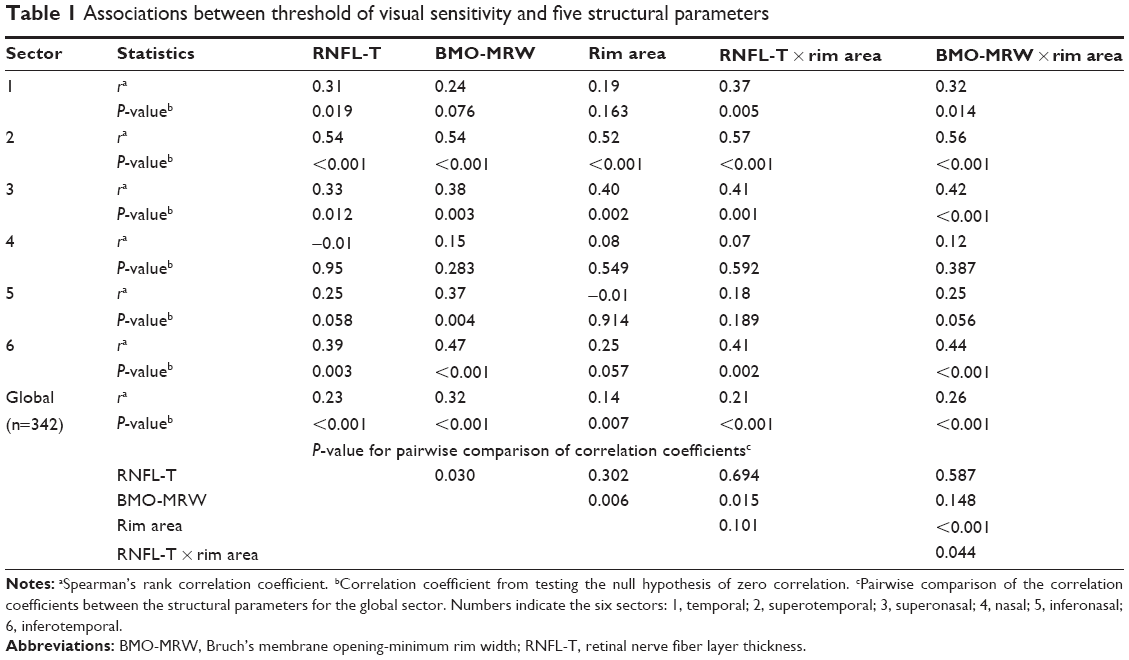 | Table 1 Associations between threshold of visual sensitivity and five structural parameters |
The global sectors of RNFL-T (r=0.22, P<0.001), BMO-MRW (r=0.33, P<0.001), rim area (r=0.28, P<0.001), RNFL-T volume (r=0.36, P<0.001), and BMO-MRW volume (r=0.37, P<0.001) also demonstrated significant correlation coefficients with total deviation (Table 2). Pairwise comparison analysis showed that total deviation was more significantly correlated with BMO-MRW than with RNFL-T. The analysis also revealed that total deviation was more significantly correlated with both BMO-MRW volume and RNFL-T volume than with RNFL-T and rim area.
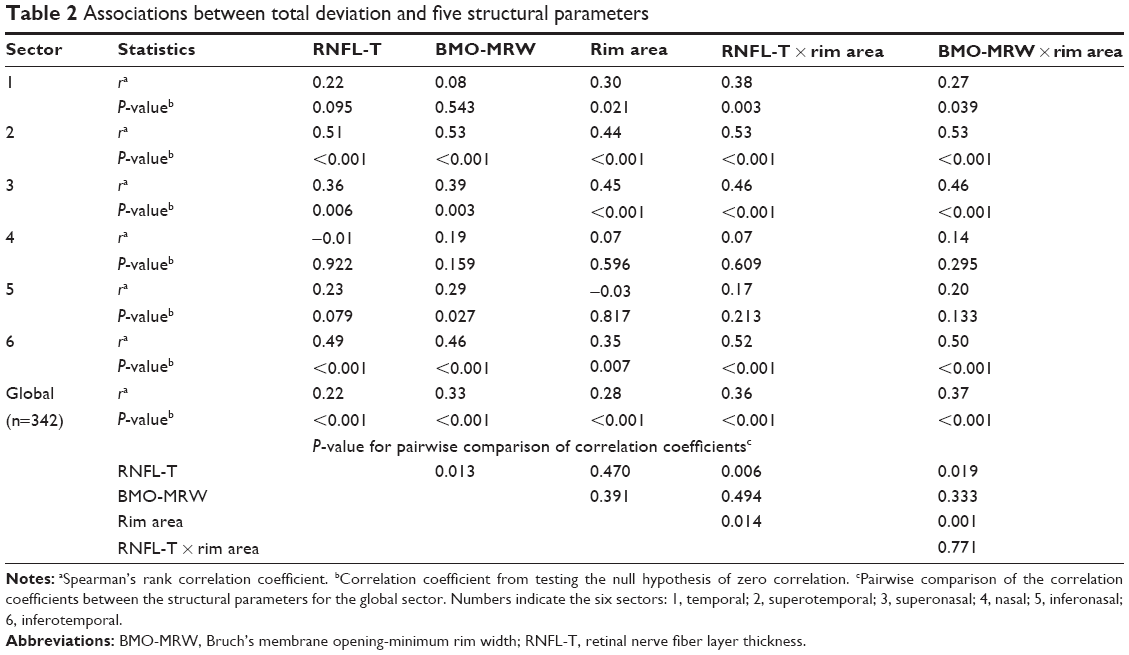 | Table 2 Associations between total deviation and five structural parameters |
Among the five structural parameters, the standardized regression coefficient divided by its standard error of BMO-MRW for the threshold of visual sensitivity was the largest (Table 3). AIC under the model based on BMO-MRW as a predictor of the threshold of visual sensitivity was smaller than that under the other structural parameters. Similar results were found in analyses of the total deviation of visual field.
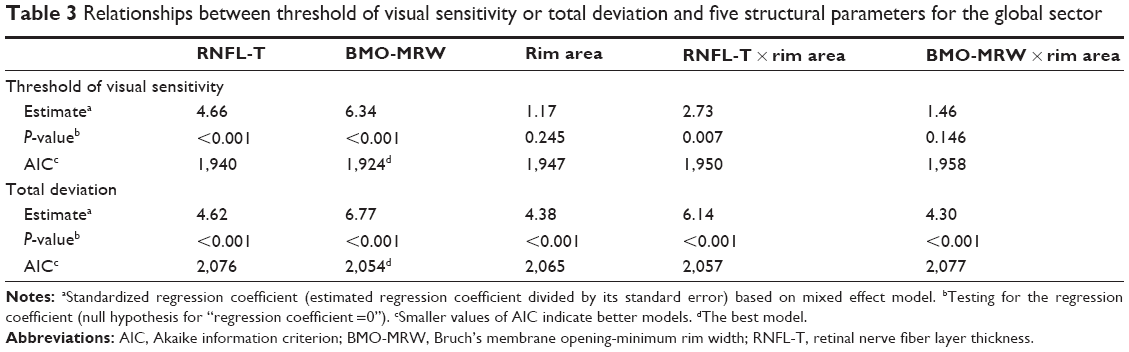 | Table 3 Relationships between threshold of visual sensitivity or total deviation and five structural parameters for the global sector |
Discussion
Our present data indicated that, compared with BMO-MRW length, the RNFL-T and BMO-MRW volumes showed higher correlation coefficients with total deviations. However, BMO-MRW appeared to be the best predictor of both the threshold of visual sensitivity and the total deviation of visual field in patients with glaucomatous optic neuropathy.
For each sector, Spearman’s rank correlation with threshold of visual sensitivity and with total deviation of visual field showed a different trend in the relationship between each sector and the corresponding visual field function. Leite et al3 previously reported that the strongest relationship was found between superotemporal RNFL-T and inferonasal retinal sensitivity (r=0.314, P<0.001); however, the nasal thickness sector was not significantly related to the corresponding visual field function. Our present data also showed that the superotemporal sector had the strongest relationship, with threshold of visual sensitivity and with total deviation of visual field in all five parameters examined except rim area in total deviation. Furthermore, the nasal sector tended to show the weakest relationships with the examined visual field indices.
Ocular structures in the ONH may be influenced by optic disc size. Although RNFL-T is not affected by optic disc size,11–13 myopia reportedly produces variable RNFL-T.14 Using SDOCT, Rao et al15 found that rim area sensitivity increased and specificity decreased in large optic discs in cases of glaucoma. Similarly, the diagnostic performances of the GDx VCC, HRT II, and Stratus OCT were significantly influenced by optic disc size.16 Further investigations are necessary to examine whether optic disc size also affects BMO-MRW.
We speculated that volume (length multiplied by area) might be more closely correlated with glaucomatous indices than with length or area separately. Our present results partly supported this hypothesis. Association between the total deviation of visual field and five structural parameters revealed that total deviation was more strongly correlated with RNFL-T volume than with RNFL-T and rim area, and also more strongly correlated with BMO-MRW volume than with rim area (Table 2). Similarly, threshold of visual sensitivity was more strongly correlated with BMO-MRW volume than with rim area (Table 1). However, threshold of visual sensitivity was more significantly correlated with BMO-MRW than with RNFL-T volume.
SDOCT is a useful tool to detect and evaluate glaucoma progression based on retinal structures.2,3,17 In diagnostic performance for glaucoma detection, the measurement of RNFL-T using SDOCT shows greater sensitivity than Heidelberg retina tomograph (HRT) optic disc measurement.18 Girkin et al13 reported no variations in the glaucoma diagnostic performance of SDOCT between racial groups, and did not find that race was associated with differences in disc area regarding structural parameters of the optic nerve, RNFL-T, and macula.
BMO-MRW may most accurately reflect the amount of retinal nerve fiber from retinal ganglion cells. This parameter is neither perpendicular nor parallel to the peripapillary retinal surface; thus, the BMO-MRW cannot be measured in a plane parallel to the optic disc. However, most programs equipped with SDOCT and HRT, which analyze rim at the ONH, measure the area based on the reference plane parallel to the peripapillary retinal surface. We believe that this measurement method has been a limitation in prior analyses, as has been previously suggested.4,5
In addition to RNFL-T, macular ganglion cell complex (GCC) thickness has recently been used as a supplement in the diagnosis and evaluation of glaucoma. Although GCC thickness and RNFL-T show similar results in glaucoma detection,19,20 here we used only RNFL-T as a control for comparison. Further investigations of values derived from BMO-MRW with GCC may further explain the structure–function relationship in respect of the macular GCC.
Conclusion
Our study data confirm that total deviation was more strongly correlated with RNFL-T volume and BMO-MRW volume than with BMO-MRW. However, BMO-MRW appeared to be the best predictor of both the threshold of visual sensitivity and total deviation of visual field, and may be more useful for detecting and evaluating the progression of glaucoma.
Disclosure
The authors report no conflicts of interest in this work.
References
Chen TC. Spectral domain optical coherence tomography in glaucoma: qualitative and quantitative analysis of the optic nerve head and retinal nerve fiber layer (an AOS thesis). Trans Am Ophthalmol Soc. 2009;107:254–281. | ||
Rao HL, Zangwill LM, Weinreb RN, Leite MT, Sample PA, Medeiros FA. Structure-function relationship in glaucoma using spectral-domain optical coherence tomography. Arch Ophthalmol. 2011;129(7):864–871. | ||
Leite MT, Zangwill LM, Weinreb RN, Rao HL, Alencar LM, Medeiros FA. Structure-function relationships using the cirrus spectral domain optical coherence tomograph and standard automated perimetry. J Glaucoma. 2012;21(1):49–54. | ||
Reis AS, O’Leary N, Yang H, et al. Influence of clinically invisible, but optical coherence tomography detected, optic disc margin anatomy on neuroretinal rim evaluation. Invest Ophthalmol Vis Sci. 2012;53(4):1852–1860. | ||
Chauhan BC, O’Leary N, Almobarak FA, et al. Enhanced detection of open-angle glaucoma with an anatomically accurate optical coherence tomography-derived neuroretinal rim parameter. Ophthalmology. 2013;120(3):535–543. | ||
Moghimi S, Hosseini H, Riddle J, et al. Measurement of optic disc size and rim area with spectral-domain OCT and scanning laser ophthalmoscopy. Invest Ophthalmol Vis Sci. 2012;53(8):4519–4530. | ||
Suh MH, Kim SK, Park KH, Kim DM, Kim SH, Kim HC. Combination of optic disc rim area and retinal nerve fiber layer thickness for early glaucoma detection by using spectral domain OCT. Graefes Arch Clin Exp Ophthalmol. 2013;251(11):2617–2625. | ||
Morgan JE, Bourtsoukli I, Rajkumar KN, et al. The accuracy of the inferior > superior > nasal > temporal neuroretinal rim area rule for diagnosing glaucomatous optic disc damage. Ophthalmology. 2012;119(4):723–730. | ||
Akaike H. A new look at the statistical model identification. IEEE Trans Automat Contr. 1974;19:716–723. | ||
Garway-Heath DF, Holder GE, Fitzke FW, Hitchings RA. Relationship between electrophysiological, psychophysical, and anatomical measurements in glaucoma. Invest Ophthalmol Vis Sci. 2002; 43(7):2213–2220. | ||
Kaushik S, Pandav SS, Ichhpujani P, Gupta A. Correlation of frequency-doubling perimetry with retinal nerve fiber layer thickness and optic disc size in ocular hypertensives and glaucoma suspects. J Glaucoma. 2011;20(6):366–370. | ||
Oddone F, Centofanti M, Tanga L, et al. Influence of disc size on optic nerve head versus retinal nerve fiber layer assessment for diagnosing glaucoma. Ophthalmology. 2011;118(7):1340–1347. | ||
Girkin CA, Liebmann J, Fingeret M, Greenfield DS, Medeiros F. The effects of race, optic disc area, age, and disease severity on the diagnostic performance of spectral-domain optical coherence tomography. Invest Ophthalmol Vis Sci. 2011;52(9):6148–6153. | ||
Kang SH, Hong SW, Im SK, Lee SH, Ahn MD. Effect of myopia on the thickness of the retinal nerve fiber layer measured by Cirrus HD optical coherence tomography. Invest Ophthalmol Vis Sci. 2010;51(8): 4075–4083. | ||
Rao HL, Leite MT, Weinreb RN, et al. Effect of disease severity and optic disc size on diagnostic accuracy of RTVue spectral domain optical coherence tomograph in glaucoma. Invest Ophthalmol Vis Sci. 2011; 52(3):1290–1296. | ||
Medeiros FA, Zangwill LM, Bowd C, Sample PA, Weinreb RN. Influence of disease severity and optic disc size on the diagnostic performance of imaging instruments in glaucoma. Invest Ophthalmol Vis Sci. 2006;47(3):1008–1015. | ||
Strouthidis NG, Fortune B, Yang H, Sigal IA, Burgoyne CF. Longitudinal change detected by spectral domain optical coherence tomography in the optic nerve head and peripapillary retina in experimental glaucoma. Invest Ophthalmol Vis Sci. 2011;52(3):1206–1219. | ||
Leung CK, Ye C, Weinreb RN, et al. Retinal nerve fiber layer imaging with spectral-domain optical coherence tomography a study on diagnostic agreement with Heidelberg retinal tomograph. Ophthalmology. 2010;117(2):267–274. | ||
Kim NR, Lee ES, Seong GJ, Kim JH, An HG, Kim CY. Structure-function relationship and diagnostic value of macular ganglion cell complex measurement using Fourier-domain OCT in glaucoma. Invest Ophthalmol Vis Sci. 2010;51(9):4646–4651. | ||
Cordeiro DV, Lima VC, Castro DP, et al. Influence of optic disc size on the diagnostic performance of macular ganglion cell complex and peripapillary retinal nerve fiber layer analyses in glaucoma. Clin Ophthalmol. 2011;5:1333–1337. |
 © 2014 The Author(s). This work is published and licensed by Dove Medical Press Limited. The
full terms of this license are available at https://www.dovepress.com/terms
and incorporate the Creative Commons Attribution
- Non Commercial (unported, 3.0) License.
By accessing the work you hereby accept the Terms. Non-commercial uses of the work are permitted
without any further permission from Dove Medical Press Limited, provided the work is properly
attributed. For permission for commercial use of this work, please see paragraphs 4.2 and 5 of our Terms.
© 2014 The Author(s). This work is published and licensed by Dove Medical Press Limited. The
full terms of this license are available at https://www.dovepress.com/terms
and incorporate the Creative Commons Attribution
- Non Commercial (unported, 3.0) License.
By accessing the work you hereby accept the Terms. Non-commercial uses of the work are permitted
without any further permission from Dove Medical Press Limited, provided the work is properly
attributed. For permission for commercial use of this work, please see paragraphs 4.2 and 5 of our Terms.