Back to Journals » Journal of Asthma and Allergy » Volume 12
Correlation between impulse oscillometry parameters and asthma control in an adult population
Authors Díaz Palacios MÁ, Hervás Marín D, Giner Valero A, Colomer Hernández N, Torán Barona C ![]() , Hernández Fernández de Rojas D
, Hernández Fernández de Rojas D ![]()
Received 22 November 2018
Accepted for publication 1 March 2019
Published 17 July 2019 Volume 2019:12 Pages 195—203
DOI https://doi.org/10.2147/JAA.S193744
Checked for plagiarism Yes
Review by Single anonymous peer review
Peer reviewer comments 2
Editor who approved publication: Dr Amrita Dosanjh
Miguel Ángel Díaz Palacios,1 David Hervás Marín,2 Ana Giner Valero,1 Noelia Colomer Hernández,1 Carla Torán Barona,1 Dolores Hernández Fernández de Rojas1
1Department of Allergy, Hospital Universitari La Fe, Valencia, Spain; 2Department of Biostatistics, Instituto de Investigación Sanitaria La Fe, Valencia, Spain
Purpose: Impulse oscillometry (IOS) has been proposed as an alternative test to evaluate the obstruction of small airways and to detect changes in airways earlier than spirometry. In this study, we sought to determine the utility and association of IOS parameters with spirometry and asthma control in an adult population.
Patients and methods: Adults 14–82 years of age with asthma were classified into uncontrolled asthma (n=48), partially controlled asthma (n=45), and controlled asthma (n=49) groups, and characterized with fractional exhaled nitric oxide (FENO), IOS, and spirometry in a transversal analysis planned as a one-visit study. The basic parameters evaluated in IOS are resistance at 5 Hz (R5), an index affected by the large and small airway; resistance at 20 Hz (R20), an index of the resistance of large airways; difference between R5 and R20 (R5–R20), indicative of the function of the small peripheral airways; reactance at 5 Hz (X5), indicative of the capacitive reactance in the small peripheral airways; resonance frequency (Fres), the intermediate frequency at which the reactance is null, and reactance area (XA), which represents the total reactance (area under the curve) at all frequencies between 5 Hz to Fres.
Results: There were statistical differences between groups in standard spirometry and IOS parameters reflecting small peripheral airways (R5, R10, R5–R20, Fres, XA and X5) (P<0.001). Accuracy of IOS and/or spirometry to discriminate between controlled asthma vs partially controlled asthma and uncontrolled asthma was low (AUC=0.61). Using linear regression models, we found a good association between spirometry and IOS. In order to evaluate IOS as an alternative or supplementary method for spirometry, we designed a predictive model for spirometry from IOS applying a penalized regression model (Lasso). Then, we compared the original spirometry values with the values obtained from the predictive model using Bland–Altman plots, and the models showed an acceptable bias in the case of FEV1/FVC, FEV1%, and FVC%.
Conclusion: IOS did not show a discriminative capacity to correctly classify patients according to the degree of asthma control. However, values of IOS showed good association with values of spirometry. IOS could be considered as an alternative and accurate complement to spirometry in adults. In a predictive model, spirometry values estimated from IOS tended to overestimate in low values of “real” spirometry and underestimate in high values.
Keywords: asthma, lung function tests, oscillometry, spirometry
Introduction
In daily practice, evaluation of asthma control is based on physician assessments and lung function tests, mainly obtained by spirometry. However, the parameters of spirometry provide a weak correlation with asthma symptoms as they mainly reflect the flow throughout the central airways,1–3 while small peripheral airways (<2 mm diameter) play an important role in persistent bronchial asthma.4,5
It has been reported in some studies that impulse oscillometry (IOS) is capable to differentiate healthy subjects from patients with respiratory complaints by identifying increased distal airway resistance not detected by spirometry.6–8
6IOS shows the respiratory system impedance (Z) at different frequencies of oscillation. Impedance depends basically on resistance (R) and reactance (X) of the respiratory system. The basic parameters evaluated in IOS are resistance at 5 Hz (R5), an index affected by the large and small airway; resistance at 20 Hz (R20), an index of the resistance of large airways; difference between R5 and R20 (R5-R20), indicative of the function of the small peripheral airways; reactance at 5 Hz (X5), indicative of the capacitive reactance in the small peripheral airways; resonance frequency (Fres), the intermediate frequency at which the reactance is null; and reactance area (XA), which represents the total reactance (area under the curve) at all frequencies between 5 Hz to Fres. X5, Fres, and XA reflect changes in the reactance of the airway. Clinical and physiological studies with IOS previously published suggest that these parameters, together with R5-R20, are increased in small airway disease.9–11 R20 and R5-R20 parameters increased at the same time would reflect central and peripheral obstruction of the airway.
Performing IOS is effort-independent and requires minimal collaboration from the patient. The principal limitation of IOS is the lack of reference values and cutoff points for all populations, although in the last years there are significant progresses in this regard.12–16
In healthy and asthmatic population, airway resistance, especially at lower frequencies, is inversely correlated to age and height; younger children generally have higher airway resistance than older children and adults.17 With a standardized method, the short-term intra-individual variation coefficient of IOS parameters in healthy adults ranges 5% to 15%, and the day-to-day variability is reported to be 10–11%.9
IOS has been studied mainly in children, and in this population, results show some sensitivity and accuracy to diagnose asthma18–23 although there are some contradictory results.24 Some studies have focused on the correlation between IOS parameters and the control and monitoring of asthma.25 Another study found that IOS correlated better with clinical symptoms and asthma control than spirometry in patients with asthma.26 It has been reported that IOS parameters can discriminate better than spirometry between controlled asthma and uncontrolled asthma in children7 and could predict loss of asthma control.27
IOS could be useful to differentiate asthma from COPD through inspiratory-minus-expiratory X5 parameters assessment.28
Although there are some evidence proving the correlation between IOS parameters and other functional parameters of asthma, IOS has not yet become a standard methodology for the routine assessment of lung function in clinical practice, and further studies are needed to determine the interpretation and clinical application of IOS parameters. IOS should be tested in order to evaluate its role in daily clinical practice, mainly to differentiate between patients with controlled and uncontrolled asthma.
Our study aims to evaluate the utility and correlation of IOS parameters with spirometry and asthma control in an adult population.
Materials and methods
Study design
A transversal analysis was planned as a one-visit study. At the visit, collection of demographic and clinical data was followed by completing the Asthma Control Questionnaire (ACQ-7), the Asthma Control Test (ACT), and the Asthma Quality of Life Questionnaire (AQLQ). Adherence to therapy was evaluated by the Morisky–Green test. On the same day, blood was drawn to measure total IgE, eosinophil cationic protein (ECP), and the eosinophil count in peripheral blood. Total IgE and ECP were quantified by the UNICAP immunoanalysis system (Pharmacia Uppsala, Sweden).
According to GINA 2012 criteria, subjects were classified into three groups: uncontrolled, partially controlled, and controlled asthma. All data were collected in a database (Open-access, Microsoft) for further statistical analysis.
Study population
One hundred and forty-two consecutive asthma outpatients were invited to participate in the study between June 2013 and April 2014. Subjects fulfilled the American Thoracic Society (ATS) criteria for asthma and had no other respiratory diseases. Diagnosis of asthma was confirmed by a positive bronchodilator test (12% increase in FEV1 and >200 mL) and/or a positive metacholine challenge test (PD20<1 mg/mL or PC20<8 mg/mL). All participants were nonsmokers or ex-smokers since 1 year (with a history of tobacco exposure <5 pack-years). Patients needing oral corticosteroid treatment within 4 weeks of the screening visit were excluded. The study was performed in compliance with the Declaration of Helsinki, and a parent or legal guardian provided written informed consent for any participant under the age of 18 years. The study was approved by the Biomedical Research Ethics Committee (Polytechnic and University Hospital La Fe) with registry number 2013/0137.
Lung function tests
FENO (average of three determinations) and IOS (average of three determinations) were always determined before spirometry, to avoid the influence of forced breathing maneuvers on IOS. All measurements were made before bronchodilation. FENO was performed with NO Vario Analyser V 4.39.a (FILT Gmbh, Germany). IOS and spirometry measurements were performed using Master Lab-IOS unit (Masterscreen IOS 2001, version 4.5, Erich Jaeger GmbH, Germany). Spirometry was performed according to ATS/European Respiratory Society (ERS) guidelines. Long-acting bronchodilators were withheld for 12 hrs prior to testing and short-acting bronchodilators for 4 hrs. IOS was performed according to the ERS Task Force recommendations9 with recordings lasting for 30 s and measuring in the frequency range 5–35 Hz. We collected data of usual parameters of IOS: impedance (Z5), resistance at 5 Hz (R5), resistance at 20 Hz (R20), resistance at 10 Hz (R10), difference of R5-R20 (R5-R20), resonance frequency (Fres), and reactance area (AX) in absolute and relative values. We included two parameters Rc (central resistance) and Rp (peripheral resistance) which were not derived from the isolated models of the impedance basic components, but result from a complex lung model according to Mead,29 calculated by the software of IOS Masterscreen.
Statistical analysis
Data were summarized using mean and standard deviation in the case of continuous variables and absolute and relative frequencies in the case of categorical variables. Differences in spirometry and IOS measurements between groups (uncontrolled, partially controlled, and controlled asthma) were assessed using the Kruskal–Wallis tests. A logistic regression model was performed to assess the capability of the different IOS and spirometry parameters to discriminate among the different asthma control groups. Correlation among the different parameters of spirometry and IOS was assessed using Spearman’s rank correlation coefficient. In order to evaluate IOS as an alternative to spirometry, a predictive multivariate model using penalized regression (Lasso) was fitted for predicting spirometry values from IOS measurements. Accuracy of the model was assessed using Bland–Altman plots of predicted versus observed values for each of the spirometry parameters. All statistical analyses were performed using R (version 3.2.1) and R-packages glmnet (version 2.0–2) and pROC (version 1.8).
Results
Clinical and demographic characteristics
The mean age of the study population was 44.6 years (14–82) with 72 patients of female gender (51%). Patients were classified into three groups (Table 1) according to criteria defined in GINA 2012: uncontrolled asthma (n=48), partially controlled asthma (n=45), and controlled asthma (n=49).
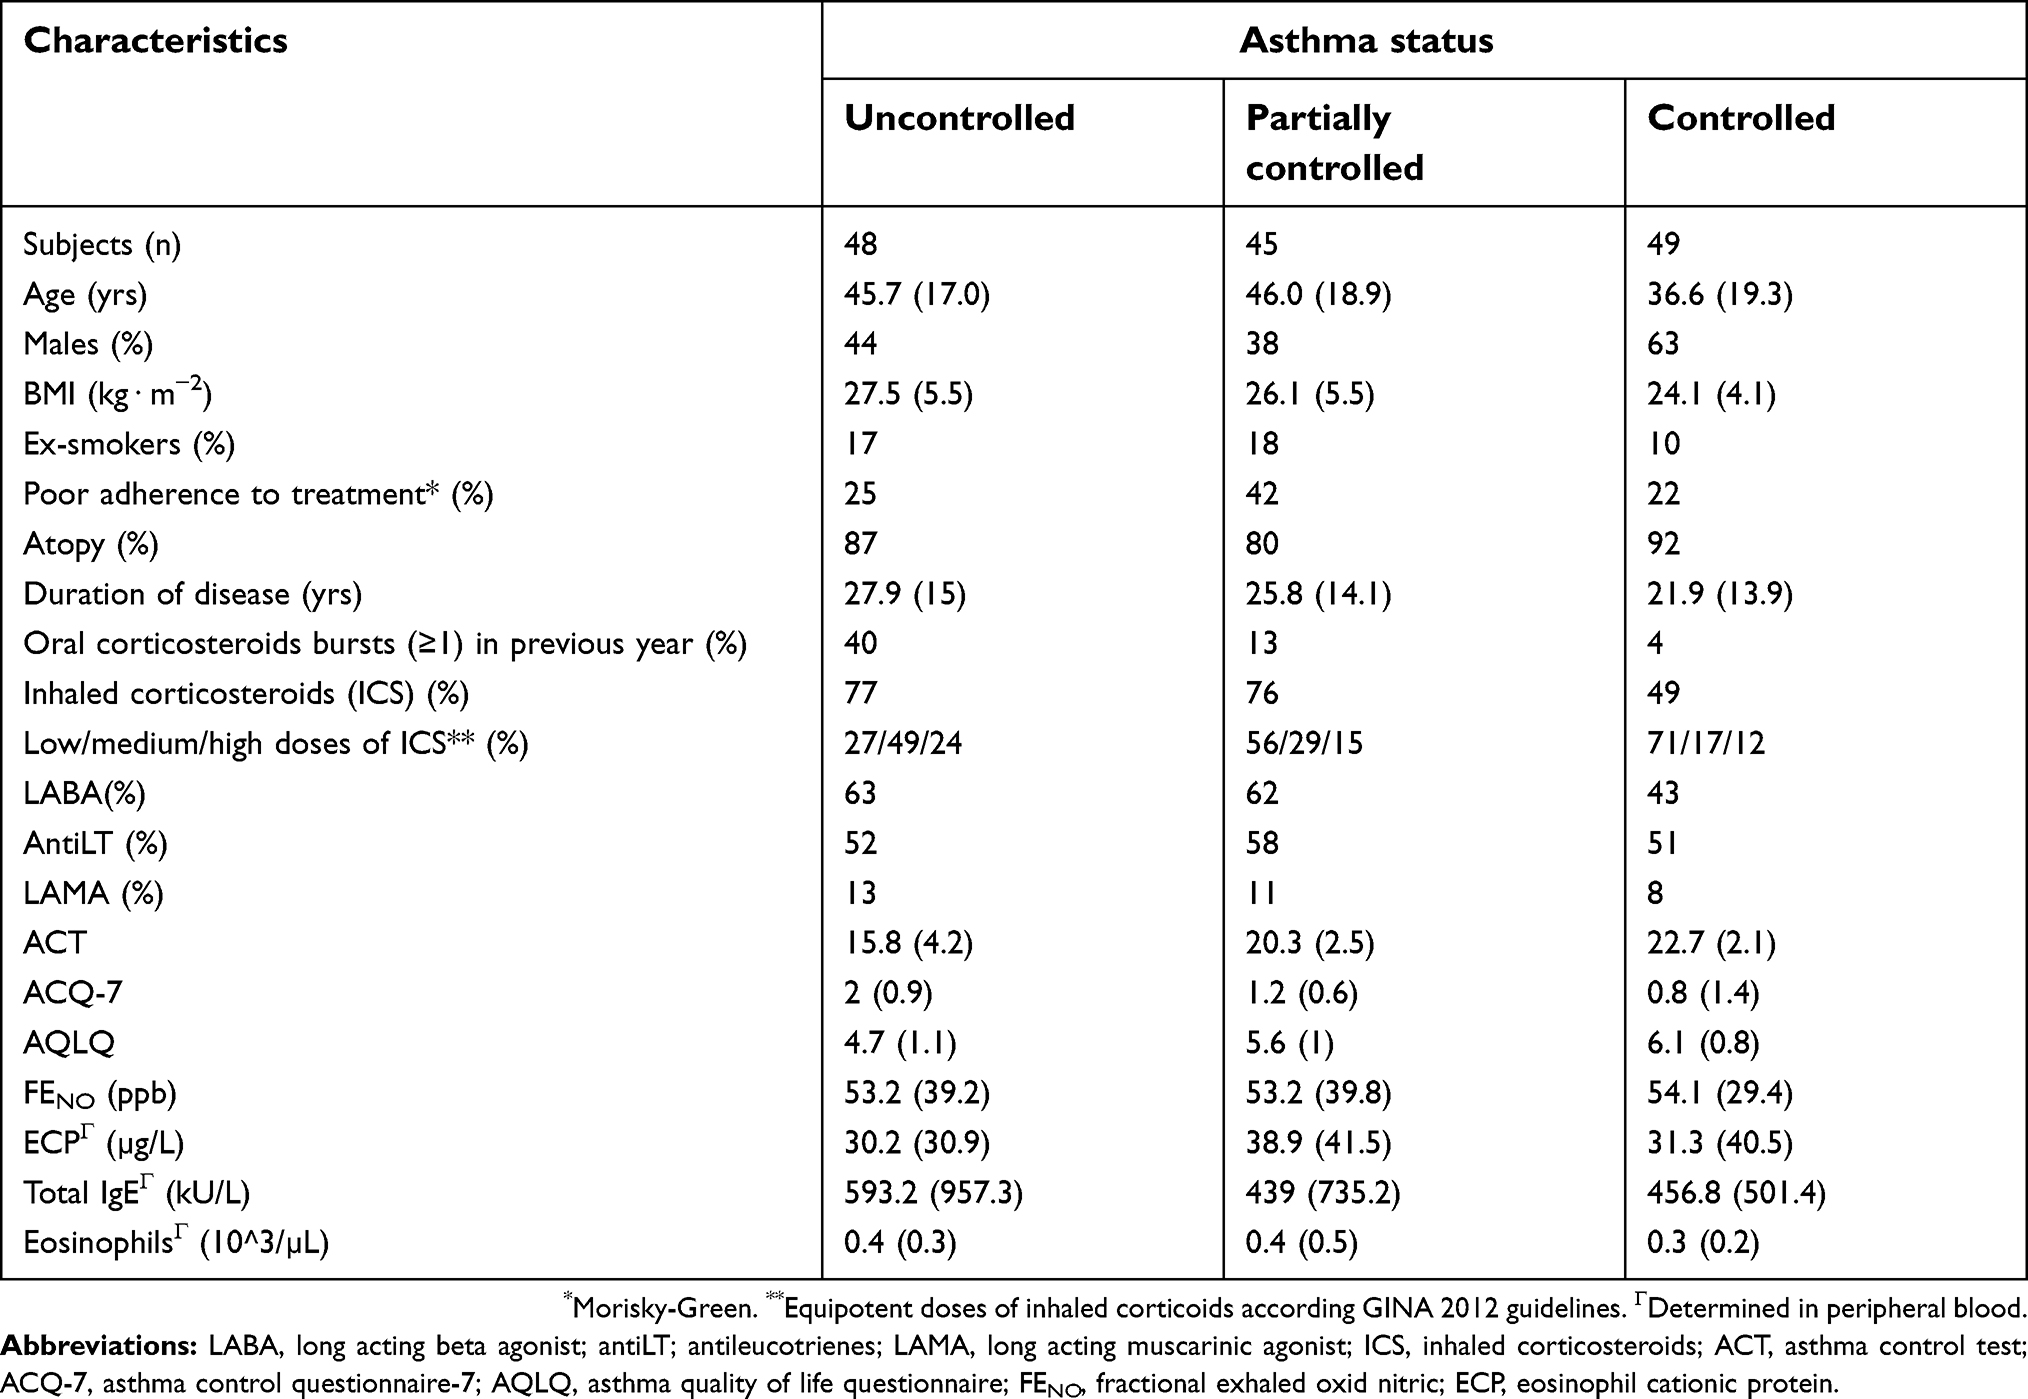 |
Table 1 Clinical data and results of questionnaires and laboratory tests of the three groups of the asthma population |
Measurements of spirometry and IOS
The parameters of standard spirometry (Table 2) and IOS (Table 3) were compared between groups. There were statistically significant differences between the three groups in standard spirometry parameters (FEV1, FEF25-75, and FEV1/FVC ratio). Concerning IOS parameters, there were statistically significant differences in Z, R5, R10, R5-R20, Fres, XA, and X5 (P<0.001). R20, R20%, R10%, and Rc, parameters mainly dependent on central airways, were homogeneous among groups. Maximal differences were observed for R5–R20. Results of X5 were highly variable in the three groups.
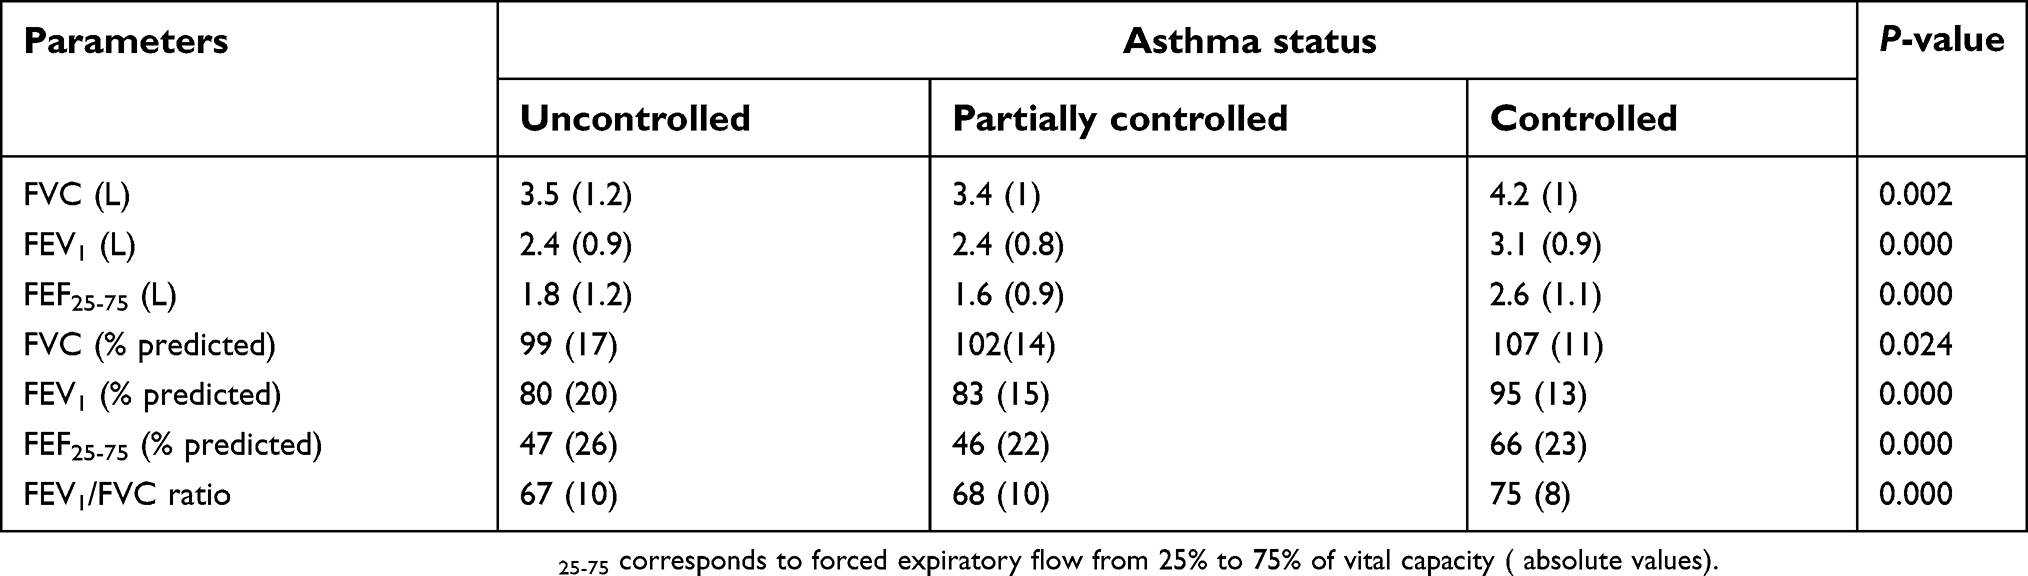 |
Table 2 Standard spirometry parameters for different asthma status |
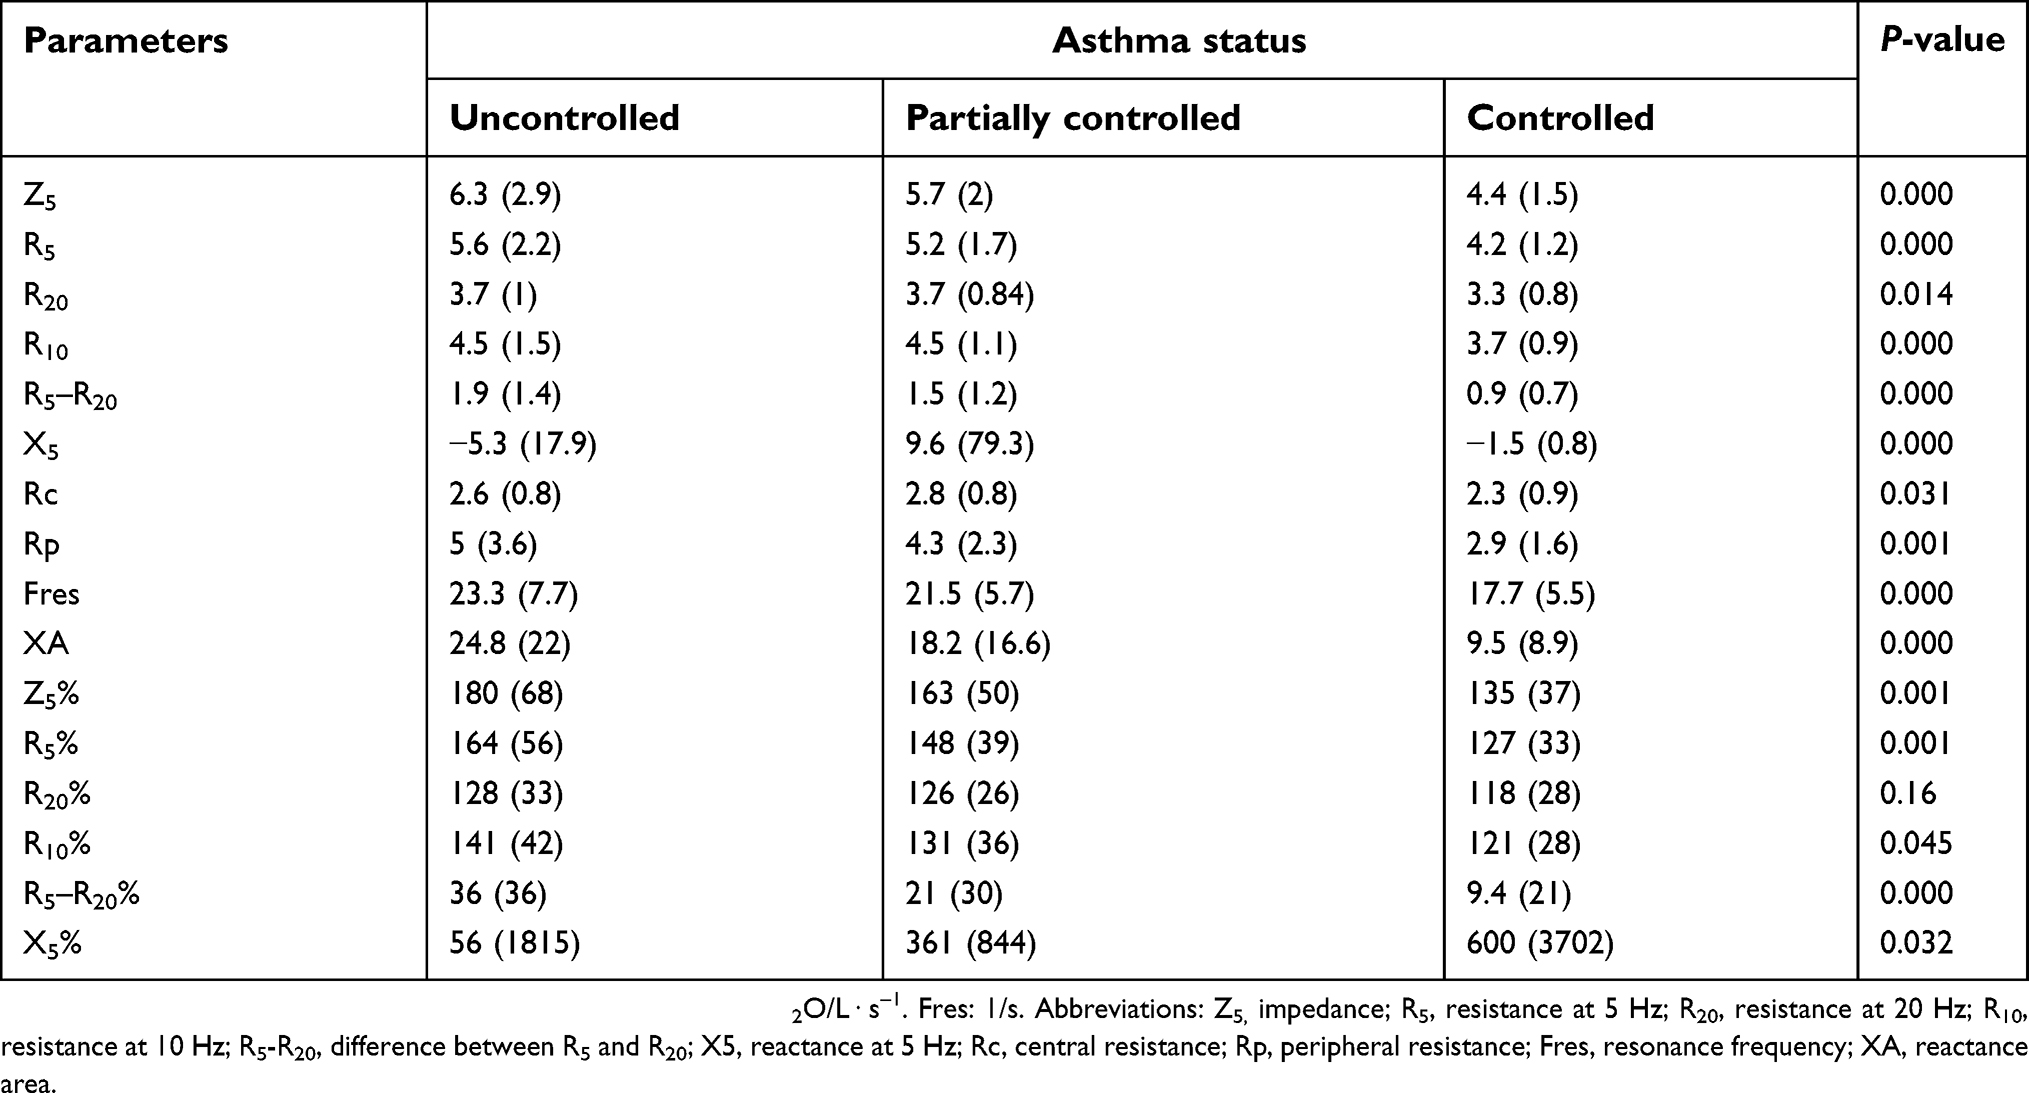 |
Table 3 Impulse oscillometry parameters for different asthma status |
Variable correlations
The accuracy of IOS and/or spirometry to discriminate between three groups was evaluated through ROC curves. Uncontrolled asthma and partially controlled asthma group were analyzed together versus controlled asthma group to improve the predictive ability of both tests. All spirometry and/or IOS parameters were included in the analysis. The apparent area under the ROC curve (AUC) was 0.76, but when the predictive capacity was assured through cross-validation, the AUC was 0.61 (Figure 1). In Figure 2 we show the correlations between the different IOS and spirometry parameters.
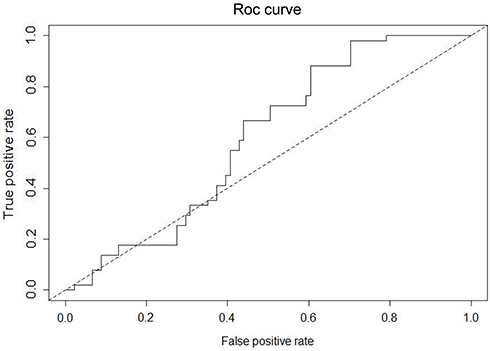 |
Figure 1 Receiver operating characteristic (ROC) curve showing the accuracy of IOS and spirometry (overall parameters analyzed) to discriminate between asthma control degree. Controlled asthma subjects were evaluated versus uncontrolled and partially controlled asthma.Abbreviation: IOS, impulse oscillometry. |
 |
Figure 2 Correlation between parameters of spirometry and IOS. Only frequencies higher than 0.7 (red lines) or less than −0.7 (blue lines) are shown. The thickness of the lines is proportional to the frequency. Note: (%) after every abbreviation means relative or percentual values. Abbreviations: Z5, impedance; R5, reactance at 5 Hz; R10, reactance at 10 Hz; R20, reactance at 20 Hz; R5-R20, difference between R5 and R20; Fres, resonance frequency; Rc, central resistance; Rp, peripheral resistance; XA, reactance area; FEF 25-75, forced expiratory flow at 25-75% (absolute values). |
In order to evaluate IOS as an alternative to spirometry, a predictive model for spirometry from IOS was obtained. The values of IOS, Z5%, R20%, X5, X5%, Rc, Rp, and Fres were selected as predictive variables for spirometry. Predictive capacity of this set of variables has been contrasted with a series of predictions for the spirometry variables: FVC, FVC%, FEV1, FEV1%, FEV1/FVC, FEF25-75, and FEF25-75% . Both methods were compared using the original values of spirometry and spirometry values calculated from IOS. Figure 3 shows the results of Bland–Altman plots for each of the comparisons of the seven variables of spirometry. In all comparisons, there is a proportional error determined by the trend shown in the graph. Despite the apparent absence of bias (as the average of all points fall to zero), there is a general tendency of IOS to overestimate in low values of spirometry and underestimate in high values.
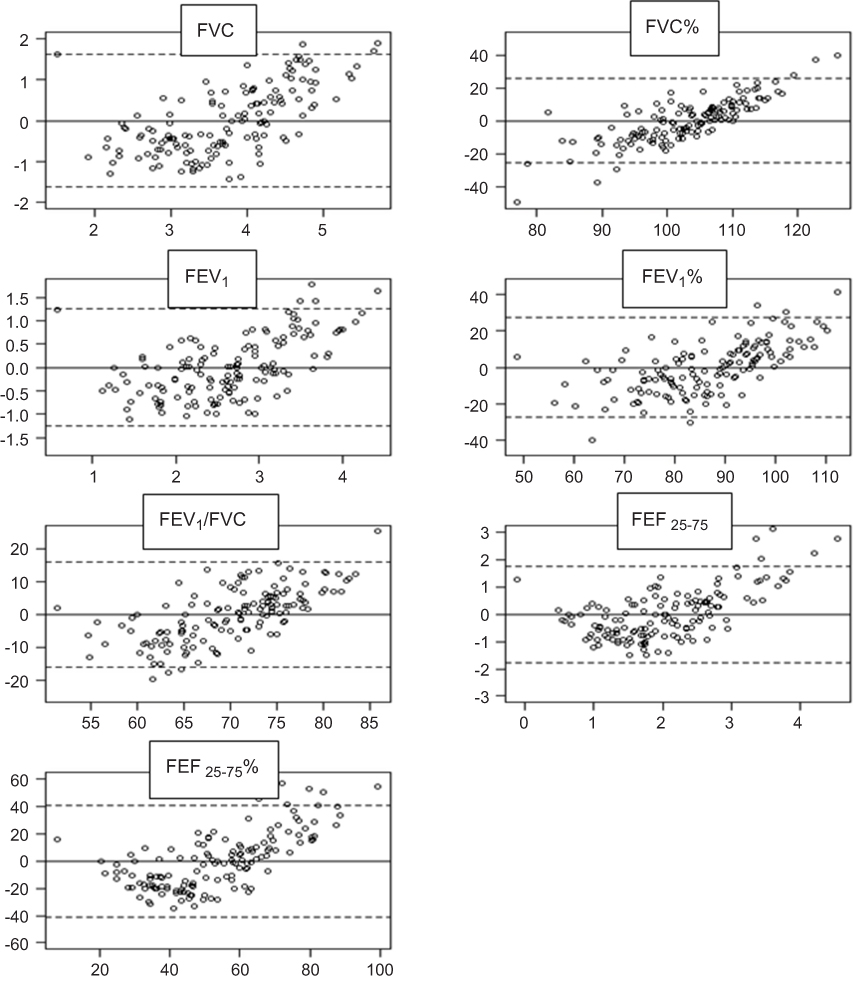 |
Figure 3 Bland–Altman plots of agreement between real spirometry values and predictive values from IOS. Models showed an acceptable bias for FEV1%, FVC% , and FEV1/FVC values.Abbreviation: FVC, forced vital capacity; FEV 1, forced in expiratory volume in 1 second; FEF 25-75, forced expiratory flow at 25%-75% (absolute values) ; FEF 25-75 % , forced expiratory flow at 25%-75% (percentage). |
Discussion
In this study, IOS showed a low capacity to discriminate between controlled versus not controlled and partially controlled asthma patients.
Patients with uncontrolled asthma or partially controlled asthma had a higher mean age, duration of disease, and BMI than controlled asthma subjects. We observed a good correlation between the degree of asthma control, according to GINA 2012 guidelines, and the score value of ACQ-7 according to the accepted cut offpoints.30 The ACT also showed a good correlation with the asthma control level, with score values in the range of the accepted ones.
Although the study population included patients with long-term asthma regularly attended at an Allergy Department, the prevalence of “not well-controlled patients” was 65.5%. Similar values were described in previous studies.31 An epidemiological study carried out in our country reported adequate asthma control only in 13% of the subjects.32
Mean FENO values were 53.6 ppb, corresponding with the allergic asthma phenotype of the sample, and there were no differences according to the degree of asthma control. ECP serum levels were also similar in the three groups. Total IgE was higher in uncontrolled asthma group, in agreement with previous reports.33
Differences among the three groups of asthma were observed for IOS values, in Z5, R5, R5-R20, X5, Fres, and XA, parameters representing small airway disease. R20values were within normal limits, reflecting the absence of central airway obstruction. However, R5–R20 values were increased in the partially controlled and uncontrolled groups, reflecting peripheral obstruction of the airways.
The high variability in the results of reactance (X5), detected in our study, has been reported previously.9,12.Patients with asthma have a more negative X5 compared with control subjects.34–36
The differences observed in the IOS values were not large enough to discriminate among groups, with an important overlap between the three groups. Consequently, we performed a L1 and L2 Penalized Regression Model (Elastic Net) to discriminate between the controlled asthma group and the other two groups (uncontrolled/partially controlled) from IOS and/or spirometry parameters. For this predictive model, parameters of spirometry and IOS were jointly analyzed. The AUC was 0.76. However, when predictive capacity through cross-validation was assessed, the AUC was lower (AUC: 0.61). This result differs from the reported in a children population showing a better discriminative ability of IOS, with cutoff points for baseline R5–R20 and XA that effectively discriminated controlled versus uncontrolled asthma (AUC: 0.86 and 0.84) and correctly classified more than 80% of the population.26
It is well known that the correlation between asthma symptoms and objective measures of airway obstruction, measured with spirometry, is poor in adults.3 However, IOS was not used before for this purpose in an adult population.
Although we found some differences between groups regarding the values of spirometry and specially IOS parameters, these differences were not enough to develop a reliable predictive model to discriminate between asthma-controlled subjects and uncontrolled/partially controlled subjects.
Using linear regression models, we found a good association between spirometry and IOS, as in previous studies.37 Figure 3 represents the associations between parameters. We presumed that a high association between different variables means that each parameter provides similar information rather than complementary information in the development of a predictive model. In this sense, IOS may represent a good alternative to spirometry, to evaluate lung function in adult asthma, due to the simplicity of the technique. Nevertheless, it is necessary to have reliable reference values.
In order to evaluate IOS as an alternative or supplementary method for spirometry, we designed a predictive model for spirometry from IOS applying a penalized regression model (Lasso). This has allowed to compare the original spirometry values with the values obtained from the predictive model using Bland–Altman plots. In the case of FEV1/FVC, FEV1%, and FVC%, the models showed an acceptable bias and the approximations are good enough to replace the actual values of spirometry. For the other variables of spirometry, biases are too large, though clearly showed an association. It is possible that the development of more advanced, nonlinear, models diminishes the bias.
Our data have some limitations in terms of this being a cross-sectional design and include a relatively small number of patients. Moreover, the long duration of asthmatic disease of the studied population may influence the functional results due to the induced structural changes over time. This fact could explain some differences observed between our results and other studies performed in children.
Conclusion
IOS values showed significant differences between uncontrolled, partially controlled, and controlled asthma subjects, but the test did not show a discriminative capacity to correctly classify patients according to the degree of asthma control. However, values of IOS showed good correlation with the values of spirometry. Consequently, IOS could be considered as an alternative and accurate complement to spirometry, both in children and in adults. In a predictive model, spirometry values estimated from IOS tended to overestimate in low values of “real” spirometry and underestimate in high values.
Acknowledgment
No funding was received for this study.
Disclosure
The authors report no conflicts of interest in this work.
References
1. Kendrick AH, Higgs CM, Whitfield MJ, et al. Accuracy of perception of severity of asthma: patients treated in general practice. BMJ. 1993;307:422–424. doi:10.1136/bmj.307.6901.422
2. Teeter JG, Bleecker ER. Relationship between airway obstruction and respiratory symptoms in adult asthmatics. Chest. 1998;113:272–277.
3. Spahn JD, Cherniack R, Paull K, et al. Is forced expiratory volume in one second the best measure of severity in childhood asthma? Am J Respir Crit Care Med. 2004;169:784–786. doi:10.1164/rccm.200309-1234OE
4. Farah CS, King GG, Brown NJ, et al. The role of the small airways in the clinical expression of asthma in adults. J Allergy Clin Immunol. 2012;129:381–387. doi:10.1016/j.jaci.2011.11.017
5. Martin RJ. Therapeutic significance of distal airway inflammation in asthma. J Allergy Clin Immunol. 2002;109:447–460. doi:10.1067/mai.2002.121409
6. Oppenheimer BW, Goldring RM, Herberg M, et al. Distal airway function in symptomatic subjects with normal spirometry following world trade center dust exposure. Chest. 2007;132:1275–1282. doi:10.1378/chest.07-0913
7. Shi Y, Aledia AS, Tatavoosian AV, et al. Relating small airways to asthma control by using impulse oscillometry in children. J Allergy Clin Immunol. 2012;129:671–678. doi:10.1016/j.jaci.2011.11.002
8. Pasker HG, Schepers R, Clement J, et al. Total respiratory impedance measured by means of the forced oscillation technique in subjects with and without respiratory complaints. Eur Respir J. 1996;9:131–139. doi:10.1183/09031936.96.09010132
9. Oostveen E, MacLeod D, Lorino H, et al. .The forced oscillation technique in clinical practice: methodology, recommendations and future developments on behalf of the ERS task force on respiratory impedance measurements. Eur Respir J. 2003;22:1026–1041.
10. Goldman MD, Saadeh C, Ross D. Clinical applications of forced oscillation to assess peripheral airway function. Respir Physiol Neurobiol. 2005;148:179–194. doi:10.1016/j.resp.2005.05.026
11. Galant SP, Komarow HD, Shin HW, et al. The case for impulse oscillometry in the management of asthma in children and adults. Ann Allergy Asthma Immunol. 2017;118:664–671. doi:10.1016/j.anai.2017.04.009
12. Park JH, Yoon JW, Shin YH, et al. Reference values for respiratory system impedance using impulse oscillometry in healthy preschool children. Korean J Pediatr. 2011;54:64–68. doi:10.3345/kjp.2011.54.2.64
13. Lee JY, Seo JH, Kim HY, et al. Reference values of impulse oscillometry and its utility in the diagnosis of asthma in young Korean children. J Asthma. 2012;49:811–816. doi:10.3109/02770903.2012.716472
14. Calogero C, Simpson SJ, Lombardi E, et al. Respiratory impedance and bronchodilator responsiveness in healthy children aged 2–13 years. Pediatr Pulmonol. 2013;48:707–715. doi:10.1002/ppul.22699
15. Oostveen E, Boda K, van der Grinten CP, et al. Respiratory impedance in healthy subjects: baselinevalues and bronchodilator response. Eur Respir J. 2013;42:1513–1523. doi:10.1183/09031936.00126212
16. Schulz H, Flexeder B, Behr J, et al. Reference values of impulse oscillometric lung function indices in adults of advanced age. PLoS One. 2013;8:e63366. doi:10.1371/journal.pone.0063366
17. Clement J, Dumoulin B, Gubbelmans R, et al. Reference values of total respiratory resistance and reactance between 4 and 26 Hz in children and adolescents aged 4 –20 years. Bull Eur Physiopathol Respir. 1987;23:441–448.
18. Marotta A, Klinnert MD, Price MR, et al. Impulse oscillometry provides an effective measure of lung dysfunction in 4-year-old children at risk for persistent asthma. J Allergy Clin Immunol. 2003;112:317–322.
19. Park JW, Lee YW, Jung YH, et al. Impulse oscillometry for estimation of airway obstruction and bronchodilation in adults with mild obstructive asthma. Ann Allergy Asthma Immunol. 2007;98:546–552. doi:10.1016/S1081-1206(10)60733-8
20. Larsen GL, Morgan W, Heldt GP, et al. Impulse oscillometry versus spirometry in a long-term study of controller therapy for pediatric asthma. J Allergy Clin Immunol. 2009;123:861–877. doi:10.1016/j.jaci.2008.10.036
21. Song TW, Kim KW, Kim ES, et al. Utility of impulse oscillometry in young children with asthma. Pediatr Allergy Immunol. 2008;19:763–768. doi:10.1111/j.1399-3038.2008.00734.x
22. Jee HM, Kwak JH. Jung da W, et al. Useful parameters of bronchial hyperresponsiveness measured with an impulse oscillation technique in preschool children. J Asthma. 2010;47:227–232. doi:10.3109/02770901003624259
23. Batmaz SB, Kuyucu S, Arikoglu T, et al. Impulse oscillometry in acute and stable asthmatic children: a comparison with spirometry. J Asthma. 2016;53:179–186. doi:10.3109/02770903.2015.1081699
24. Cuijpers CE, Wesseling GJ, Kessels AG, et al. Low diagnostic value of respiratory impedance measurements in children. Eur Respir J. 1997;10:88–93.
25. Gonem S, Natarajan S, Desai D, et al. Clinical significance of small airway obstruction markers in patients with asthma. Clin Exper Allergy. 2013;44:499–507. doi:10.1111/cea.12257
26. Takeda T, Oga T, Niimi A, et al. Relationship between small airway function and health status, dyspnea and disease control in asthma. Respiration. 2010;80:120–126. doi:10.1159/000242113
27. Shi Y, Aledia AS, Galant SP, et al. Peripheral airway impairment measured by oscillometry predicts loss of asthma control in children. J Allergy Clin Immunol. 2013;131:718–723. doi:10.1016/j.jaci.2012.09.022
28. Paredi P, Goldman M, Alamen A, et al. Comparison of inspiratory and expiratory resistance and reactance in patients with asthma and chronic obstructive pulmonary disease. Thorax. 2010;65(3):263–267. doi:10.1136/thx.2009.120790
29. Mead J. Mechanical properties of lungs. Physiol Rev. 1961;41:281–320. doi:10.1152/physrev.1961.41.2.281
30. Juniper EF, Bousquet J, Abetz L, et al. Identifying ‘well-controlled’ and ‘not well-controlled’ asthma using the asthma control questionnaire. Respir Med. 2006;100:616–621. doi:10.1016/j.rmed.2005.08.012
31. Bateman ED, Boushey HA, Bousquet J, et al. Can guideline-defined asthma control be achieved? The gaining optimal asthma control study. Am J Respir Crit Care Med. 2004;170:836–844. doi:10.1164/rccm.200401-033OC
32. Olaguibel JM, Quirce S, Juliá B, et al. Measurement of asthma control according to global initiative for asthma guidelines: a comparison with the asthma control questionnaire. Respir Res. 2012;13:50. doi:10.1186/1465-9921-13-50
33. Tanaka A, Jinno M, Hirai K, et al. Longitudinal increase in total IgE levels in patients with adult asthma: an association with poor asthma control. Respir Res. 2014;15:144. doi:10.1186/s12931-014-0144-8
34. Kim HY, Shin YH, Jung Da W, et al. Resistance and reactance in oscillation lung function reflect basal lung function and bronchial hyperresponsiveness respectively. Respirology. 2009;14(7):1035–1041. doi:10.1111/j.1440-1843.2009.01605.x
35. Nielsen KG, Bisgaard H. Discriminative capacity of bronchodilator response measured with three diff erent lung function techniques in asthmatic and healthy children aged 2 to 5 years. Am J Respir Crit Care Med. 2001;164(4):554–559. doi:10.1164/ajrccm.164.4.2006119
36. Qi GS, Zhou ZC, Gu WC, et al. Detection of the airway obstruction stage in asthma using impulse oscillometry system. J Asthma. 2013;50(1):45–51. doi:10.3109/02770903.2012.743154
37. Nair A, Ward J, Lipworth BJ. Comparison of bronchodilator response in patients with asthma and healthy subjects using spirometry and oscillometry. Ann Allergy Asthma Immunol. 2011;107:317–322. doi:10.1016/j.anai.2011.07.011
 © 2019 The Author(s). This work is published and licensed by Dove Medical Press Limited. The
full terms of this license are available at https://www.dovepress.com/terms
and incorporate the Creative Commons Attribution
- Non Commercial (unported, 3.0) License.
By accessing the work you hereby accept the Terms. Non-commercial uses of the work are permitted
without any further permission from Dove Medical Press Limited, provided the work is properly
attributed. For permission for commercial use of this work, please see paragraphs 4.2 and 5 of our Terms.
© 2019 The Author(s). This work is published and licensed by Dove Medical Press Limited. The
full terms of this license are available at https://www.dovepress.com/terms
and incorporate the Creative Commons Attribution
- Non Commercial (unported, 3.0) License.
By accessing the work you hereby accept the Terms. Non-commercial uses of the work are permitted
without any further permission from Dove Medical Press Limited, provided the work is properly
attributed. For permission for commercial use of this work, please see paragraphs 4.2 and 5 of our Terms.