Back to Journals » International Journal of Chronic Obstructive Pulmonary Disease » Volume 12
Correlation between fractional exhaled nitric oxide and sputum eosinophilia in exacerbations of COPD
Authors Gao J, Zhang M, Zhou LQ, Yang X, Wu HG, Zhang JF, Wu F ![]()
Received 17 February 2017
Accepted for publication 27 March 2017
Published 27 April 2017 Volume 2017:12 Pages 1287—1293
DOI https://doi.org/10.2147/COPD.S134998
Checked for plagiarism Yes
Review by Single anonymous peer review
Peer reviewer comments 2
Editor who approved publication: Prof. Dr. Richard Russell
Jie Gao,1 Min Zhang,2 Liqin Zhou,1 Xing Yang,1 Haigui Wu,1 Jianfang Zhang,1 Feng Wu1
1Department of Respiratory Medicine, 2Internal Medicine-Cardiovascular Department, The Third People’s Hospital, Guangzhou Medical College, Huizhou, People’s Republic of China
Introduction: Measurements of eosinophils in induced sputum and fractional exhaled nitric oxide (FeNO) are noninvasive biomarkers for assessing airway inflammation phenotypes in chronic obstructive pulmonary disease (COPD). Nevertheless, the clinical application of the correlation between FeNO levels and sputum eosinophilia is controversial. The study aimed to investigate the correlation and predictive relationship between FeNO levels and sputum eosinophils in patients with COPD exacerbation. It also examined the relationship between FeNO levels and blood eosinophil percentage.
Methods: A total of 163 patients with COPD exacerbation were included in the cross-sectional study. All patients underwent the following on the same day: FeNO test, spirometry, bronchodilator reversibility test, induced sputum, and routine blood test. They were classified as eosinophilic group or noneosinophilic group based on sputum eosinophilic percentage (=2.5%)/FeNO levels (=32 parts per billion [ppb]).
Results: FeNO levels and blood eosinophilic percentage were higher in patients with sputum eosinophilia (n=62) compared to those without (31.35 ppb versus 21.43 ppb, P=0.015; 2.71% versus 0.98%, P<0.0001, respectively). Sputum eosinophilic percentage was higher with raised FeNO (n=34) compared to those with FeNO <32 ppb (5.12% versus 3.12%, P=0.007). Eosinophils in induced sputum correlated with both FeNO levels (ρ=0.221, P=0.005) and blood eosinophilic percentage (ρ=0.399, P<0.001). There was no relationship between FeNO and blood eosinophilic percentage. Blood eosinophilic percentage was predictive of sputum eosinophilia (95% confidence interval [CI] =0.65–0.81, P<0.001) at a cutoff point of 0.65% (sensitivity =73%, specificity =61.3%). FeNO levels were predictive of sputum eosinophilia (95% CI =0.53–3,071, P=0.012) at a cutoff point of 17.5 ppb (sensitivity =65.1%, specificity =56.4%).
Conclusion: The clinical relevance of this study provides evidence that inflammatory biomarkers, including sputum eosinophilic percentage, FeNO level, and blood eosinophilic percentage, can be used to positively diagnose eosinophilic COPD. The FeNO level and blood eosinophilic counts/percentage, which determine an optimal cutoff for sputum eosinophilia, need more studies.
Keywords: fractional exhaled nitric oxide, eosinophils in induced sputum, blood eosinophil percentage, chronic obstructive pulmonary disease
Introduction
Assessment of airway inflammation is normally recognized as an important aspect in the diagnosis and clinical control of asthma, but is not considered for chronic obstructive pulmonary disease (COPD). Both of them are considered as chronic airway inflammatory diseases, typically associated with Th2-mediated immune response in asthma and related to the characteristic of Th1-mediated immunity in COPD.1 Subsequently, while eosinophilic airway inflammation is the hallmark feature of airway inflammation in asthma, COPD is typically associated with a neutrophilic response in airway inflammation, which is often because of bacterial colonization. However, this classical pathway probably represents only half of the patients with COPD, and in up to 10%–40% mixed inflammatory pattern with increased eosinophils (defined as sputum eosinophils >3%) is a feature, especially where there is clinical overlap with asthma.2,3
Measurement of airway eosinophilia is a reliable predictive index of responsiveness to inhaled corticosteroid (ICS) and oral corticosteroid therapies in patients with COPD. Eosinophilic airway inflammation can be measured through the airway noninvasively by induced sputum analysis and fractional exhaled nitric oxide (FeNO).4 Both are considered as a direct, reliable, sensitive, simple, and repeatable method of assessing inflammatory phenotypes, widely used in clinical practice. And the 2017 Global Initiative for Chronic Obstruction Lung Disease (GOLD) recently published an evidence-based clinical research guideline that sputum eosinophils and blood eosinophilic counts/percentage can predict the risk of exacerbations.5 In 2016, the normal reference values of induced sputum cytology in China, defined as sputum eosinophils ≥2.5%%, and increases in FeNO levels (≥32 ppb), were identified as airway eosinophilia.6 Nevertheless, the clinical application of the correlation between FeNO levels and sputum eosinophilia or peripheral blood eosinophilic percentage is controversial.
The aim of this study was to assess the correlation between sputum eosinophils, FeNO levels, and peripheral blood eosinophilic percentage in patients with COPD and to determine the accuracy of these biomarkers as indicators of airway inflammatory phenotypes in these patients.
Methods
Study design
The aim of the study was to discuss the correlation between eosinophilic percentage in induced sputum, peripheral blood eosinophilic percentage, and FeNO levels in patients with COPD exacerbation. Data were collected during regular clinical practice and medical procedures.
Subjects
Patients diagnosed to have acute exacerbations of COPD visiting The Third People’s Hospital of Guangzhou Medical College in Huizhou from March 2016 to January 2017 were retrospectively enrolled in the study. The severity and GOLD stage of COPD were defined according to the 2017 recommendation of GOLD. We excluded patients if they had a pulmonary infection within 4 weeks; had used any oral corticosteroid in the previous 4 weeks; had a confounding pulmonary comorbidity such as a pulmonary tuberculosis, an interstitial lung disease, a lung cancer, or a possible overlap with asthma; had a cognitive impairment that may affect the collaboration or comprehension of the study.
Ethics statement
The Institutional Review Board of the Third People’s Hospital of Guangzhou Medical College in Huizhou approved the study protocol and absolved the need for written informed consent from patients as the study was a retrospective study, personal identification data were anonymized.
Assessments and study procedures
On the same day the following tests or determinations were performed: FeNO test, pulmonary function test (PFT), bronchodilator reversibility test, induced sputum, and routine blood test. Clinical variables were recorded for the participants.
Measurement of FeNO: FeNO level was measured before PFT according to the guidelines in the user manual training on the NO electrochemical equipment (NIOX VERO; Aerocrine AB, Solna, Sweden). Patients were required to refrain from eating, drinking, and smoking for at least 1 hour prior to the FeNO measurement. Patients were instructed to inhale NO-free air to total lung capacity and immediately exhale fully into the device at a sustained flow rate of 50 mL/s for 6 or 10 seconds, which resulted in display of FeNO value.6 A significant increase in FeNO was considered if the FeNO value was equal to or higher than 32 parts per billion (ppb).7
PFT: Airway limitation was performed using Lung Function Machine (MS-pneumo + aps; JAEGER; German) by the experienced technician in accordance with the 2014 recommendations of the Chinese National Guidelines of Pulmonary Function Test. Percentage predicted values (%pred) were calculated based on the reference values for healthy Chinese adults. All patients were required to undergo PFT in a reproducible way, and the best values were retained.8
Bronchodilator reversibility test: patients were asked to inhale 400 μg salbutamol through a metered dose inhaler after baseline evaluation, and PFT was repeated in not <20 minutes. Three forced expiratory maneuvers were recorded. Postbronchodilator forced expiratory volume in 1 second/forced vital capacity (FEV1/FVC) <70% and the negative response, defined as FEV1 <200 mL and FEV1 <12% after salbutamol inhalation, were obtained.8
Sputum induction: After bronchodilator reversibility test, sputum was induced with hypertonic saline inhalation through ultrasonic atomizer. A single hypertonic saline (3% NaCl) was used. Patients were asked to inhale 400 μg salbutamol through a metered dose inhaler at 20 minutes before induction. The collected lower respiratory (trachea and bronchi), except nasal cavity, pharynx, larynx and oral cavity were dispersed using 0.1% dithiothreitol with water bath and oscillator at 15 minutes before 300 mesh nylon mesh filter, and subsequently, total cell count was centrifuged, smeared, and stained (hematoxylin-eosin). A differential cell count was obtained from 400 cells with a 400× microscope to identify the severity and type of airway inflammation in patients with COPD. Squamous cell count <10% in each sample was deemed adequate for further analysis. We defined the sputum eosinophilic percentage ≥2.5 as abnormal.7
Blood collection and analysis: Peripheral venous blood was measured using Automated Hematology Blood Analyzer (ABX Pentra DF120–1; ABX, France). The results of blood eosinophilic count/ratio, defined as normal number of white blood cells in peripheral blood (4–10×109/L), were obtained.
Statistical analysis
Data analysis were performed by using SPSS 19. Continuous variables were expressed as mean ± standard deviation (SD), and categorical variables as frequencies and percentages. Data were analyzed with the Student’s t-test for quantitative variables and the chi-square test for categorical variables. The relationship between FeNO, eosinophil ratios in induced sputum, and eosinophil ratios in peripheral blood was assessed with the Spearman’s correlation coefficient. The correlation between tests was performed by constructing receiver operating characteristic (ROC) curve. The optimal cutoff value was determined from the highest sum of sensitivity and specificity. Statistical significance was defined as P<0.05.
Results
Characteristics of the patients
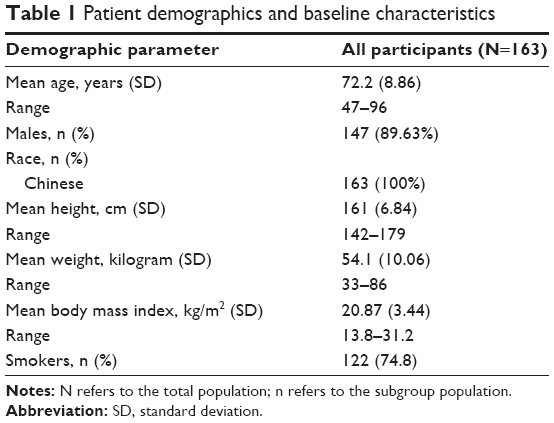
Patient demographic information is presented in Table 1. A total of 163 patients with COPD exacerbation were included in this study. The mean age was 72.2 years with a range between 47 and 96 years. There were 147 (89.63%) men. Smokers accounted for 74.8% of patients. All participants were Chinese.
 | Table 1 Patient demographics and baseline characteristics |
PFT results are reported in Table 2. Patients with COPD had a mean FEV1/FVC percentage of 48.87±12.08 and a mean FEV1% predicted of 45.81±21.43. FEV1% predicted values indicated severe degree of obstructive lung disease. As expected in this study, the patients in such a state have severe impairment.
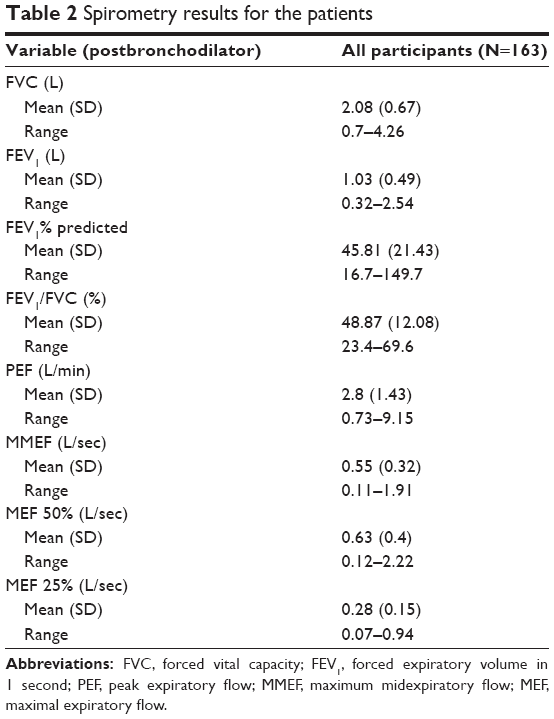 | Table 2 Spirometry results for the patients |
Sputum induction
Eosinophilic airway inflammation (sputum eosinophilia ≥2.5%) was present in 62 (38.04%) participants. The characteristics of patients are shown in Table 3. Patients in eosinophilica group as compared with patients in noneosinophilicb group showed significantly higher FeNO values (mean [SD] 31.35 [37] versus 21.43 [22.4], P=0.015), eosinophil ratios in peripheral blood (mean [SD] 2.71 [2.9] versus 0.98 [1.37], P<0.001), and eosinophil count in peripheral blood (mean [SD] 0.18 [0.19] versus 0.07 [0.11], P<0.001).
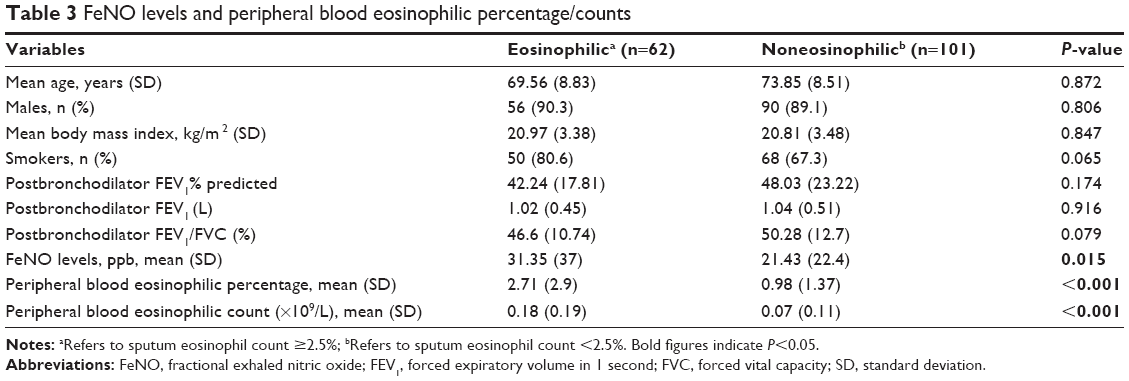 | Table 3 FeNO levels and peripheral blood eosinophilic percentage/counts |
FeNO
FeNO levels equal to or higher than 32 ppb were present in 34 (20.86%). The characteristics of patients are shown in Table 4. Patients in eosinophilica group as compared with patients in noneosinophilicb group showed a nonsignificant result in eosinophilic cell in peripheral blood ratios and count, but significantly higher eosinophil ratios in induced sputum (mean [SD] 5.12 [7.15] versus 3.12 [5.8], P=0.007).
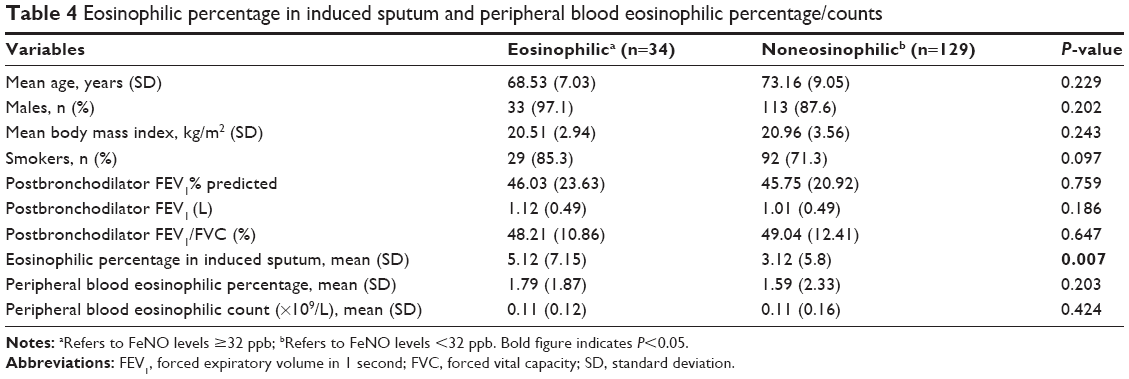 | Table 4 Eosinophilic percentage in induced sputum and peripheral blood eosinophilic percentage/counts |
Peripheral blood eosinophil
Eosinophilic percentage in peripheral blood ≥1 was present in 71 (43.56%) patients. The characteristics of patients are shown in Table 5. Patients in eosinophilica group as compared with patients in noneosinophilicb group showed a significantly higher eosinophil count in induced sputum (mean [SD] 5.72 [7.54] versus 1.97 [4.17], P<0.001) and eosinophil count in peripheral blood (mean [SD] 0.23 [0.17] versus 0.02 [0.04], P<0.001). Nonetheless, FeNO level was with a nonsignificant result.
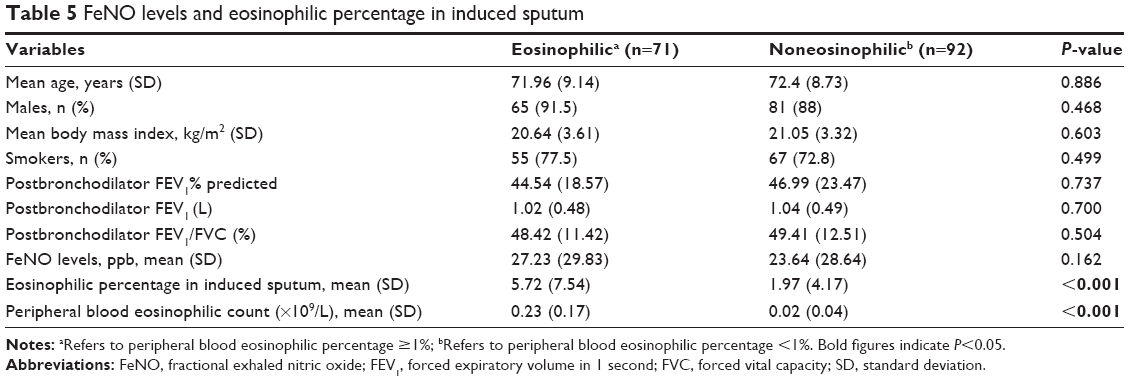 | Table 5 FeNO levels and eosinophilic percentage in induced sputum |
Correlation between FeNO levels, eosinophil in induced sputum, and eosinophil in peripheral blood
A significant correlation was found between sputum eosinophils and FeNO values (ρ=0.221; P=0.005; Figure 1A) and blood eosinophil ratio (ρ=0.399; P<0.001) (Figure 1B). No significant association was observed between FeNO values and blood eosinophil ratio (ρ=0.094; P=0.233).
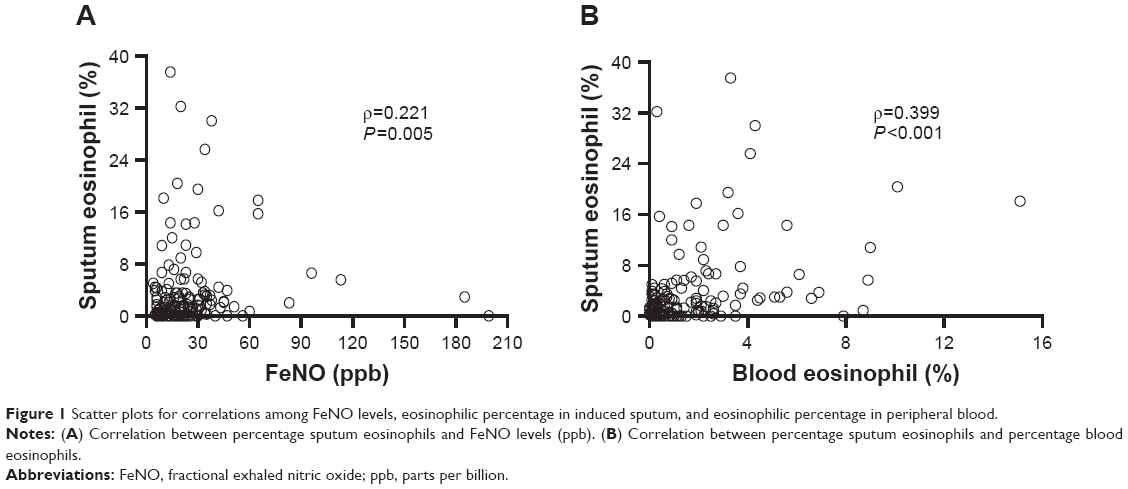 | Figure 1 Scatter plots for correlations among FeNO levels, eosinophilic percentage in induced sputum, and eosinophilic percentage in peripheral blood. |
ROC curve analysis demonstrated that 17.5 ppb was the best diagnostic cutoff value of FeNO level for sputum eosinophilia (area under the curve [AUC] 0.617; 95% confidence interval [CI] 0.53–0.71). Sensitivity and specificity of 17.5 ppb for the diagnosis of sputum eosinophils were 64.5% and 56.4%, respectively. In addition, ROC curve analysis showed that 0.65% was the best diagnostic cutoff value of blood eosinophil ratio for sputum eosinophilia (AUC 0.729; 95% CI 0.65–0.81). Sensitivity and specificity at a cutoff point of 0.65% for the diagnosis of sputum eosinophils were 74.2% and 61.4%, respectively (Figure 2).
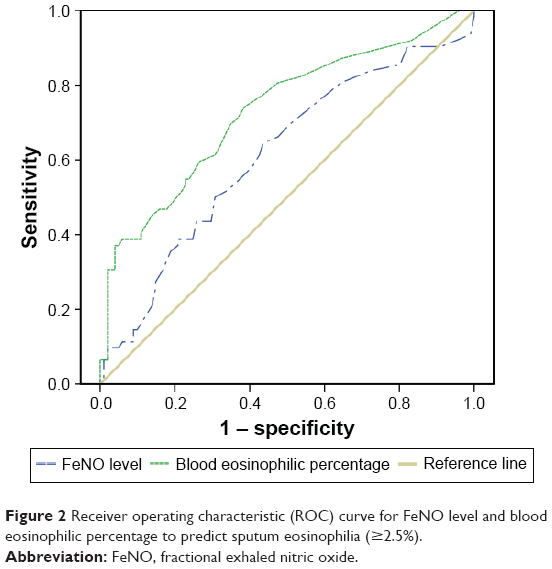 | Figure 2 Receiver operating characteristic (ROC) curve for FeNO level and blood eosinophilic percentage to predict sputum eosinophilia (≥2.5%). |
Discussion
This cross-sectional analytical study assessed the correlation of FeNO levels and sputum eosinophilia in exacerbations of COPD. One hundred sixty-three patients had an increase in cough, sputum/purulent sputum, and dyspnea beyond normal day-to-day variation, and it was acute in onset and necessitated a change in regular medication.5 All the people in the study were Chinese.
Following the 2015 recommendations of the Chinese National Guidelines on Diagnosis and Management of Cough,7 eosinophilic airway inflammation was defined as percentage of eosinophil count ≥2.5 in induced sputum. As shown in Table 3, the FeNO level, peripheral blood eosinophil percentage, and counts between eosinophilica group and noneosinophilicb group were significantly different. Although induced sputum has been considered the “gold standard” for phenotyping airway inflammation, measurement of FeNO has achieved wide acceptance in routine clinical practice because it is easy to perform and readily available readout. The 2014 recommendation also suggested that a significant increase in eosinophil sputum (≥2.5%) was considered if the FeNO value was ≥32 ppb. As shown in Table 4, the percentage of eosinophil count between eosinophilica group and noneosinophilicb group was significantly different; however, the difference in peripheral blood eosinophilic percentage/count was not statistically significant. According to the 2017 recommendation of GOLD, which recently published an evidence-based clinical research guideline, eosinophils, such as in induced sputum or peripheral venous blood, can predict the risk of exacerbations.5 We predicted that a sputum eosinophilia (≥2.5%) was considered if the peripheral blood eosinophil percentage was ≥1. As shown in Table 5, the eosinophil sputum percentage and peripheral blood eosinophil count of eosinophilica group and noneosinophilicb group were significantly different; however, the difference between the FeNO levels in the two groups was not statistically significant.
Our study was performed in a larger sample of patients with COPD exacerbations and it provided an evidence of a positive correlation between FeNO, sputum eosinophilia, and eosinophilic percentage in the peripheral blood. Soter et al reported that FeNO levels (19 ppb) can help correctly identify the presence or absence of sputum eosinophilia (≥3%) (AUC 0.89, sensitivity =90%, specificity =74%).9 Our present optimal cutoff point (17.5 ppb) is similar to this optimal cutoff point (19 ppb) in COPD with exacerbations, but the sensitivity and specificity in this study are different (sensitivity =65.1%, specificity =56.4%). These results showed that FeNO value was to distinguish the patients with COPD at exacerbations with sputum eosinophilia from those without, thereby indicating its potential use as a diagnostic biomarker for eosinophilic COPD. However, the cutoff value has been a question in dispute because normal or low FeNO levels do not exclude the presence of disease. Optimal cutoff points by calculating sensitivity and specificity on an ROC curve to assess diagnostic biomarkers of eosinophilic airway inflammation may not be clinically applicable, given that their sensitivity and/or specificity is often suboptimal compared to that of reference standard tests.10 In view of this, we have evaluated the sensitivity and specificity of FeNO levels at different cutoff points (Table 6): at cutoff points of 26 ppb or 32 ppb, sensitivity and specificity of 2.5% for the diagnosis of sputum eosinophils were 39.7% and 75.2%, and 28.5% and 84.2%, respectively.
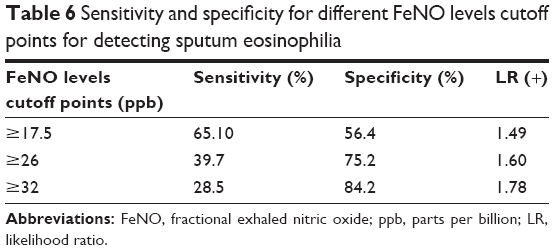 | Table 6 Sensitivity and specificity for different FeNO levels cutoff points for detecting sputum eosinophilia |
The 2017 GOLD recently published an evidence-based clinical research guideline that blood eosinophilic counts/percentage may be a biomarker of exacerbation risk in patients with a history of exacerbation and can predict the effects of ICS on exacerbation prevention.5 One study in stable COPD has shown that peripheral blood eosinophil count (≥0.3×10⁹/L) can serve as a diagnostic biomarker of sputum eosinophilia (≥3%) (AUC 0.76 [95% CI =0.67–7.84], sensitivity =76%, specificity =60%).11 This AUC is similar to our present AUC in COPD at exacerbations.
This finding also indicates that blood eosinophil percentage has a higher relevance than FeNO level with eosinophil sputum in patients with COPD. However, there was no correlation between FeNO level and blood eosinophil ratios/count. In clinical practice, there is a tendency to generalize the correlation between FeNO level and eosinophilic percentage in induced sputum. Although the two methods are useful to assess the eosinophilic airway inflammation,12–14 there are confounding factors that may affect FeNO values in many cases.6 Furthermore, FeNO has a limited value to assess the neutrophilic airway inflammation, and bronchial induced sputum cytology provides a more accurate approximation of airway inflammation phenotypes in COPD patients than FeNO.
Conclusions
The clinical relevance of this study provides evidence that inflammatory biomarkers, including sputum eosinophilia, FeNO value, and blood eosinophil percentage/counts, can be used to positively diagnose eosinophilic COPD. These data may be useful for identifying patients with airway inflammation phenotypes who will have a beneficial response to treatment with an ICS, and it is important to help guide treatment and management of COPD patients. However, further studies are required to validate the use of FeNO levels and blood eosinophilic counts/percentage to determine an optimal cutoff for sputum eosinophilia that predicts future exacerbation risk in patients with COPD exacerbation history and the cutoff values that could be used in clinical practice.
Acknowledgments
We would like to thank Dr Ziwen Zhao for his comments and discussion.
Disclosure
The author reports no conflicts of interest in this work.
References
Eltboli O, Brightling CE. Eosinophils as diagnostic tools in chronic lung disease. Expert Rev Respir Med. 2013;7(1):33–42. | ||
Brightling CE, Bleecker ER, Panettieri RA Jr, et al. Benralizumab for chronic obstructive pulmonary disease and sputum eosinophilia: a randomised, double-blind, placebo-controlled, phase 2a study. Lancet Respir Med. 2014;2(11):891–901. | ||
Eltboli O, Bafadhel M, Hollins F, et al. COPD exacerbation severity and frequency is associated with impaired macrophage efferocytosis of eosinophils. BMC Pulm Med. 2014;9(14):112. | ||
Donohue JF, Herje N, Crater G, Rickard K. Characterization of airway inflammation in patients with COPD using fractional exhaled nitric oxide levels: a pilot study. Int J Chron Obstruct Pulmon Dis. 2014;16(9):745–751. | ||
The Global Strategy for the Diagnosis, Management and Prevention of COPD [webpage on the Internet]. Global Initiative for Chronic Obstructive Lung Disease (GOLD) 2017. Available from: http://www.goldcopd.org/. Accessed October 16, 2016. | ||
Dweik RA, Boggs PB, Erzurum SC, et al. An official ATS clinical practice guideline: interpretation of exhaled nitric oxide levels (FENO) for clinical applications. Am J Respir Crit Care Med. 2011;184(5):602–615. | ||
The Chinese national guidelines on diagnosis and management of cough (2015). Chin Med J. 2016;39(5):321–339. | ||
The Chinese national guidelines of pulmonary function test (2014). Chin Med J. 2014;37(9):655–658. | ||
Soter S, Barta I, Antus B. Predicting sputum eosinophilia in exacerbations of COPD using exhaled nitric oxide. Inflammation. 2013;36(5):1178–1185. | ||
Korevaar DA, Westerhof GA, Wang J, et al. Diagnostic accuracy of minimally invasive markers for detection of airway eosinophilia in asthma: a systematic review and meta-analysis. Lancet Respir Med. 2015;3(4):290–300. | ||
Negewo NA, McDonald VM, Baines KJ, et al. Peripheral blood eosinophils: a surrogate marker for airway eosinophilia in stable COPD. Int J Chron Obstruct Pulmon Dis. 2016;1(11):1495–1504. | ||
Berry MA, Shaw DE, Green RH, Brightling CE, Wardlaw AJ, Pavord ID. The use of exhaled nitric oxide concentration to identify eosinophilic airway inflammation: an observational study in adults with asthma. Clin Exp Allergy. 2005;35(9):1175–1179. | ||
Lex C, Ferreira F, Zacharasiewicz A, et al. Airway eosinophilia in children with severe asthma: predictive values of noninvasive tests. Am Respir Crit Care Med. 2006;174(12):1286–1291. | ||
Schleich FN, Seidel L, Sele J, et al. Exhaled nitric oxide thresholds associated with a sputum eosinophil count 3% in a cohort of unselected patients with asthma. Thorax. 2010;65(12):1039–1044. |
 © 2017 The Author(s). This work is published and licensed by Dove Medical Press Limited. The
full terms of this license are available at https://www.dovepress.com/terms
and incorporate the Creative Commons Attribution
- Non Commercial (unported, 3.0) License.
By accessing the work you hereby accept the Terms. Non-commercial uses of the work are permitted
without any further permission from Dove Medical Press Limited, provided the work is properly
attributed. For permission for commercial use of this work, please see paragraphs 4.2 and 5 of our Terms.
© 2017 The Author(s). This work is published and licensed by Dove Medical Press Limited. The
full terms of this license are available at https://www.dovepress.com/terms
and incorporate the Creative Commons Attribution
- Non Commercial (unported, 3.0) License.
By accessing the work you hereby accept the Terms. Non-commercial uses of the work are permitted
without any further permission from Dove Medical Press Limited, provided the work is properly
attributed. For permission for commercial use of this work, please see paragraphs 4.2 and 5 of our Terms.