Back to Journals » Clinical Ophthalmology » Volume 13
Correlation between body mass index and ocular parameters
Authors Panon N ![]() , Luangsawang K, Rugaber C, Tongchit T, Thongsepee N, Cheaha D, Kongjaidee P, Changtong A, Daradas A, Chotimol P
, Luangsawang K, Rugaber C, Tongchit T, Thongsepee N, Cheaha D, Kongjaidee P, Changtong A, Daradas A, Chotimol P
Received 30 November 2018
Accepted for publication 14 March 2019
Published 30 April 2019 Volume 2019:13 Pages 763—769
DOI https://doi.org/10.2147/OPTH.S196622
Checked for plagiarism Yes
Review by Single anonymous peer review
Peer reviewer comments 2
Editor who approved publication: Dr Scott Fraser
Nisa Panon,1 Kanin Luangsawang,2 Christopher Rugaber,1 Trinnawat Tongchit,1 Nattaya Thongsepee,3 Dania Cheaha,4 Pongnugoon Kongjaidee,5 Akawan Changtong,5 Adithep Daradas,5 Phatiwat Chotimol6
1Faculty of Optometry, Rangsit University, Pathumthani, Thailand; 2Department of Ophthalmology, Faculty of Medicine, Naresuan University, Phitsanulok, Thailand; 3Department of Preclinical Sciences (Physiology), Faculty of Medicine, Thammasat University, Pathumthani, Thailand; 4Department of Biology, Faculty of Science, Prince of Songkla University, Hat Yai, Thailand; 5Department of Optometry, Faculty of Allied Health Sciences, Naresuan University, Phitsanulok, Thailand; 6Department of Cardio-Thoracic Technology, Faculty of Allied Health Sciences, Naresuan University, Phitsanulok, Thailand
Purpose: To investigate the relationship between BMI and selected ocular parameters.
Subjects and methods: Fifty-three left eyes of normal weight subjects and 67 age-sex matched overweight subjects were studied. Inclusion criteria for the normal weight and overweight groups included BMI between 18.5–22.9 and 23.0–29.9 kg/m,2 respectively. Subjects with a history of systemic disease, ocular disease or surgery, or disability were excluded. All subjects underwent a medical history interview, arterial blood pressure, height, weight, waist circumference and hip circumference measurements, and BMI and waist-hip ratio calculation. The intraocular pressure (IOP) and anterior corneal curvature were measured by non-contact tonometry and corneal topography, respectively. Measurement of anterior and posterior segment parameters of the eye, including central corneal thickness, anterior chamber depth (ACD), anterior chamber angle, macular thickness (MT), ganglion cell thickness (GCT), retinal nerve fiber layer thickness, cup to disc ratio, and choroidal thickness was performed by enhanced depth-imaging optical coherence tomography.
Results: There was a positive correlation between ACD and BMI (Univariate analysis; β =0.198, P=0.030, Multivariate analysis; β =0.410, P=0.005) and between BMI and IOP (Univariate analysis; β =0.269, P=0.003). The IOP of the overweight group was found to be significantly higher than of the normal weight group (12.80±3.40 and 11.86±2.12 mm Hg, respectively, P=0.002). Also, there was a significant difference found between the GCT and the MT of the two groups (P=0.036 and 0.009, respectively).
Conclusion: It was found that BMI strongly correlated with ACD and IOP. Also, the degree of obesity was found to be a significant factor; therefore, the relationship between these ocular parameters and the severity of obesity should be further investigated.
Keywords: BMI, overweight, intraocular pressure, anterior chamber depth
Introduction
Obesity is currently a major worldwide public health problem that is increasing in prevalence in most countries. A 2016 study by the WHO found that worldwide, more than 1.9 billion and 650 million people are, respectively, overweight or obese.1 In Thailand, it has been reported that 4.9% of the population is obese.2 BMI is commonly used to classify degree of obesity. The WHO has developed a BMI classification system defining underweight, normal body weight, overweight, and obesity as a BMI of 18.5 kg/m2 or lower, 18.5–22.9 kg/m2, 23–29.9 kg/m2, and 30 kg/m2 or greater, respectively.3
Obesity is not only a critical risk factor for several chronic diseases including diabetes mellitus, hypertension, cardiovascular disease, stroke, sleep apnea syndrome but also affects quality of life.4–6 It has been found that obesity may be linked to a reduction in visual acuity.7 Moreover, several lines of evidence indicate that obesity is associated with several ocular diseases including cataract, age-related macular degeneration, diabetic retinopathy, and glaucoma.8–13 Several processes and risk factors, or oxidative stress, may induce pathophysiology resulting in anterior and/or posterior segment disease in the obese.9 Previous studies have found a correlation between BMI and anterior segment parameters in obese individuals. For example, it was found that anterior chamber depth (ACD) and anterior chamber angle (ACA) were negatively correlated with BMI.14 Other studies have investigated relationships between retinal nerve fiber layer thickness (RNFLT), BMI, and age.15,16 In addition, a positive correlation between BMI and choroidal thickness (CT) changes has been found in obese women.17 It seems that previous studies focused on either anterior segment or posterior segment parameters associated with obesity, but not both. The impact of obesity on both the anterior and posterior segment parameters of the eye has not been well documented, and information regarding their relationship with BMI is unclear. Moreover, all parameters of the eye are clinically important, as they may provide valuable data that could be used to analyze the pathophysiological mechanisms associated with any increased risk of ocular pathology in obese individuals.
This study aim was to investigate the relationship between the BMI and selected ocular parameters, via a comparison of findings between normal weight and overweight Thai subjects. Parameters studied included central corneal thickness (CCT), intraocular pressure (IOP), anterior corneal curvature (ACC), ACD, ACA, macular thickness (MT), ganglion cell thickness (GCT), RNFLT, cup to disc ratio (CDR), and CT.
Subjects and methods
This study was conducted in accordance with the tenets of the Declaration of Helsinki, and the experimental protocol was approved by the Ethical Committee of Naresuan University, Phitsanulok, Thailand (COA No. 352/2016). The participant consent was written informed consent.
Subjects
One hundred and twenty left eyes of 120 subjects were divided into two groups. Fifty-three eyes were in the normal weight group (21–69 years old), of whom 35.85% were male. The overweight group consisted of 67 age-sex matched (21–61 years old), of whom 49.25% were male. Inclusion criteria for the normal weight and overweight groups were a BMI between 18.5–22.9 and 23.0–29.9 kg/m2, respectively. Subjects with a diagnosis of systemic diseases such as diabetes mellitus, hypertension, ocular disease (of both anterior and posterior segments), cataract or glaucoma, etc.; subjects with a history of ocular surgery or insufficiently cooperative for OCT measurement; or those with a history of any condition that could potentially impact BMI were excluded from this study.
Methods
All subjects underwent a physical examination including medical history, arterial blood pressure, height, weight, waist and hip circumference measurement, and waist-hip (W/H) ratio calculation. The BMI was calculated as weight in kilograms divided by the height in meters squared (kg/m2). Intra-ocular pressure was measured using a Canon TX-20P non-contact tonometer, and ACC was measured using an ATLAS model 9000 corneal topographer.
Measurement of anterior and posterior segmental parameters of the eye, including CCT, ACD, ACA, MT, CDR, GCT, RNFLT, and CT were performed using a CIRRUS HD-OCT 5000 optical coherence tomographer (OCT). Subfoveal CT was recorded using the enhanced depth imaging mode as the vertical distance between the chorioscleral and retinal pigment epithelium layers.18
Statistical analysis
The distribution of data from left eyes was analyzed using the Kolmogorov–Smirnov test and shown as mean ± SD or median ± IQR, frequencies or absolute numbers and percentage (%). The group differences of continuous variables were compared using an independent t-test or Mann–Whitney U test. Univariate comparisons were computed using Chi-square test for categorical variables. The degree of association between BMI and selected ocular parameters was calculated using simple regression and stepwise multiple regression analysis. The statistical significance level was P-value <0.05. All data were analyzed using the SPSS 17.0 software.
Results
The demographic characteristics of subjects are shown in Table 1. The systolic blood pressure (SBP) and diastolic blood pressure (DBP) of the overweight group were significantly higher than those of the normal weight groups (SBP; 129.78±17.09 and 119.58±15.71 mm Hg (P=0.001), DBP; 84.20±12.88 and 76.45±8.56 mm Hg (P<0.001), respectively). The BMI and W/H ratio of the overweight group were significantly higher than those of the normal weight group (BMI; 26.67±5.26 kg/m2 and 20.89±1.15 kg/m2, W/H ratio; 0.89±0.06 and 0.85±0.09, respectively, P<0.001) There was no significant difference in age, gender distribution, percentage of alcohol consumption, and current smoking status between the two groups.
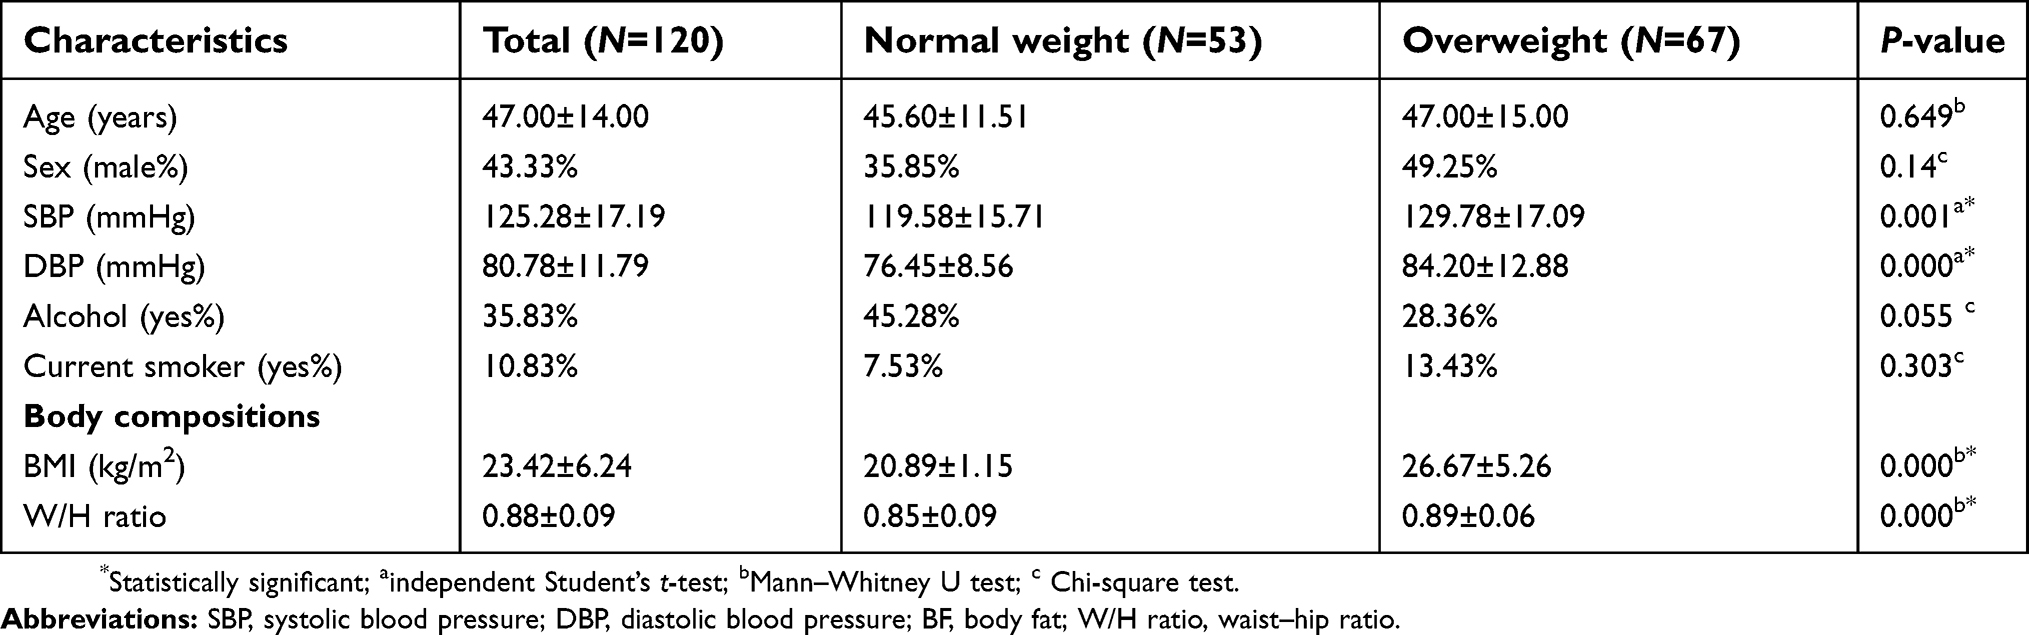 | Table 1 Demographic data |
Regarding the anterior segment (AC) parameters, it was found that the IOP of the overweight group was significantly higher than that of the normal weight group (12.80±3.40 and 11.86±2.12 mm Hg, respectively, P=0.002). There was no significant difference in other AC parameters (HACC, VACC, CCT, ACD, and ACA) between groups (Table 2).
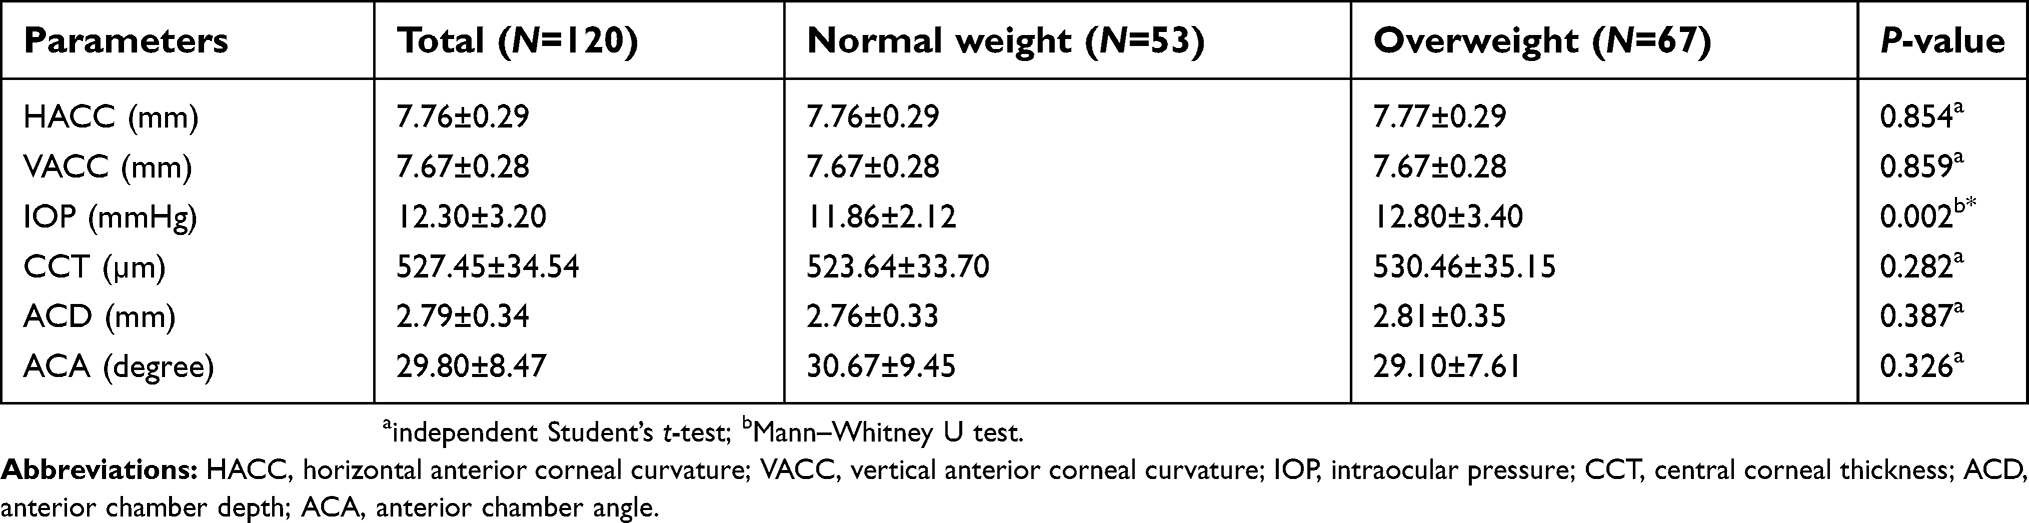 | Table 2 Comparison of anterior segment parameters of eyes between groups |
Regarding the posterior segment parameters, a significant difference between overweight and normal weight groups was found in both GCT and MT (P=0.036 and 0.009, respectively). No significant difference in RNFLT, CT, or CDR was found between groups (Table 3).
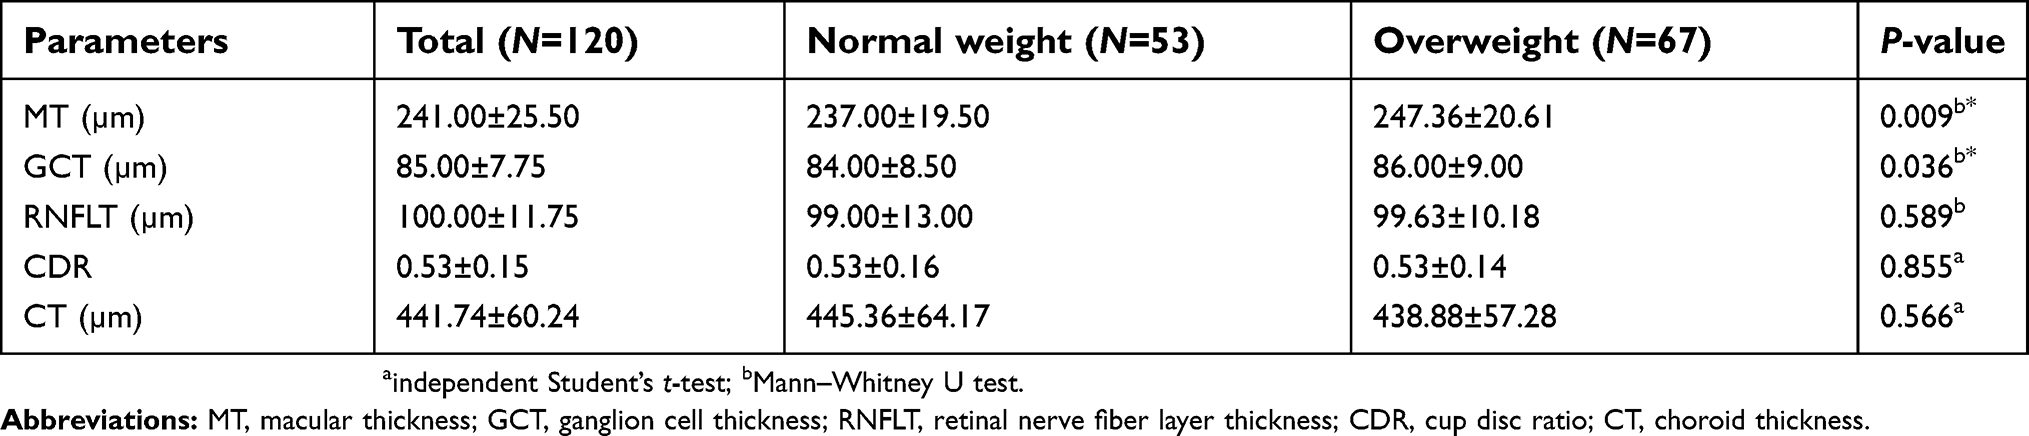 | Table 3 Comparison of posterior segment parameters of eyes between groups |
Univariate analysis found a correlation between the BMI and IOP (β =0.269, P=0.003) as well as BMI and ACD (β =0.198, P=0.030). Multivariable analysis found that BMI correlated with ACD (β =0.410, P=0.005). No correlation was found between BMI and posterior segment ocular parameters (Table 4). A correlation between BMI and IOP, positive correlation between BMI and ACD, is shown on the scatterplot distribution (Figures 1 and 2).
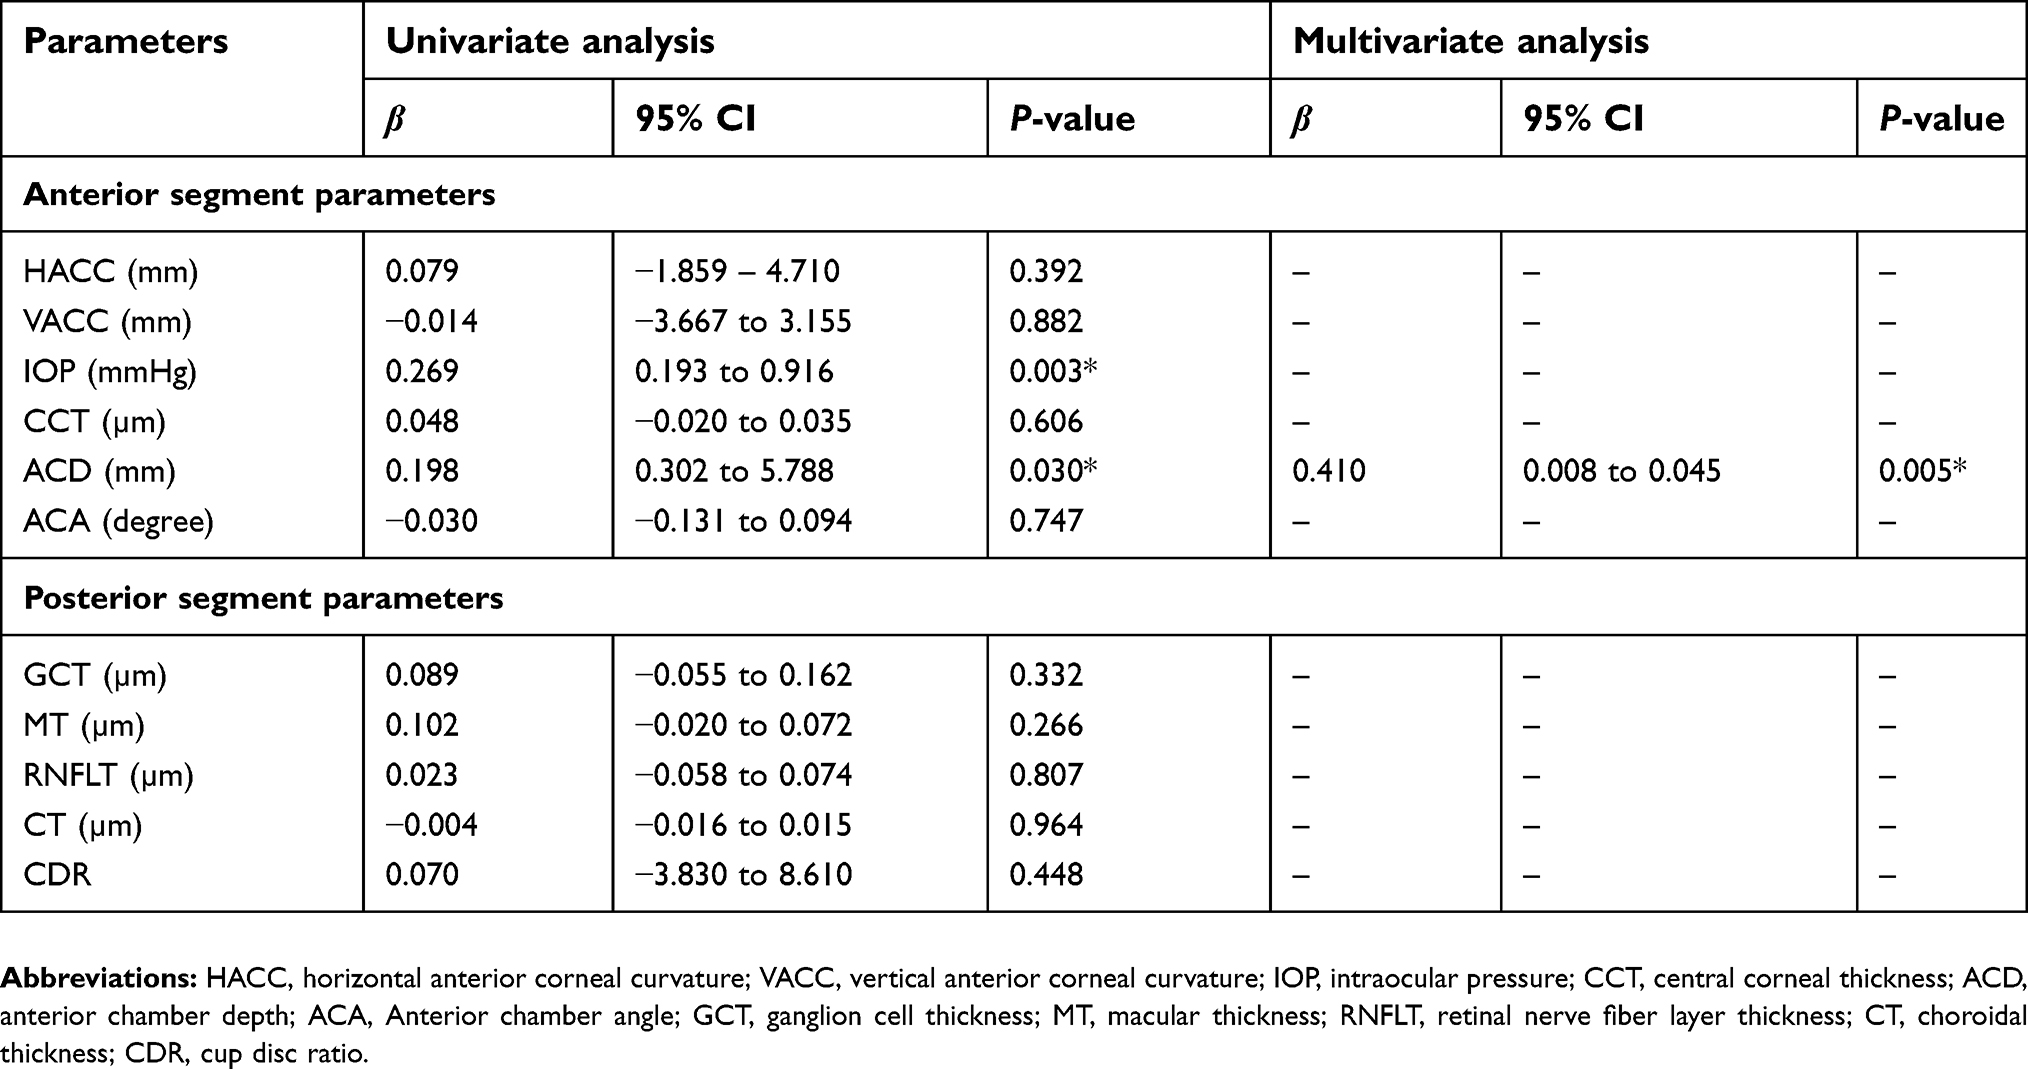 | Table 4 Correlation between BMI and parameters of eyes |
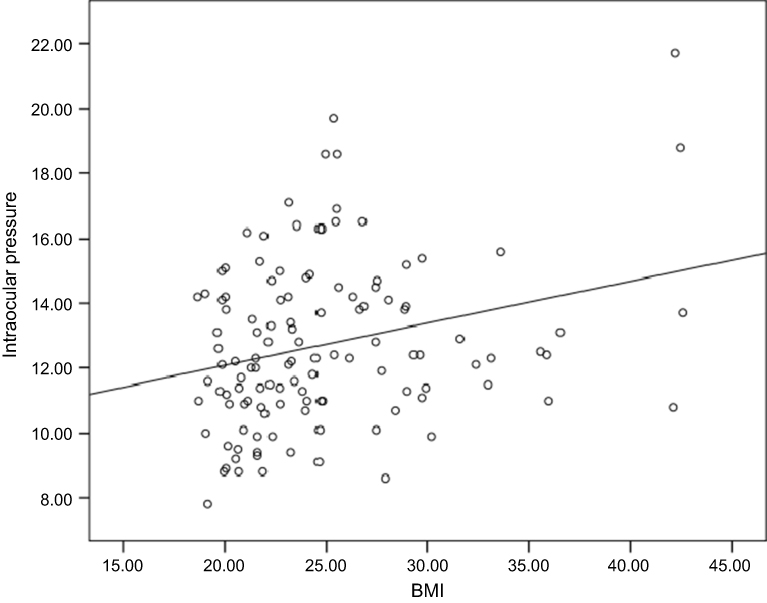 | Figure 1 Correlation between BMI and intraocular pressure. |
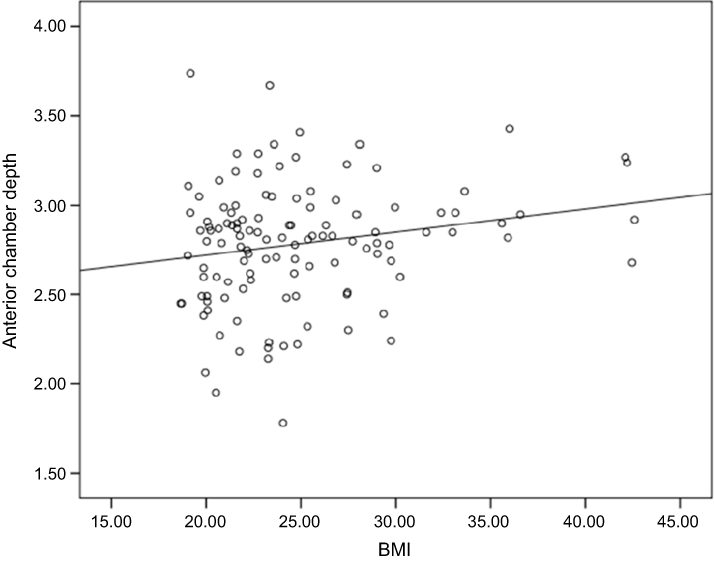 | Figure 2 Correlation between BMI and anterior chamber depth. |
Discussion
This research is the first study of the association between both anterior and posterior segment ophthalmic parameters and BMI in a Thai population. We found that the BMI and the W/H ratio of the overweight subjects were significantly higher than those in the normal subjects (P<0.001). The SBP and the DBP of the overweight group were both significantly higher than in normal group.
It was demonstrated that the IOP, GCT, and MT in overweight subjects were significantly higher than in normal weight subjects. Interestingly, the BMI showed a significant correlation with IOP and ACD, whereas the HACC, VACC, CCT, ACD, ACA, RNFLT, CT, and CDR values between the overweight and normal weight subjects were similar.
It was also found that the IOP significantly increased in the overweight subjects. Moreover, the overweight subjects also had a significant positive correlation between IOP and BMI (β=0.269, P=0.003). This finding is consistent with several previous reports.14,19,20 IOP elevation in overweight subjects may be due to several mechanisms. An increased presence of periorbital fat increases pressure and decreases aqueous outflow, which increases IOP.21 Also, obesity may be associated with increased blood leptin levels that may cause oxidative damage to the trabecular meshwork that reduces aqueous outflow.22 Finally, blood viscosity increases associated with obesity may lead to increased episcleral venous pressure, which could reduce aqueous outflow and result in elevated IOP.23,24
The correlation between CCT and IOP is well known, with greater CCT being associated with higher IOP.25,26 However, this study was found no significant difference in CCT between the two groups, a finding also reported by Sahinoglu-Keskek et al. The CCT in metabolic syndrome patients and normal subjects was similar.27 On the other hand, several researchers have reported elevated CCT values in high BMI subjects.25,26 Su et al suggested that cornea thickness is greater in people with high BMI,26 which may elevate IOP as measured by the air puff technique. Data from this study confirmed a correlation between IOP and BMI, but found no relationship between BMI and CCT. This may be because the groups compared were age-matched, eliminating the factor of a CCT decrease of about 5.1 µm per 10 years of aging.28
A strong correlation was found between ACD and BMI (univariate analysis: β =0.198, P=0.030; multivariate analysis: β =0.410, P=0.005), which is inconsistent with a previous study.14 These may be because there was no significant age difference between the two study groups, eliminating age-related crystalline lens thickening as a factor that reduces ACD.29–32 A limitation of this study was the lack of the axial length data, which might provide further insights into possible ACD differences between the two groups.
The present study found higher GCT and MT values in the elevated BMI group when compared to the normal BMI group. No differences in RNFLT or CDR were found between these groups. In comparison, a reduction of CGT in obesity was reported by Pacheco-Cervera et al33 while other studies found no correlation.34 A study by Kocak et al also reported the decreased ganglion cell layer thickness, as well as a decrease in RNFLT thickness and an unaltered central MT in class III obesity (BMI 49.15±7.65 kg/m2).34 Studies have also reported a reduction of GCT and RNFLT in patients with glaucoma,35–37 as well as a relationship between obesity and elevated IOP.14,19–21,38,39
This study found no significant difference in the CDR between groups. Other studies indicate that the correlation between CDR and BMI is unclear. Xu et al reported a significantly positive correlation between neuroretinal rim area and BMI,40 Pedro-Egbe CN and Awoyesuku EA did not find any association,41 and Amerasinghe et al found a negative correlation between the CDR and BMI.42
We found that the CT was similar between obese and normal subjects. Yilmaz et al showed a negative correlation between the BMI and the CT.43 Kocak et al reported that CT values were reduced in obese subjects.34 At this time, the relationship between obesity and CT remains unclear. Previous studies suggest that a reduction of nitric oxide in obese people may cause an imbalance between vasodilation and vasoconstriction, leading to a reduction of the CT.44,45 Differences in the results of our study and others may be because differences in axial length, ethnicity, and OCT instruments and software were not controlled.
Conclusion
Univariate and multivariate analysis showed a strong positive correlation between BMI and ACD. Furthermore, BMI also positively correlated with IOP. We suspect that degree of obesity may also be important, and suggest that any possible relationship between ocular parameters and severity of obesity should be further investigated.
Acknowledgments
This research was supported by grants from the Faculty of Allied Health Sciences, Naresuan University, Thailand.
Disclosure
KL received personal fees from Allergan, Bayer, Alcon, Zeiss. The authors report no other conflcts of interest in this work.
References
1.
2. Jitnarin N, Kosulwat V, Rojroongwasinkul N, Boonpraderm A, Haddock CK, Poston WS. Prevalence of overweight and obesity in Thai population: results of the national Thai food consumption survey. Eating Weight Disord. 2011;16(4):e242–9. doi:10.1007/BF03327467
3.
4. Haslam DW, James WP. Obesity. Lancet. 2005;366(9492):1197–1209. doi:10.1016/S0140-6736(05)67528-9
5. Feller S, Boeing H, Pischon T. Body mass index, waist circumference, and the risk of type 2 diabetes mellitus: implications for routine clinical practice. Dtsch Arztebl Int. 2010;107(26):470–476. doi:10.3238/arztebl.2010.0817
6. Marcadenti A, Fuchs SC, Moreira LB, Wiehe M, Gus M, Fuchs FD. Accuracy of anthropometric indexes of obesity to predict diabetes mellitus type 2 among men and women with hypertension. Am J Hypertens. 2011;24(2):175–180. doi:10.1038/ajh.2010.212
7. Bergman B, Nilsson-Ehle H, Sjostrand J. Ocular changes, risk markers for eye disorders and effects of cataract surgery in elderly people: a study of an urban Swedish population followed from 70 to 97 years of age. Acta Ophthalmol Scand. 2004;82(2):166–174. doi:10.1111/j.1600-0420.2004.00182.x
8. Wang S, Ma W, Yuan Z, et al. Association between obesity indices and type 2 diabetes mellitus among middle-aged and elderly people in Jinan, China: a cross-sectional study. BMJ Open. 2016;6(11):e012742. doi:10.1136/bmjopen-2016-012742
9. Cheung N, Wong TY. Obesity and eye diseases. Surv Ophthalmol. 2007;52(2):180–195. doi:10.1016/j.survophthal.2006.12.003
10. Age-Related Eye Disease Study Research Group. Risk factors associated with age-related nuclear and cortical cataract: a case-control study in the age-related eye disease study, AREDS report no.5. Opthalmology. 2001;108(8):1400–1408. doi:10.1016/S0161-6420(01)00626-1
11. Henricsson M, Nystrom L, Blohme G, et al. The incidence of retinopathy 10 years after diagnosis in young adult people with diabetes: results from the nationwide population-based Diabetes Incidence Study in Sweden (DISS). Diabetes Care. 2003;26(2):349–354. doi:10.2337/diacare.26.2.349
12. van Leiden HA, Dekker JM, Moll AC, et al. Blood pressure, lipids, and obesity are associated with retinopathy: the hoorn study. Diabetes Care. 2002;25(8):1320–1325. doi:10.2337/diacare.25.8.1320
13. Gasser P, Stumpfig D, Schotzau A, Ackermann-Liebrich U, Flammer J. Body mass index in glaucoma. J Glaucoma. 1999;8(1):8–11. doi:10.1097/00061198-199902000-00004
14. Gunes A, Uzun F, Karaca EE, Kalayci M. Evaluation of anterior segment parameters in obesity. Korean J Ophthalmol. 2015;29(4):220–225. doi:10.3341/kjo.2015.29.4.220
15. zen B, Ozturk H, Catli G, Dundar B. An Assessment of Retinal Nerve Fiber Layer Thickness in Non-Diabetic Obese Children and Adole. J Chin Res Pediatr Endocrinol. 2018;10(1):13–18..
16. Budenz DL, Anderson DR, Varma R, et al. Determinants of normal retinal nerve fiber layer thickness measured by Stratus OCT. Ophthalmology. 2007;114(6):1046–1052. doi:10.1016/j.ophtha.2006.08.046
17. Yumusak E, Ornek K, Durmaz SA, Cifci A, Guler HA, Bacanli Z. Choroidal thickness in obese women. BMC Ophthalmol. 2016;16(1):48. doi:10.1186/s12886-016-0227-z
18. Jirarattanasopa P, Panon N, Hiranyachattada S, Bhurayanontachai P. The normal choroidal thickness in southern Thailand. Clin Ophthalmol (Auckland, NZ). 2014;8:2209–2213.
19. Mori K, Ando F, Nomura H, Sato Y, Shimokata H. Relationship between intraocular pressure and obesity in Japan. Int J Epidemiol. 2000;29(4):661–666.
20. Jang HD, Kim DH, Han K, et al. Relationship between intraocular pressure and parameters of obesity in Korean adults: the 2008–2010 Korea National Health and Nutrition Examination Survey. Curr Eye Res. 2015;40(10):1008–1017. doi:10.3109/02713683.2014.975367
21. Stojanov O, Stokic E, Sveljo O, Naumovic N. The influence of retrobulbar adipose tissue volume upon intraocular pressure in obesity. Vojnosanit Pregl. 2013;70(5):469–476. doi:10.2298/VSP1305469S
22. Izzotti A, Sacca SC, Cartiglia C, De Flora S. Oxidative deoxyribonucleic acid damage in the eyes of glaucoma patients. Am J Med. 2003;114(8):638–646. doi:10.1016/S0002-9343(03)00114-1
23. Bulpitt CJ, Hodes C, Everitt MG. Intraocular pressure and systemic blood pressure in the elderly. Br J Ophthalmol. 1975;59(12):717–720. doi:10.1136/bjo.59.12.717
24. Savinova OV, Sugiyama F, Martin JE, et al. Intraocular pressure in genetically distinct mice: an update and strain survey. BMC Genet. 2001;2:12. doi:10.1186/1471-2156-2-12
25. Nishitsuka K, Kawasaki R, Kanno M, et al. Determinants and risk factors for central corneal thickness in Japanese persons: the funagata study. Ophthalmic Epidemiol. 2011;18:244–249. doi:10.3109/09286586.2011.594206
26. Su DH, Wong TY, Foster PJ, Tay WT, Saw SM, Aung T. Central corneal thickness and its associations with ocular and systemic factors: the Singapore Malay eye study. Am J Ophthalmol. 2009;147(4):709–16.e1.
27. Sahinoglu-Keskek N, Keskek SO, Cevher S, et al. Metabolic syndrome as a risk factor for elevated intraocular pressure. Pak J Med Sci. 2014;30(3):477–482. doi:10.12669/pjms.306.5684
28. Iyamu E, Iyamu JE, Amadasun G. Central corneal thickness and axial length in an adult Nigerian population. J Optom. 2013;6(3):154–160. doi:10.1016/j.optom.2012.09.004
29. Kim JH, Kim M, Lee SJ, et al. Age-related differences in ocular biometry in adult Korean population. BMC Ophthalmol. 2016;16(1):146. doi:10.1186/s12886-016-0328-8
30. Wong TY, Foster PJ, Ng TP, Tielsch JM, Johnson GJ, Seah SK. Variations in ocular biometry in an adult Chinese population in Singapore: the Tanjong Pagar Survey. Invest Ophthalmol Vis Sci. 2001;42(1):73–80.
31. Sun JH, Sung KR, Yun SC, et al. Factors associated with anterior chamber narrowing with age: an optical coherence tomography study. Invest Ophthalmol Vis Sci. 2012;53(6):2607–2610. doi:10.1167/iovs.11-9359
32. Ooi CS, Grosvenor T. Mechanisms of emmetropization in the aging eye. Optom Vis Sci. 1995;72(2):60–66.
33. Pacheco-Cervera J, Codoner-Franch P, Simo-Jorda R, Pons-Vazquez S, Galbis-Estrada C, Pinazo-Duran MD. Reduced retinal nerve fibre layer thickness in children with severe obesity. Pediatr Obes. 2015;10(6):448–453. doi:10.1111/j.2047-6310.2013.00210.x
34. Kocak N, Arslan N, Karti O, et al. Evaluation of the intraocular pressure in obese adolescents. Minerva Pediatr. 2015;67(5):413–418.
35. Leung CK, Cheung CY, Weinreb RN, et al. Evaluation of retinal nerve fiber layer progression in glaucoma: a study on optical coherence tomography guided progression analysis. Invest Ophthalmol Vis Sci. 2010;51(1):217–222. doi:10.1167/iovs.09-3468
36. Medeiros FA, Alencar LM, Zangwill LM, Sample PA, Weinreb RN. The relationship between intraocular pressure and progressive retinal nerve fiber layer loss in glaucoma. Ophthalmology. 2009;116(6):
37. Kim NR, Lee ES, Seong GJ, Kim JH, An HG, Kim CY. Structure-function relationship and diagnostic value of macular ganglion cell complex measurement using Fourier-domain OCT in glaucoma. Invest Ophthalmol Vis Sci. 2010;51(9):4646–4651. doi:10.1167/iovs.09-5053
38. Kim YH, Jung SW, Nam GE, et al. High intraocular pressure is associated with cardiometabolic risk factors in South Korean men: Korean National Health and Nutrition Examination Survey 2008–2010. Eye (Lond). 2014;28(6):672–679. doi:10.1038/eye.2014.43
39. Akinci A, Cetinkaya E, Aycan Z, Oner O. Relationship between intraocular pressure and obesity in children. J Glaucoma. 2007;16(7):627–630. doi:10.1097/IJG.0b013e318057528a
40. Xu L, Li JJ, Xia CR, Wang YX, Jonas JB. Anterior chamber depth correlated with anthropomorphic measurements: the Beijing eye study. Eye (Lond). 2009;23(3):632–634. doi:10.1038/eye.2008.26
41. Pedro-Egbe CN, Awoyesuku EA. The relationship between vertical cup-disc ratio and body mass index in Port Harcourt, Nigeria. Niger J Clin Pract. 2013;16(4):517–520. doi:10.4103/1119-3077.116904
42. Amerasinghe N, Wong TY, Wong WL, et al. Determinants of the optic cup to disc ratio in an Asian population: the Singapore Malay Eye Study (SiMES). Arch Ophthalmol Chicago, Ill: 1960. 2008;126(8):1101–1108. doi:10.1001/archopht.126.8.1101
43. Yilmaz I, Ozkaya A, Kocamaz M, et al. Correlation of choroidal thickness and body mass index. Retina (Philadelphia, Pa). 2015;35(10):2085–2090. doi:10.1097/IAE.0000000000000582
44. Reiner A, Li C, Del Mar N, Fitzgerald ME. Choroidal blood flow compensation in rats for arterial blood pressure decreases is neuronal nitric oxide-dependent but compensation for arterial blood pressure increases is not. Exp Eye Res. 2010;90(6):734–741. doi:10.1016/j.exer.2009.09.011
45. Kiel JW. Choroidal myogenic autoregulation and intraocular pressure. Exp Eye Res. 1994;58(5):529–543. doi:10.1006/exer.1994.1054
 © 2019 The Author(s). This work is published and licensed by Dove Medical Press Limited. The
full terms of this license are available at https://www.dovepress.com/terms
and incorporate the Creative Commons Attribution
- Non Commercial (unported, 3.0) License.
By accessing the work you hereby accept the Terms. Non-commercial uses of the work are permitted
without any further permission from Dove Medical Press Limited, provided the work is properly
attributed. For permission for commercial use of this work, please see paragraphs 4.2 and 5 of our Terms.
© 2019 The Author(s). This work is published and licensed by Dove Medical Press Limited. The
full terms of this license are available at https://www.dovepress.com/terms
and incorporate the Creative Commons Attribution
- Non Commercial (unported, 3.0) License.
By accessing the work you hereby accept the Terms. Non-commercial uses of the work are permitted
without any further permission from Dove Medical Press Limited, provided the work is properly
attributed. For permission for commercial use of this work, please see paragraphs 4.2 and 5 of our Terms.