Back to Journals » Clinical Ophthalmology » Volume 14
Corneal Hysteresis as a Biomarker of Glaucoma: Current Insights
Authors Zimprich L ![]() , Diedrich J
, Diedrich J ![]() , Bleeker A, Schweitzer JA
, Bleeker A, Schweitzer JA
Received 13 May 2020
Accepted for publication 21 July 2020
Published 10 August 2020 Volume 2020:14 Pages 2255—2264
DOI https://doi.org/10.2147/OPTH.S236114
Checked for plagiarism Yes
Review by Single anonymous peer review
Peer reviewer comments 2
Editor who approved publication: Dr Scott Fraser
Larae Zimprich,1 Jacob Diedrich,2 Adam Bleeker,3 Justin A Schweitzer1
1Vance Thompson Vision, Sioux Falls, SD 57108, USA; 2Mijangos Optometry, Sioux City, IA 51106, USA; 3University of South Dakota Sanford School of Medicine, Vermillion, SD 57069, USA
Correspondence: Justin A Schweitzer
Vance Thompson Vision, 3101 W 57th Street, Sioux Falls, SD 57108, USA
Tel +1605-361-3937
Fax +1605-371-7035
Email [email protected]
Abstract: The diagnosis and management of glaucoma has long been dependent on making decisions based on family history, optic nerve head evaluation, intraocular pressure, visual field testing, and optical coherence testing. Other pieces to aid in understanding glaucoma have presented throughout the years, including the role of corneal thickness. The discussion and debate on the mechanism of glaucoma have been attributed to resistance at the level of the conventional outflow pathway, perfusion pressure to the optic nerve head, cerebral spinal fluid pressure, and many more. Another piece that has emerged is corneal hysteresis, an assessment of the cornea’s ability to absorb and dissipate energy. There is abundant published literature supporting corneal hysteresis being associated with the presence and severity of glaucoma, the structural and functional progression of glaucoma, and the conversion to glaucoma. The supported data in these studies add another piece, corneal hysteresis, to consider in the diagnosis and management of glaucoma.
Keywords: glaucoma, corneal hysteresis, corneal biomechanics
Glaucoma is a progressive optic nerve neuropathy characterized by loss of retinal ganglion cells and their axons, causing irreversible vision loss. Intraocular pressure (IOP) is the most significant risk factor and remains, to this day, the only parameter for which treatment has proven to decrease the risk, incidence, and progression of glaucoma. Other risk factors include, but not limited to, increasing age, family history, race (African American), thinner central corneal thickness (CCT), and larger horizontal and vertical cup-disc ratio.1,2 It is estimated that 30–50% of glaucoma patients have normal IOP, suggesting that there are other risk factors that need to be considered in the management.3 The Early Manifest Glaucoma Trial reported that 45% of treated patients had glaucomatous progression on visual fields despite an average decrease of 25% in IOP.4 Additionally, patients in the Normal Tension Glaucoma Study Group showed a 30% decrease in IOP still did not halt the progression rate of glaucoma.4 Increasing attention has been focused on the impact of the biomechanical properties of the cornea, particularly corneal hysteresis (CH) (Table 1). Corneal biomechanics provide insight on how the cornea behaves in certain situations and can reflect the vulnerability of the optic nerve head to glaucoma. Thus, CH is being evaluated as a potential glaucoma biomarker, an objective measurement which serves as an indicator of a pathologic disease process.
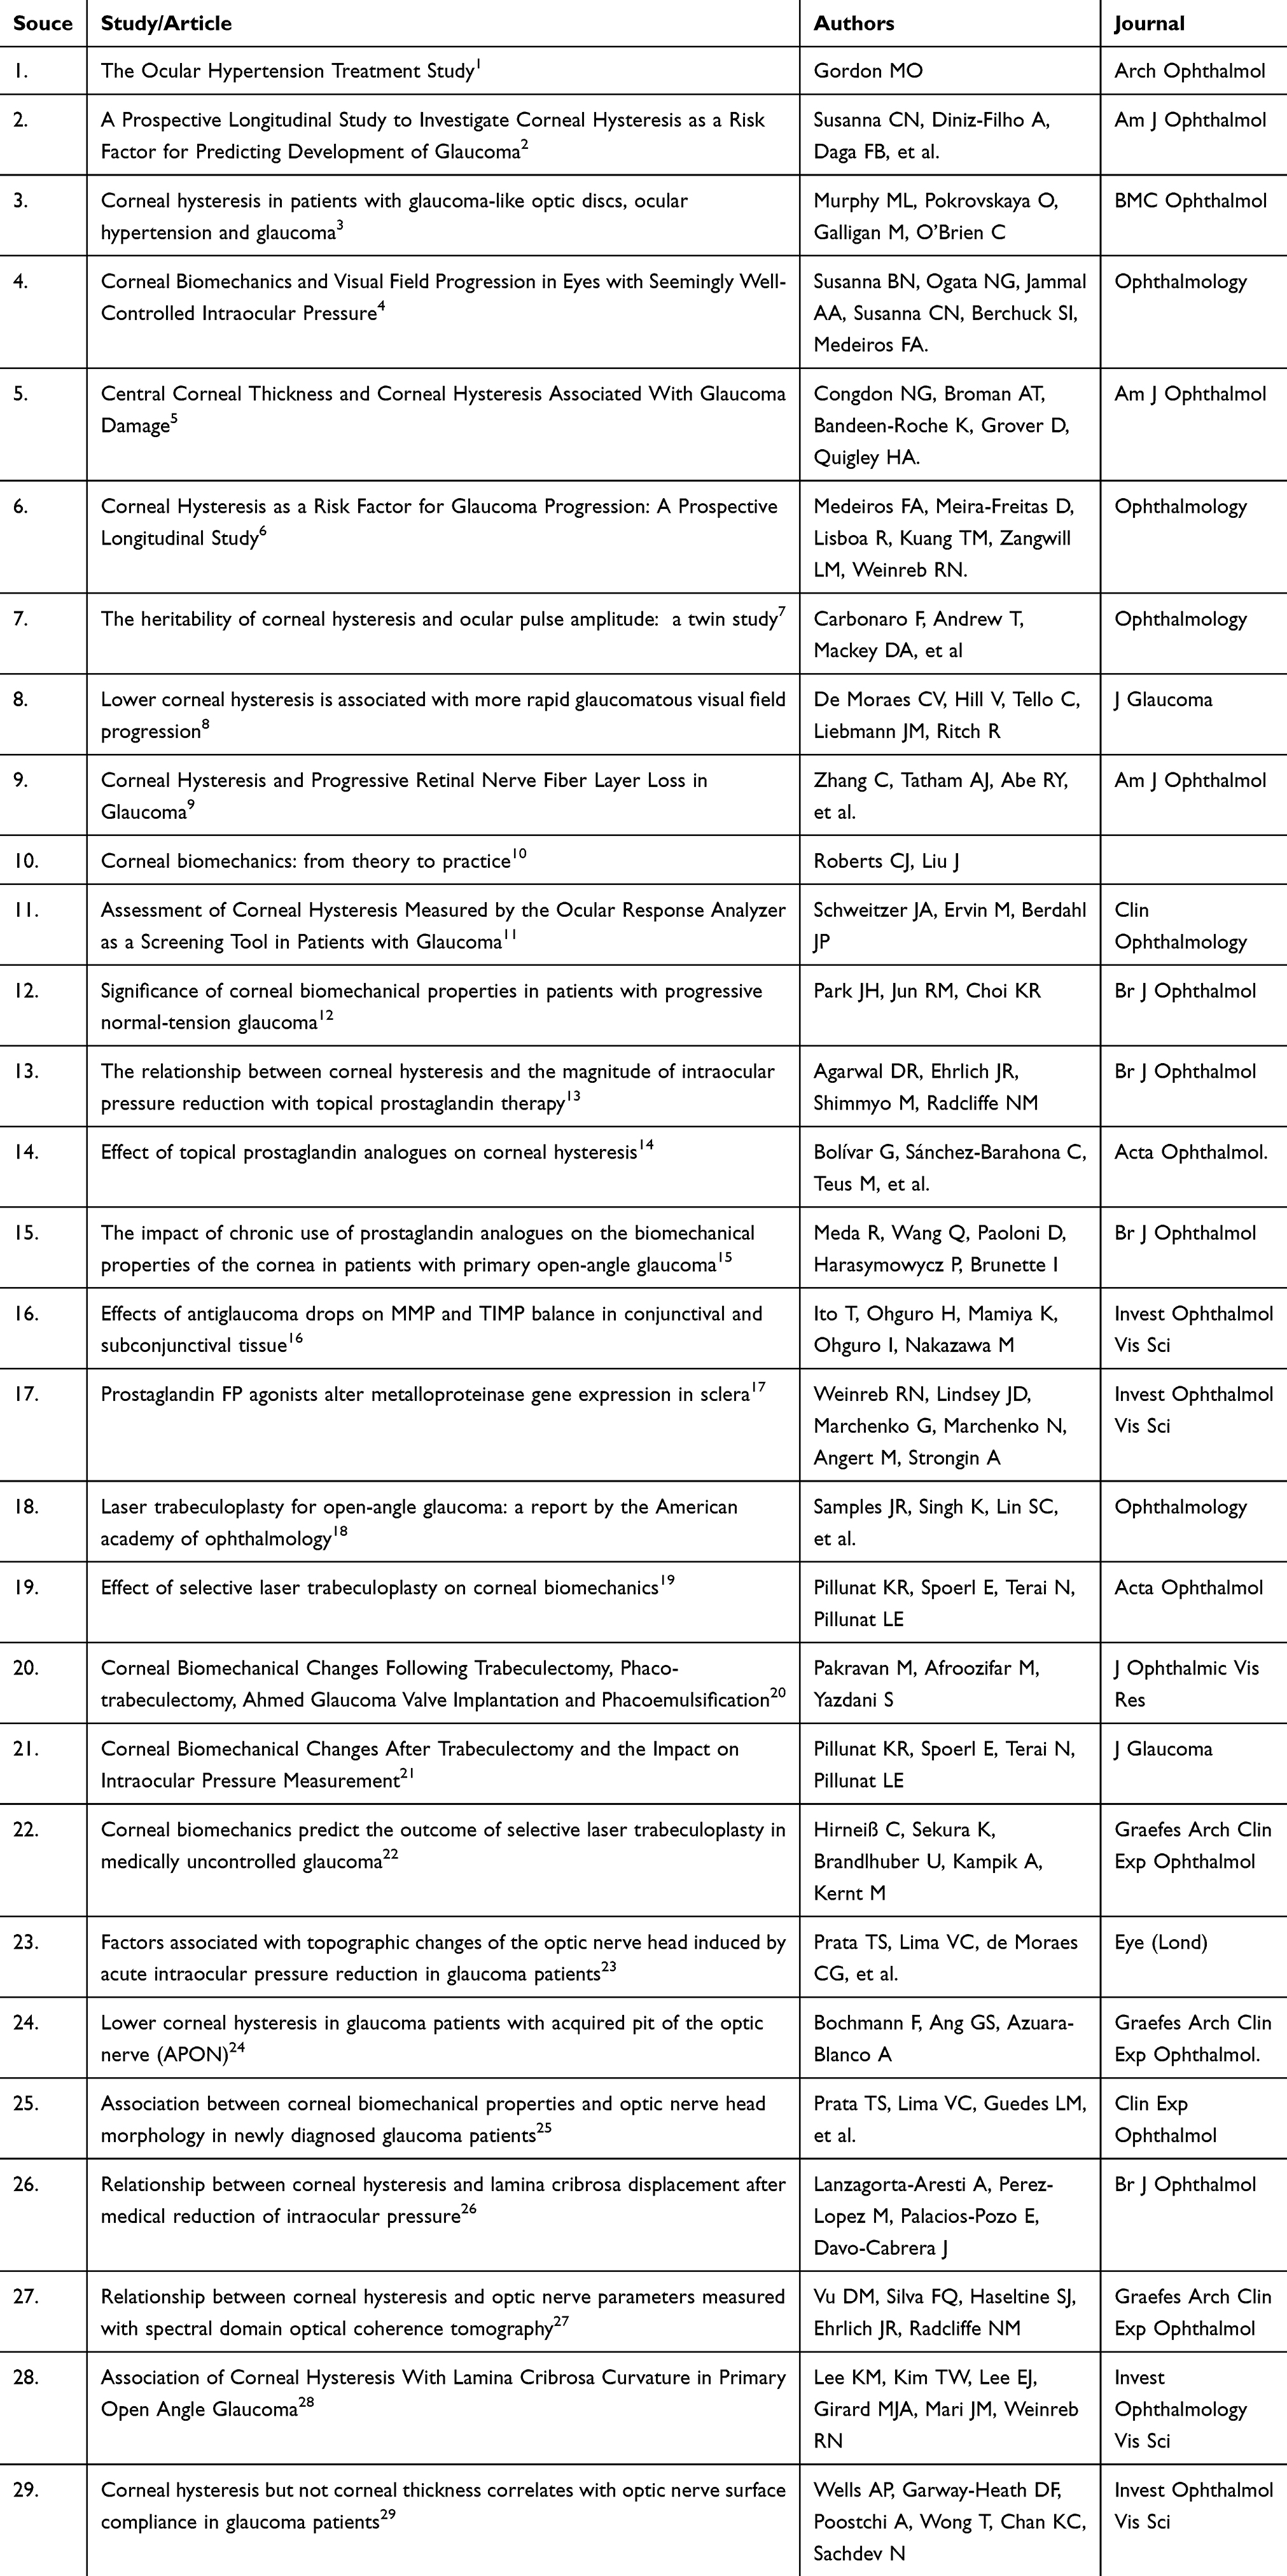 |
Table 1 List of Corneal Hysteresis Resources |
Corneal tissue is a complex viscoelastic structure, meaning that it demonstrates elements of both viscosity and elasticity.5 The viscoelasticity system of the cornea can be compared to an automotive suspension strut, where the elastic component is the coil spring and the viscosity is the shock absorber. When a load is applied to the strut, the response is dependent on both the elastic and viscous properties. Viscoelastic systems are often characterized by hysteresis, which is how the system responds to the loading and unloading of an applied force. Corneal hysteresis is a measure of the viscoelastic damping of the cornea, which reflects the ability of the cornea to absorb and dissipate energy.3 Low CH is associated with progressive optic nerve and visual field damage, and should pose as an independent risk factor for glaucoma.2–9 In an individual eye, the cornea, sclera, peripapillary ring, and lamina cribrosa are all made from extracellular matrix coded by the same genes that create collagen formation.6 Therefore, an eye with a more deformable cornea could potentially have a lamina cribrosa that is less able to dampen pressure changes, and suffer glaucomatous damage from an elevated IOP.4
Corneal hysteresis is a repeatable measurement that varies among individuals and is measured in millimeters of mercury. In a normal, non-diseased eye Shah et al found the average CH to be 10.7 mmHg (average age= 62.1 years) and Carbonaro et al identified an average CH of 10.2 mmHg.7 Numerous other studies have reported similar measurements.7 There is no correlation between CH and corneal radius, astigmatism, spherical equivalent, axial length or IOP with Goldmann applanation tonometry (GAT).7 Corneal hysteresis is dynamic in the sense that it may increase or decrease after IOP-lowering interventions are implemented.7 With increasing age, our cornea becomes rigid and less resilient causing CH to decrease.3 A general reduction in mechanical compliance has been demonstrated in the cornea, lamina cribrosa and sclera.3 The stroma makes up about 80% of the corneal structure and is mostly composed of type 1 collagen fibrils. As ocular tissue ages, collagen fibril diameter increases within the stroma as well as increased intermolecular spacing of the fibrils which may be a possible explanation as to why CH will decrease with age.8
Corneal hysteresis can be measured by inducing an air puff and analyzing the cornea’s response to the deformation the surface undergoes. The Reichert ocular response analyzer (ORA) (Ametek Reichert Technologies, Depew, NY, USA) is the only device that allows a numerical estimation of corneal hysteresis. Based on the fundamental properties of non-contact tonometry, a pulse of air is automatically dispensed that forces the cornea inward or in a concave configuration. Milliseconds later, the air delivery system shuts off allowing the cornea to return to its normal convex curvature. Two pressure values are derived from the inward (P1) and outward (P2) applanation. A Goldmann corrected IOP measurement is derived from the average of P1 and P2, while the mathematical difference between P1 and P2 is corneal hysteresis (Figure 1).10
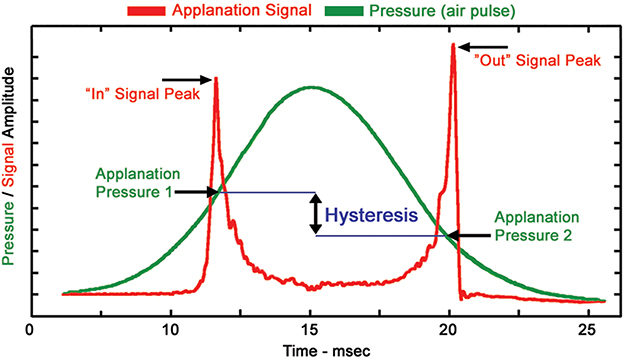 |
Figure 1 Ocular response analyzer (ORA) reading. P1 indicates the air-jet pressure when the cornea undergoes an inward applanation and P2 is the pressure at which the cornea bends back to normal configuration. Corneal hysteresis is defined by P1-P2.10 Figure courtesy of Reichart Inc., Depew, NY, USA. |
Corneal Hysteresis and Central Corneal Thickness
The Ocular Hypertension Treatment Study was the first to ignite the relationship between CCT and the development of glaucoma. A thinner CCT was identified as an independent risk factor for progression to initial glaucoma damage among persons with ocular hypertension.1 Patients with a corneal thickness of 555 microns or less had a 3-fold greater risk of developing glaucoma when compared to patients with corneal thickness greater than 588 microns.1 While the significance of CCT as an independent risk factor for glaucoma remains unclear, it is well documented that a thicker cornea causes an overestimation of IOP whereas a thinner cornea causes an underestimation of IOP. It is possible that a thin cornea reflects biomechanical properties of other ocular tissues that could make the eye susceptible to glaucomatous damage.6 This highlights the significance of CH. Although CH and CCT both relate to glaucoma, they are weakly to moderately correlated. In several studies comparing the two variables, a lower CH is more closely associated with visual field progression compared to CCT.5–9 Studies have been performed observing the correlation between CH and CCT. Results have shown a moderate, non-linear correlation between CH and CCT of r=0.42, r=0.43, r=0.74 in normal corneas and a weak to moderate correlation of r=0.20, r=0.43, r=0.44, r=0.45, r=0.51 in corneal diseased eyes.7 This indicates that the behavior of the cornea, rather than thickness, should be considered valuable when determining glaucoma risk.
Progression and Corneal Hysteresis
One of the most significant challenges associated with managing glaucoma patients is determining how rapidly a patient will progress, will they progress, and what is the risk of a patient labeled as a glaucoma suspect converting to glaucoma. Structural and functional assessments are used to help in determining progression. Recently, there has been a stronger emphasis put on incorporating CH measurements as a useful tool in the management of glaucoma patients.
Awareness of the potential benefits of CH measurements in glaucoma patients first began in 2006 when Congdon et al released their observational study concluding that CH was associated with progressive visual field loss.5 The study included 230 patients, of which 85% were previously diagnosed with primary open-angle glaucoma (POAG) and 15% were POAG suspects, that underwent routine evaluations for CH, IOP, CCT, and cup-to-disc ratio measurements, as well as visual field testing.5 The multivariate analyses of this data, which also included age, gender, and race, showed that a lower CH, and not CCT, was more strongly associated with progressive visual field loss.5 Central corneal thickness and CH have both shown to be independent risk factors of glaucoma, with CCT being indicative of glaucomatous damage as it corresponds to the cup-to-disc ratio, while CH as a stronger indicator of glaucoma progression.
In 2012, De Moraes et al published a retrospective study that further confirmed the basis of CH being a reliable indicator of glaucoma progression through visual field testing.8 This study included 153 eyes that were diagnosed with glaucoma which was defined by having a vertical cup-to-disc ratio of >0.6, asymmetry of C/D ratio ≥0.2, retinal nerve fiber layer and/or neuroretinal rim defects, and also had undergone at least 5 SITA-standard 24–2 fields which had shown reproducible visual field defects.8 Results showed that the mean global rate of visual field change was −0.34 ± 0.7 dB/y for all patients, with progressing eyes having a lower CCT and lower CH compared to non-progressing eyes.8 The authors concluded that CCT and CH are moderately correlated, and that these biomechanical properties of the cornea may be a factor in the vulnerability of the optic nerve to glaucomatous damage. Most importantly, they found that eyes with a lower CH had the worst visual field damage.8
Further studying the relationship between CH, glaucoma progression, and more specifically the rate of glaucoma progression through visual field testing, Medeiros et al published a prospective observational cohort study monitoring the changes of visual field index (VFI).6 There were 114 eyes that were monitored at 6 month intervals and underwent a minimum of 5 standard automated perimetry visual fields for a minimum of 2 years.6 In the univariable model concerning only CH, they found that for each 1 mmHg lower CH there was an associated faster rate of VFI loss at 0.25%/year.6 Also, for each elevated GAT IOP of 1 mmHg above baseline there was an associated faster rate of VFI decline at 0.11%/year.6 Results from the multivariable model, which takes factors in age, race, axial length, baseline GAT IOP, and CCT, also showed there was a significant association between lower CH and VFI loss.6 Eyes with 5 mmHg CH showed that for each 1 mmHg increase in IOP would be associated with a faster rate of VFI loss at 0.38%/year.6 In comparison, an eye with 10 mmHg CH would only be associated with a VFI loss at 0.11%/year with an 1 mmHg increase in IOP.6 The patients with a lower CH showed an increased risk of glaucomatous progression, and patients with a low CH and an elevated IOP were at a much greater risk for progression.6 (Figure 2)
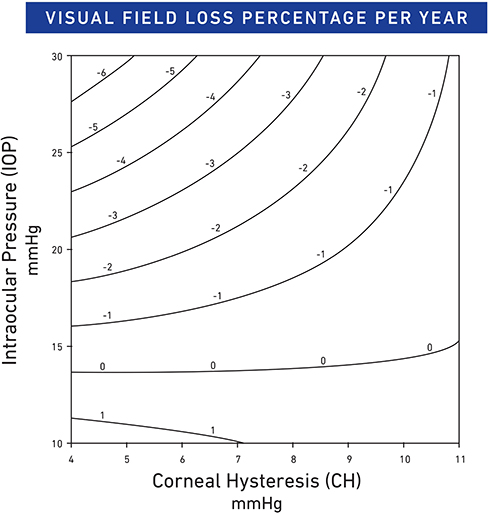 |
Figure 2 Relationship between predictive rates of VFI change, IOP, and CH, 2013. Notes: Reprinted from Ophthalmology: Journal of the American Academy of Ophthalmology, Vol 120(8), Medeiros FA, Meira-Freitas D, Lisboa R, Kuang TM, Zangwill LM, Weinreb RN, Corneal hysteresis as a risk factor for glaucoma progression: a prospective longitudinal study, Pages No.1533–1540, Copyright 2013, with permission from Elsevier.6 |
Previous studies showed that low CH measurements were a significant indication of glaucoma progression in functional testing, but an observational cohort study from Zhang et al in 2016 proposed that CH may play a role in the structural progression of glaucoma.9 The study consisted of 186 eyes of 133 patients that were diagnosed with glaucoma and underwent routine follow-ups for CH measurements with an Ocular Response Analyzer and also retinal nerve fiber layer (RNFL) measurements using Spectral Domain Optical Coherence Tomography (SDOCT) (soft-ware version 5.4.7.0; Heidelberg Engineering, Dossenheim, Germany). The results showed in the univariable model that each 1 mmHg lower CH was associated with a decline in the RNFL of 0.13 µm/yr.9 The multivariable also showed a similar RNFL decline associated with a lower CH when factors such as age, race, average intraocular pressures, and CCT were accounted for.9 They also found that there was a significant association of IOP and RNFL loss such that for every 1 mmHg increase in the average IOP there was a faster rate of RNFL loss at 0.06 µm/yr.9 In this study there was a significant association with lower CH and structural progression of glaucoma and the decline of the RNFL. The authors concluded that CH can be considered as a risk factor for progression of glaucoma.
In 2017, Murphy et al studied the role of CH and its association with three different subgroups of glaucoma diagnoses.3 The “Glaucoma” subgroup of patients consisted of those that had been previously diagnosed with primary open angle glaucoma, pseudoexfoliative glaucoma, or normal tension glaucoma. The second subgroup was the “Ocular Hypertension” (OHT) patients and the third subgroup were the “glaucoma-like optic disc” (GLD) patients. The GLD patients were defined as having a cup-to-disc ratio of ≥0.6 and pallor, asymmetric cupping between the eyes, normal IOP, normal visual fields, and open angles. This cross-sectional observational study included 123 total patients and found that the patients in the OHT and GLD group had a significantly higher mean CH than the patients in the glaucoma group. Compared to the glaucoma patients, OHT had a mean CH difference of 1.83 (p < 0.001), and GLD had a mean CH difference of 2.35 (p < 0.001).3 The authors concluded that this is sufficient evidence to warrant the inclusion of CH measurements into the management of glaucoma patients and will be beneficial to the clinician to determine if a patient is at an increased risk for progression.
Schweitzer et al conducted a retrospective study exploring the relationship between initial CH measurements and disease severity in 126 consecutive, first time glaucoma patients.11 Patients were stratified as CH>10 mmHg or CH<10 mmHg and subclassified according to disease severity (suspect, mild, moderate, severe) as defined by 24–2 Humphrey visual field testing. GAT IOP and number of topical medications were also recorded. In eyes with an initial CH<10 mmHg, moderate to severe glaucoma was 2.9 times more likely (p<0.01). Similarly, eyes with moderate/severe glaucoma and initial CH<10 mmHg demonstrated a significantly higher baseline GAT IOP compared to eyes with suspect/mild glaucoma and initial CH<10 mmHg (p<0.01). Though eyes with a CH>10 mmHg exhibited a larger portion of suspect/mild glaucoma, the difference was not statistically significant. Therefore, CH measurements taken at the initial visit may offer valuable information regarding disease progression in glaucomatous eyes.11
Susanna et al released an observational cohort study that included 287 eyes that had a history of an elevated IOP of greater than 21 mmHg or a glaucomatous appearing optic nerve, but had normal visual fields and open angles.2 The patients were then regularly seen every 6 months for testing, for a minimum of 2 years, and were diagnosed with glaucoma upon having at least 3 reliable and repeatable visual fields that exhibited abnormalities consistent with glaucomatous defects. The results showed that patients with CH measurements at baseline were significantly lower in patients who developed glaucoma (CH of 9.5 ± 1.5 mmHg) versus those who did not (CH of 10.2 ± 2.0 mmHg) (Figure 3).2 In univariable model analyses it was concluded that for each 1 mmHg lower CH was associated with a 21% increase in the risk of developing glaucoma.2 This relationship was consistent in the multivariable analyses that adjusted for age, IOP, CCT, pattern standard deviation (PSD) and treatments. Each 1 mmHg lower CH was associated with a 20% higher risk to develop visual field defects.2
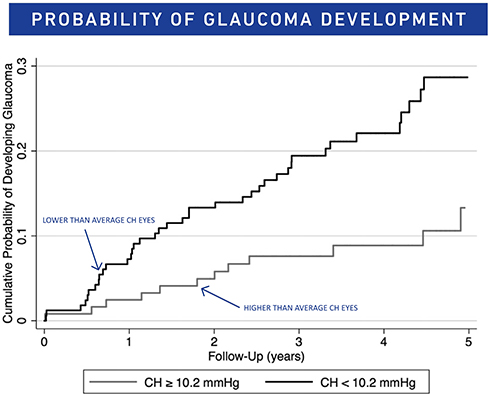 |
Figure 3 Cumulative probability of glaucoma development in glaucoma suspect eyes with CH equal or greater than 10.2, and in those with CH lesser than 10.2 mmHg. Notes: Reprinted from American Journal of Ophthalmology, Vol 187, Susanna CN, Diniz-Filho A, Daga FB, et al, A prospective longitudinal study to investigate corneal hysteresis as a risk factor for predicting development of glaucoma, Pages No.148–152, Copyright 2018, with permission from Elsevier.2 |
Corneal Hysteresis and Medical IOP Reduction
It is well established that CH is related glaucoma severity and disease progression.3,8,12 An emerging body of evidence has extrapolated these findings suggesting that CH may be predictive of a patient’s response to IOP reducing medications.
In 2011, Agarwal et al published a retrospective study examining CH in treatment naïve, glaucoma patients before and after initiation of a topical prostaglandin agonist (PGA).13 After an average of 2.2 months of treatment, repeat CH measurements increased significantly compared to baseline (p = 0.02). Simple regression analysis revealed a direct correlation between baseline CH and percent change (r = 0.31; p = 0.02) in IOP. Thus, glaucoma patients with lower initial CH experienced significantly greater reductions in IOP with primary PGA therapy (ANOVA; p < 0.01).13 It is worth noting however, that baseline CH was negatively associated with baseline Goldmann correlated IOP (IOPg) measured by the ORA (r = −0.32; p = 0.01). Cofounders were accounted for using multivariate regression models. Nonetheless, a significant relationship between baseline CH and percent change in IOPg was observed (p = 0.02).
Bolivar et al conducted a similar observational prospective study investigating the effects of topical PGA on CH in 68 treatment-naïve eyes with either POAG or OHT.14 In contrast to Agarwal et al, IOP was measured using GAT and follow-up occurred after 6 months of PGA therapy. At 6 months, the CH value had increased significantly compared to baseline (p = 0.0001). Likewise, glaucomatous eyes with low baseline CH were associated with a greater therapeutic reduction in IOP (r = 0.24; p = 0.01) and higher baseline IOP. Only the latter of which remained significant in a multiple stepwise regression analysis (p = 0.001). In both studies, CH was dependent on IOP.13,14 Therefore, while PGA therapy effects CH, it is unclear whether this is the result of acute reduction of IOP or a unique drug effect on corneal biomechanics.
Only one study to date has explored the long-term effects of PGA therapy on corneal biomechanics in POAG. Meda et al performed a prospective, case-control study assessing CH in 35 POAG patients treated with PGA for a minimum of 1 year.15 CH, IOP, and CCT were measured at three timepoints over a period of 12 weeks – 0 weeks, 6 weeks, and 12 weeks. Following the initial exam, patients were instructed to discontinue PGA therapy in the better eye while the fellow eye served as the intrasubject control. After 6 weeks, a significant increase in CH, IOP, and CCT was observed in the study eyes (p <0.00001). Subsequently, patients were asked to restart PGA therapy in the study eye for the remaining 6 weeks. Final measurements taken at 12 weeks demonstrated that CH values had returned to baseline (p <0.00001). No significant changes were detected in CH, CCT, or IOP at any of the three timepoints in the control eyes. These results contrast the aforementioned studies of Agarwal et al and Bolivar et al.13,14 A few studies have found that PGAs alter the transcription of enzymes responsible for maintaining the ocular extracellular matrix.16,17 Therefore, the increase in CH seen following discontinuation of chronic PGA therapy is most likely a function of altered ocular biomechanics. This would imply that the acute CH change seen in PGA naïve eyes is more likely related to the reduction of IOP. Therefore, while baseline CH measurements may provide some clinical insight into PGA responsiveness in treatment naïve patients, more investigation is needed to adequately discern the implications of CH after the initiation of medical therapy.
Corneal Hysteresis and Surgical Reduction of IOP
Selective Laser Trabeculoplasty (SLT) has shown efficacy as an adjunctive and standalone IOP-lowering strategy for patients that have failed topical therapy.18 Pillunat et al conducted a prospective case series examining the effect of SLT on corneal biomechanics in 52 eyes with medically unstable POAG.19 A majority of patients in the study exhibited severe glaucomatous disease as defined by high untreated IOP, visual field loss, and thinning of the RNFL. Corneal viscoelasticity was assessed via CH, IOPg, and IOPcc. All measurements were obtained before and 4 weeks after SLT. IOPg and IOPcc intuitively decreased after the procedure, whereas CH increased significantly (p = 0.028). No significant difference, however, was noted between CH measurements when adjusting for IOPg (p = 0.318) and IOPcc (p = 0.468). Therefore, the increase in postoperative CH observed can be attributed to the acute reduction in IOP.
Similar studies have explored the change in corneal biomechanics induced by other glaucoma procedures. Pakravan et al found a significant increase in CH values 3 months after trabeculectomy, phaco-trabeculectomy, or Ahmed glaucoma valve implantation.20 Patients with a >10 mmHg postoperative IOP reduction exhibited the largest increase in CH. However, Pakravan et al did not account for the relationship between IOP and CH. In contrast, Pillunat et al conducted a prospective study assessing the change in CH following trabeculectomy.21 After adjusting for the similarities between measures of corneal biomechanics, no significant increase in CH was observed following trabeculectomy (p = 0.720).
Nevertheless, CH may be predictive of a patient’s response to IOP lowering procedures. Hirneiß et al investigated the relationship between various corneal biomechanical parameters and percent IOP reduction following SLT.22 68 unstable, glaucomatous eyes were included in the study. IOP, CCT, CH, and corneal resistance factor (CRF) were recorded at baseline, 6 months postoperative, and 12 months postoperative. Initial IOP indirectly correlated with the magnitude of IOP reduction at 6- and 12- months status post SLT (r = −0.68 and r = −0.75; p < 0.001, respectively). Additionally, baseline IOP demonstrated a moderate association (R2 = 0.56) with a patient’s responsiveness to SLT at 12- months postoperative. Though IOP-corrected CH alone was not significantly associated with IOP reduction at 12- months (r = −0.17; p = 0.14), multiple linear regression analysis revealed a superior correlation when both baseline IOP and IOP-corrected CH were used to predict SLT responsiveness (R2 = 0.64). Hence, CH appears to offer clinically significant information regarding the potential efficacy of SLT in glaucomatous disease.22 Further study is required to determine if this relationship holds true following other glaucoma surgeries.
The management of glaucomatous disease effects measurements of corneal biomechanics.13–15,18–21 However, it remains unclear whether these alterations are a function of IOP, surgical technique, or a combination of the two. Baseline CH appears to correlate with therapeutic response in treatment naïve patient. Yet, after IOP-lowering therapy is initiated the clinical utility of CH in assessing treatment adequacy is questionable. Therefore, further work is required to identify the relationship between CH and glaucomatous disease before employing CH within clinical practice.
The Anatomical Connection
Recent evidence suggests a possible connection between CH and structural changes associated with glaucomatous optic nerve damage. Prata et al conducted a prospective, consecutive case series examining the relationship between corneal hysteresis and optic nerve head (ONH) morphology in 42 patients with newly diagnosed, untreated primary open angle glaucoma (POAG).23 Baseline CH measurements were shown to be significantly associated with mean cup depth (r = −0.34, p = 0.03) and linear cup-to-disc ratio (r = −0.41, p = 0.01) as measured by the Heidelberg Retina Tomography III (HRT III; Heidelberg Engineering, Heidelberg, Germany). In patients with bilateral POAG, the eye with a higher CH value was found to have a smaller linear cup-to-disc ratio in 75% of cases. These results imply that lower CH values in newly diagnosed, untreated POAG patients reflect a susceptibility to glaucomatous deformation of the optic nerve. Therefore, in addition to characterizing corneal viscoelasticity, CH may provide insight into the biomechanical properties of the optic nerve and its supporting structures.
Bochmann et al performed a prospective, case control study that assessed corneal biomechanics in glaucoma patients with and without an acquired pit of the optic nerve (APON).24 48 glaucoma patients were included in the study. The APON group consisted of 16 patients, 13 of which had normal tension glaucoma (NGT). CH values were significantly lower in glaucoma patients with an APON (8.89 ± 1.53) compared to glaucoma patients without an APON (10.2 ± 1.05, p = 0.005). Though the cornea, optic nerve, and sclera do not share a common embryologic origin, CH measurements potentially highlight an aspect of shared biomechanical composition.
Other studies have investigated the link between CH and pressure-induced changes in ONH morphology. Prata et al carried out a prospective case series that analyzed factors related to changes in ONH topography following acute IOP reduction in 42 newly diagnosed, untreated POAG patients with and without type II diabetes mellitus.25 Baseline measurements included HRT III, CH, and IOP. A mean IOP reduction of 47.3 ± 11.9% was achieved via a combination of agents (topical timolol maleate 0.5% + brimonidine tartrate 0.2%, topical bimatoprost 0.03%, and oral acetazolamide 500 mg). One hour after instillation, an HRT III measurement was taken and compared to baseline. Rim area, rim volume, cup area, and cup volume all demonstrated significant improvement following IOP reduction. Simple regression analysis revealed a negative correlation between baseline CH values and the magnitude of change in both cup area (r2 = 0.17, p = 0.005) and cup volume (r2 = 0.16, p = 0.009). However, these associations lost significance in multivariate models.
Lanzagorta-Aresti et al, Vu et al, and Lee et al examined spectral-domain coherence tomography (SD-OCT; Heidelberg Engineering GmbH, Heidelberg, Germany) as a means of comparing CH and pressure-induced glaucomatous damage.26–28 Lee et al outlined the relationship between baseline CH and lamina cribrosa curvature in 65 treatment naïve POAG patients.28 Lamina cribrosa curvature was assessed via the lamina cribrosa index, a combination of the anterior lamina cribrosa curve depth and width of reference line. Lower baseline CH measurements correlated with greater posterior displacement of the lamina cribrosa (p = 0.001).28 This suggests a potential relatedness between the connective tissue seen in the cornea and lamina cribrosa. Anterior and posterior displacement of the lamina cribrosa has been linked to changes in intraocular pressure. Thus, CH may provide clinically relevant insight for glaucoma management. Lanzagorta-Aresti et al demonstrated an association between the magnitude of lamina cribrosa displacement and CH in 77 treatment naïve, ocular hypertensive patients after one week of prostaglandin therapy (r2 = 0.48, p = 0.03).26 This relationship remained significant in multivariate analysis (p = 0.005). Vu et al retrospectively analyzed CH, SD-OCT, visual fields, and IOP in POAG and glaucoma suspect patients over a period of 12 months.27 A direct relationship between the average retinal nerve fiber layer (RNFL) thickness and CH was observed (r = 0.18, p = <0.001). This association was most prominent in the superior (p = < 0.001) and inferior (p < 0.001) regions of the RNFL. Additionally, the strength of correlation between CH and average RNFL thickness was greater in POAG patients compared to glaucoma suspect patients. However, when controlling for visual field deviation, age, average RNFL thickness, and glaucoma status no significant association between CH and average RNFL thickness was seen. While a simple correlation exists between CH and pressure-induced changes in optic nerve morphology, the lack of statistical significance observed in multivariable models suggests the potential for cofounding.
In contrast, Wells et al conducted a prospective study evaluating the change in optic disc cup depth seen in glaucomatous and non-glaucomatous eyes following an acute increase in IOP.29 All glaucoma patients included in the study had a medically stable IOP. Baseline measurements included CH, CCT, IOP, and HRT II. IOP was transiently increased to an average 66.6 mmHg (glaucoma) and 63.2 mmHg (control) for 1 minute using a modified laser-assisted in situ keratomileusis (LASIK) automated corneal shaper. During the brief increase in IOP a second HRT II measurement was taken. Across both groups, CH values directly correlated with an increase in mean cup depth, a surrogate for optic disc compliance (p = 0.032). In glaucomatous eyes, a significant relationship was observed between CH and the change in mean cup depth (p = 0.047). This association was not seen in the control group (p = 0.5). The authors hypothesized that in glaucomatous eyes the direct relationship between CH and optic disc compliance represented a diseased-induced alteration in ocular tissue biomechanics.29
Obvious discrepancies between CH and ONH morphology exist. While study design accounts for a significant portion of these differences, it is worth noting that multiple surrogates were used to model ONH morphology. CH appears to reflect aspects of optic nerve biomechanics, yet it remains unclear exactly what CH is measuring and its implication for glaucomatous patients. Therefore, further study is necessary to elucidate the relationship between CH and the biomechanical properties of the ONH.
Conclusion
There are many considerations that need to be taken into account when diagnosing and managing patients with glaucoma. One consideration that continues to be of importance are the biomechanical characteristics of the cornea. As stated throughout this paper, corneal hysteresis has been associated with progressive visual field worsening, the presence and severity of glaucoma, the conversion of glaucoma and the rate of progressive visual field worsening. This paper has reviewed the data to support corneal hysteresis as a parameter to be considered in the management of glaucoma patients and warrants consideration in making treatment decisions.
Disclosure
Dr Justin A Schweitzer reports personal fees from fReichertoutside the submitted work. The authors report no other conflicts of interest in this work.
References
1. Gordon MO, Beiser JA, Brandt JD, et al. The ocular hypertension treatment study: baseline factors that predict the onset of primary open-angle glaucoma. Arch Ophthalmol. 2002;120(6):
2. Susanna CN, Diniz-Filho A, Daga FB, et al. A prospective longitudinal study to investigate corneal hysteresis as a risk factor for predicting development of glaucoma. Am J Ophthalmol. 2018;187:148–152. doi:10.1016/j.ajo.2017.12.018
3. Murphy ML, Pokrovskaya O, Galligan M, O’Brien C. Corneal hysteresis in patients with glaucoma-like optic discs, ocular hypertension and glaucoma. BMC Ophthalmol. 2017;17(1):1. doi:10.1186/s12886-016-0396-9
4. Susanna BN, Ogata NG, Jammal AA, et al. Visual field progression in eyes with seemingly well-controlled intraocular pressure. Ophthalmology. 2019;126(12):1640–1646. doi:10.1016/j.ophtha.2019.07.023
5. Congdon NG, Broman AT, Bandeen-Roche K, Grover D, Quigley HA. Central corneal thickness and corneal hysteresis associated with glaucoma damage. Am J Ophthalmol. 2006;141(5):868–875. doi:10.1016/j.ajo.2005.12.007
6. Medeiros FA, Meira-Freitas D, Lisboa R, Kuang TM, Zangwill LM, Weinreb RN. Corneal hysteresis as a risk factor for glaucoma progression: a prospective longitudinal study. Ophthalmology. 2013;120(8):1533–1540. doi:10.1016/j.ophtha.2013.01.032
7. Carbonaro F, Andrew T, Mackey DA, et al. The heritability of corneal hysteresis and ocular pulse amplitude: a twin study. Ophthalmology. 2008;115:1545-1549
8. De Moraes CVG, Hill V, Tello C, Liebmann JM, Ritch R. Lower corneal hysteresis is associated with more rapid glaucomatous visual field progression. J Glaucoma. 2012;21(4):209–213. doi:10.1097/IJG.0b013e3182071b92
9. Zhang C, Tatham AJ, Abe RY, et al. Corneal hysteresis and progressive retinal nerve fiber layer loss in glaucoma. Am J Ophthalmol. 2016;166:29–36. doi:10.1016/j.ajo.2016.02.034
10. Roberts CJ, Liu J. Corneal Biomechanics: From Theory to Practice.
11. Schweitzer JA, Ervin M, Berdahl JP. Assessment of corneal hysteresis measured by the ocular response analyzer as a screening tool in patients with glaucoma. Clin Ophthalmol. 2018;12:1809–1813. doi:10.2147/OPTH.S168032
12. Park JH, Jun RM, Choi KR. Significance of corneal biomechanical properties in patients with progressive normal-tension glaucoma. Br J Ophthalmol. 2015;99(6):746–751. doi:10.1136/bjophthalmol-2014-305962
13. Agarwal DR, Ehrlich JR, Shimmyo M, Radcliffe NM. The relationship between corneal hysteresis and the magnitude of intraocular pressure reduction with topical prostaglandin therapy. Br J Ophthalmol. 2012;96(2):254–257. doi:10.1136/bjo.2010.196899
14. Bolívar G, Sánchez-Barahona C, Teus M, et al. Effect of topical prostaglandin analogues on corneal hysteresis. Acta Ophthalmol. 2015;93(6):e495–e498. doi:10.1111/aos.12689
15. Meda R, Wang Q, Paoloni D, Harasymowycz P, Brunette I. The impact of chronic use of prostaglandin analogues on the biomechanical properties of the cornea in patients with primary open-angle glaucoma. Br J Ophthalmol. 2017;101(2):120–125. doi:10.1136/bjophthalmol-2016-308432
16. Ito T, Ohguro H, Mamiya K, Ohguro I, Nakazawa M. Effects of antiglaucoma drops on MMP and TIMP balance in conjunctival and subconjunctival tissue. Invest Ophthalmol Vis Sci. 2006;47(3):823–830. doi:10.1167/iovs.05-0902
17. Weinreb RN, Lindsey JD, Marchenko G, Marchenko N, Angert M, Strongin A. Prostaglandin FP agonists alter metalloproteinase gene expression in sclera. Invest Ophthalmol Vis Sci. 2004;45(12):4368–4377. doi:10.1167/iovs.04-0413
18. Samples JR, Singh K, Lin SC, et al. Laser trabeculoplasty for open-angle glaucoma: a report by the american academy of ophthalmology. Ophthalmology. 2011;118(11):2296–2302. doi:10.1016/j.ophtha.2011.04.037
19. Pillunat KR, Spoerl E, Terai N, Pillunat LE. Effect of selective laser trabeculoplasty on corneal biomechanics. Acta Ophthalmol. 2016;94(6):e501–e504. doi:10.1111/aos.12947
20. Pakravan M, Afroozifar M, Yazdani S. Corneal biomechanical changes following trabeculectomy, phaco-trabeculectomy, ahmed glaucoma valve implantation and phacoemulsification. J Ophthalmic Vis Res. 2014;9(1):7–13.
21. Pillunat KR, Spoerl E, Terai N, Pillunat LE. Corneal biomechanical changes after trabeculectomy and the impact on intraocular pressure measurement. J Glaucoma. 2017;26(3):278–282. doi:10.1097/IJG.0000000000000595
22. Hirneiß C, Sekura K, Brandlhuber U, Kampik A, Kernt M. Corneal biomechanics predict the outcome of selective laser trabeculoplasty in medically uncontrolled glaucoma. Graefes Arch Clin Exp Ophthalmol. 2013;251(10):2383–2388. doi:10.1007/s00417-013-2416-2
23. Prata TS, Lima VC, de Moraes CG, et al. Factors associated with topographic changes of the optic nerve head induced by acute intraocular pressure reduction in glaucoma patients. Eye (Lond). 2011;25(2):201–207. doi:10.1038/eye.2010.179
24. Bochmann F, Ang GS, Azuara-Blanco A. Lower corneal hysteresis in glaucoma patients with acquired pit of the optic nerve (APON). Graefes Arch Clin Exp Ophthalmol. 2008;246(5):735–738. doi:10.1007/s00417-007-0756-5
25. Prata TS, Lima VC, Guedes LM, et al. Association between corneal biomechanical properties and optic nerve head morphology in newly diagnosed glaucoma patients. Clin Exp Ophthalmol. 2012;40(7):682–688.
26. Lanzagorta-Aresti A, Perez-Lopez M, Palacios-Pozo E, Davo-Cabrera J. Relationship between corneal hysteresis and lamina cribrosa displacement after medical reduction of intraocular pressure. Br J Ophthalmol. 2017;101(3):290–294. doi:10.1136/bjophthalmol-2015-307428
27. Vu DM, Silva FQ, Haseltine SJ, Ehrlich JR, Radcliffe NM. Relationship between corneal hysteresis and optic nerve parameters measured with spectral domain optical coherence tomography. Graefes Arch Clin Exp Ophthalmol. 2013;251(7):1777–1783. doi:10.1007/s00417-013-2311-x
28. Lee KM, Kim TW, Lee EJ, Girard MJA, Mari JM, Weinreb RN. Association of corneal hysteresis with lamina cribrosa curvature in primary open angle glaucoma. Invest Ophthalmol Vis Sci. 2019;60(13):4171–4177. doi:10.1167/iovs.19-27087
29. Wells AP, Garway-Heath DF, Poostchi A, Wong T, Chan KC, Sachdev N. Corneal hysteresis but not corneal thickness correlates with optic nerve surface compliance in glaucoma patients. Invest Ophthalmol Vis Sci. 2008;49(8):3262–3268. doi:10.1167/iovs.07-1556
 © 2020 The Author(s). This work is published and licensed by Dove Medical Press Limited. The
full terms of this license are available at https://www.dovepress.com/terms
and incorporate the Creative Commons Attribution
- Non Commercial (unported, 3.0) License.
By accessing the work you hereby accept the Terms. Non-commercial uses of the work are permitted
without any further permission from Dove Medical Press Limited, provided the work is properly
attributed. For permission for commercial use of this work, please see paragraphs 4.2 and 5 of our Terms.
© 2020 The Author(s). This work is published and licensed by Dove Medical Press Limited. The
full terms of this license are available at https://www.dovepress.com/terms
and incorporate the Creative Commons Attribution
- Non Commercial (unported, 3.0) License.
By accessing the work you hereby accept the Terms. Non-commercial uses of the work are permitted
without any further permission from Dove Medical Press Limited, provided the work is properly
attributed. For permission for commercial use of this work, please see paragraphs 4.2 and 5 of our Terms.