Back to Journals » Clinical Ophthalmology » Volume 10
Corneal biomechanics in asymmetrical normal-tension glaucoma
Authors Helmy H ![]() , Leila M
, Leila M ![]() , Atef Zaki A
, Atef Zaki A
Received 4 August 2015
Accepted for publication 21 January 2016
Published 18 March 2016 Volume 2016:10 Pages 503—510
DOI https://doi.org/10.2147/OPTH.S93725
Checked for plagiarism Yes
Review by Single anonymous peer review
Peer reviewer comments 4
Editor who approved publication: Dr Scott Fraser
Hazem Helmy,1 Mahmoud Leila,2 Ahmed Atef Zaki3
1Department of Glaucoma and Optic Nerve Diseases, 2Retina Department, 3Corneal Diseases Department, Research Institute of Ophthalmology, Cairo, Egypt
Purpose: We aimed to assess corneal biomechanics using the ocular response analyzer in patients with normal-tension glaucoma (NTG), and to evaluate the relationship between corneal biomechanics and visual field loss.
Methods: This was a prospective observational case series including patients with bilateral asymmetric NTG. For all patients, corneal hysteresis (CH), corneal resistance factor (CRF), CH - CRF difference, and central corneal thickness values were matched against the mean deviation (MD) of the visual field and the cup/disc ratio. For paired-eye comparison in each patient, both eyes were categorized into a better-eyes group and a worse-eyes group according to lower and higher corneal-compensated intraocular pressure readings, respectively. Statistical analysis was carried out with the independent-samples Student’s t-test, and the level of statistical significance was set at 0.05. Correlation was assessed using Pearson’s correlation coefficient.
Results: The study included 240 eyes of 120 patients. CH was inversely proportional to the MD in the visual field (P=0.01). CRF in both eyes was inversely proportional to the MD of the visual field (P=0.01). CH - CRF difference was directly proportional to the MD of the visual field (P=0.01). For paired-eye comparison, lower corneal-compensated intraocular pressure was associated with higher CH, higher CRF, smaller cup/disc ratio, and less deterioration of MD of visual field.
Conclusion: CH, CRF, and CH - CRF are more powerful predictors of NTG progression than central corneal thickness.
Keywords: corneal-compensated intraocular pressure, corneal hysteresis, corneal resistance factor
Introduction
Recently, the role of corneal biomechanics, including corneal hysteresis (CH) and corneal resistance factor (CRF), in glaucoma pathogenesis has been identified. This knowledge has helped us to improve our understanding of the mechanisms of glaucomatous damage and hence our capability to manage the disease. CH describes the corneal viscoelastic behavior that determines its ability to absorb and dissipate the mechanical energy applied by a deformation force. It is calculated as the difference in air pressures between force-in applanation (P1) and force-out applanation (P2), that is, (P1 − P2). CRF is another measurement extrapolated from CH. It is derived using the formula (P1 − kP2), where k is a constant. The constant, k, was developed through empirical evaluation of the relationship between P1 and P2 and the central corneal thickness (CCT), such that the value of k is more strongly associated with CCT than with CH. Thus, CRF is a measurement of corneal resistance that is relatively independent of intraocular pressure (IOP) and describes the overall ocular wall rigidity.1–4
A number of studies5,6 found that in certain forms of glaucoma, low CH is associated with progressive visual field loss. In addition, these studies mentioned that because the cornea and sclera are continuous collagenous sheaths and are made up of similar extracellular matrix constituents, the biomechanical properties of the cornea could be related to those of the lamina cribrosa (LC), which determine the resistance of the optic nerve head (ONH) to IOP and the amount of axonal nerve damage.5–7 Assessment of corneal biomechanics may therefore offer an indirect measurement of the LC elasticity.
The ocular response analyzer (ORA) is a novel device that enables in vivo measurement of corneal biomechanics. This new technology could improve our ability to manage glaucoma patients by offering valuable information that could identify those patients who are at risk of developing glaucoma progression. It can also serve as a helpful indicator in monitoring response to topical medications.8–10
The purpose of our study was to evaluate the relationship between corneal biomechanics and visual field loss. In addition, the study evaluates the efficacy of ORA as a novel noninvasive device to assess corneal biomechanics in patients with normal-tension glaucoma (NTG).
Patients and methods
This was a prospective observational case series including patients with bilateral asymmetric NTG. Patients were recruited over a period of 3 years. Inclusion criteria were NTG with IOP below 21 mmHg, open angle on gonioscopy with progressive visual field defects confirmed by at least two successive visual field tests and/or ONH cupping. Exclusion criteria included error of refraction that could falsely influence applanation tonometry or optical coherence tomography (OCT) assessment of retinal nerve fiber layer (hypermetropia or myopia >5 diopters [D], and/or astigmatism >3 D), best-corrected visual acuity <20/40, ocular conditions particularly congenital or acquired optic nerve diseases that could mimic glaucomatous visual field loss, or systemic conditions that could affect ocular blood flow – particularly cerebrovascular diseases or other conditions that could induce low systemic blood pressure.
Initial examination included Snellen best-corrected visual acuity, slit-lamp anterior segment examination, and fundus examination using slit-lamp biomicroscopy using +90 D lens, including assessment of vertical cup/disc (CD) ratio, gonioscopy, and IOP measurement using Goldmann applanation tonometry and ORA, which provided Goldmann-correlated IOP (IOPg), and corneal-compensated IOP (IOPcc). For determination of the IOPcc value, three measurements were taken using ORA-generated waveforms. A computer software then selects the best waveform reading. A good-quality waveform is defined as one with symmetrical heights of force-in and force-out waveform peaks and a waveform score 5 on a software-generated scale of 0–10. All patients underwent automated perimetry for visual field assessment using the Swedish interactive threshold algorithm (SITA Standard 24-2; Humphrey Field Analyzer 745i; Carl Zeiss Meditec AG, Jena, Germany), ONH examination using the RTVue-100 Fourier Domain OCT machine (Optovue Inc, Fremont, CA, USA), CCT measurement at the corneal apex using a Pentacam (Wavelight Allegro Oculyzer II; Alcon, Fort Worth, TX, USA), and corneal biomechanics measurement using the ORA.
The ocular response analyzer
The ORA (Ametek Reichert, Inc, Depew, NY, USA) is a noncontact device that uses a precisely metered collimated air pulse that causes the cornea to move inward, past applanation, and into a slight concavity. Milliseconds after applanation, as the air pulse force decreases, the cornea begins to return to its normal configuration. In the process, it once again passes through an applanated state. An electro-optical system monitors the curvature of the cornea throughout the deformation process, taking 400 data samples during the 20 ms measurement. Two independent pressure values are derived from the inward and outward applanation events. Viscous damping in the cornea results in an offset between the inward and outward pressure values. The difference between these two pressure values is the CH.
The device also provides IOPg and IOPcc measurements that are corrected according to corneal biomechanics measurement values. The machine also provides CRF measurements extrapolated from CH.
For all patients CH, CRF, CH - CRF (CRF subtracted from CH), and CCT values were matched against the mean deviation (MD) of the visual field and the value of the CD ratio.
For paired-eye comparison in each patient, both eyes were categorized into a better-eyes group and a worse-eyes group according to whether they had lower or higher IOPcc readings, respectively.
All procedures and follow-up visits were done at the Research Institute of Ophthalmology (R.I.O.) - Ministry of Scientific Research, Egypt. The study was performed in accordance with the tenets of the Declaration of Helsinki of 1975 (the 2008 revision). The Research Committee of The Research Institute of Ophthalmology approved the protocol of the study and granted ethical permission to perform the study. All patients received a thorough explanation of the procedures entailed in the study and signed an informed consent prior to enrollment.
Statistical analysis
Statistical analyses for all determinations were carried out, including the calculation of the mean, standard deviation (SD), standard error (SE), and t-value at the level of P<0.05, for both the groups, control group (the better eye), and the test group (the worse eye). The results were statistically evaluated according to the independent-samples Student’s t-test. Correlation was assessed using Pearson’s correlation coefficient.
Results
Patients’ characteristics
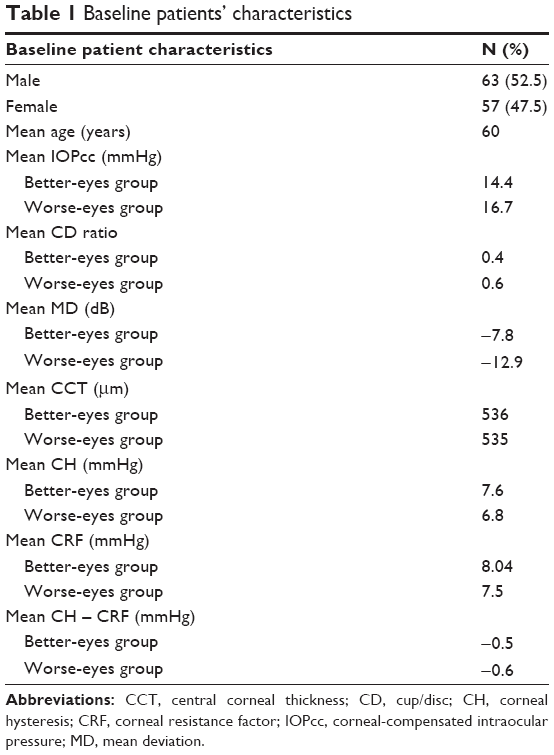
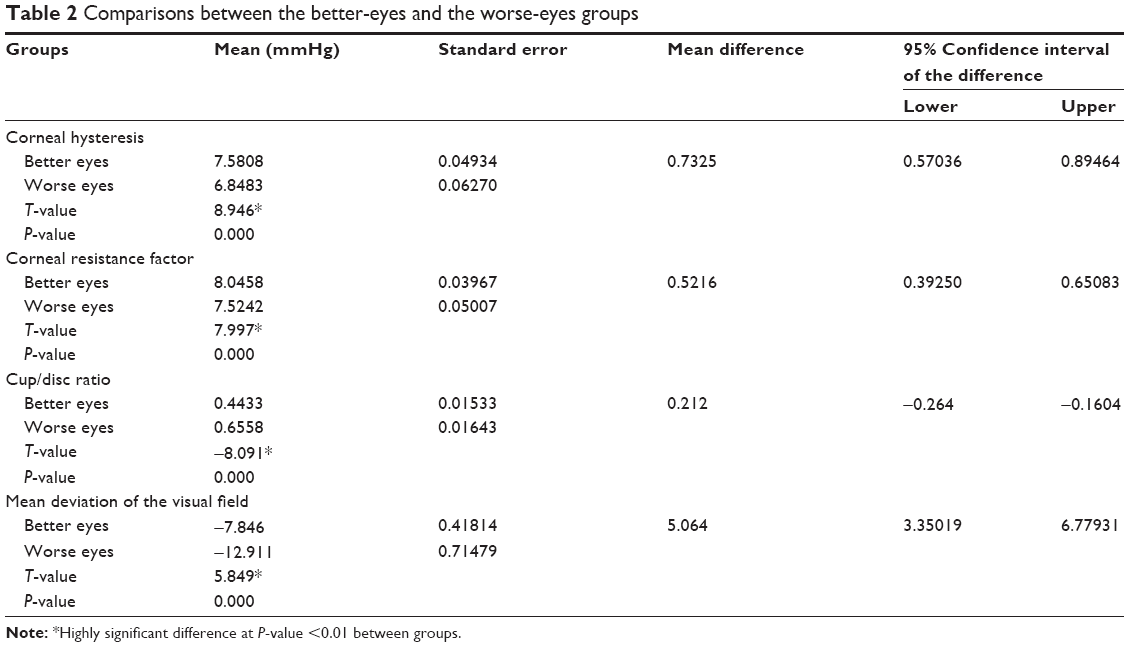
The study included 240 eyes of 120 patients with asymmetric NTG. Sixty-three patients (52.5%) were males. Mean age was 60 years (range: 34–76 years; SE: 0.7 years). Mean IOPcc in the better-eyes group was 14.4 mmHg (range: 12–19 mmHg; SE: 0.17 mmHg), whereas in the worse-eyes group, it was 16.7 mmHg (range: 13–20 mmHg; SE: 0.12 mmHg). Mean CD ratio in the better-eyes group was 0.4 (range: 0.2–0.9; SE: 0.01), whereas in the worse-eyes group, it was 0.6 (range: 0.2–0.9; SE: 0.01). Mean MD value of the visual field in the better-eyes group was −7.8 dB (range: −22.2 dB to 7.87 dB; SE: 0.4 dB), whereas in the worse-eyes group, it was −12.9 dB (range: −26 dB to 27 dB; SE: 0.7 dB). Mean CCT value in the better-eyes group was 536 μm (range: 527–548 μm; SE: 0.4 μm), whereas the mean value in the worse-eyes group was 535 μm (range: 428–549 μm; SE: 0.9 μm).
Corneal biomechanics values
Mean CH value in the better-eyes group was 7.6 mmHg (range: 6–9 mmHg; SE: 0.04 mmHg), whereas in the worse-eyes group, it was 6.8 mmHg (range: 5.7–8.1 mmHg; SE: 0.06 mmHg). Mean CRF value in the better-eyes group was 8 mmHg (range: 6.6–9.4 mmHg; SE: 0.03 mmHg), whereas in the worse-eyes group, it was 7.5 mmHg (range: 6.2–8.7 mmHg; SE: 0.05 mmHg). The mean CH - CRF value in the better-eyes group was −0.5 mmHg (range: −1.0 mmHg to −0.1 mmHg; SE: 0.01 mmHg), whereas in the worse-eyes group, it was −0.6 mmHg (range: −1.1 mmHg to 0.9 mmHg; SE: 0.02 mmHg) (Table 1).
 | Table 1 Baseline patients’ characteristics |
Correlation between corneal biomechanics and visual field changes
CH was inversely proportional to MD of the visual field, which meant that patients who had highest hysteresis values experienced least deviation of their visual field relative to their age-matched normal population (P=0.01). Similarly, CRF in both eyes was inversely proportional to MD of the visual field (P=0.01). CH - CRF difference was directly proportional to MD of the visual field, ie, higher CH - CRF difference corresponded to more deterioration of MD of visual field as compared to the age-matched population (P=0.01) (Figures 1 and 2).
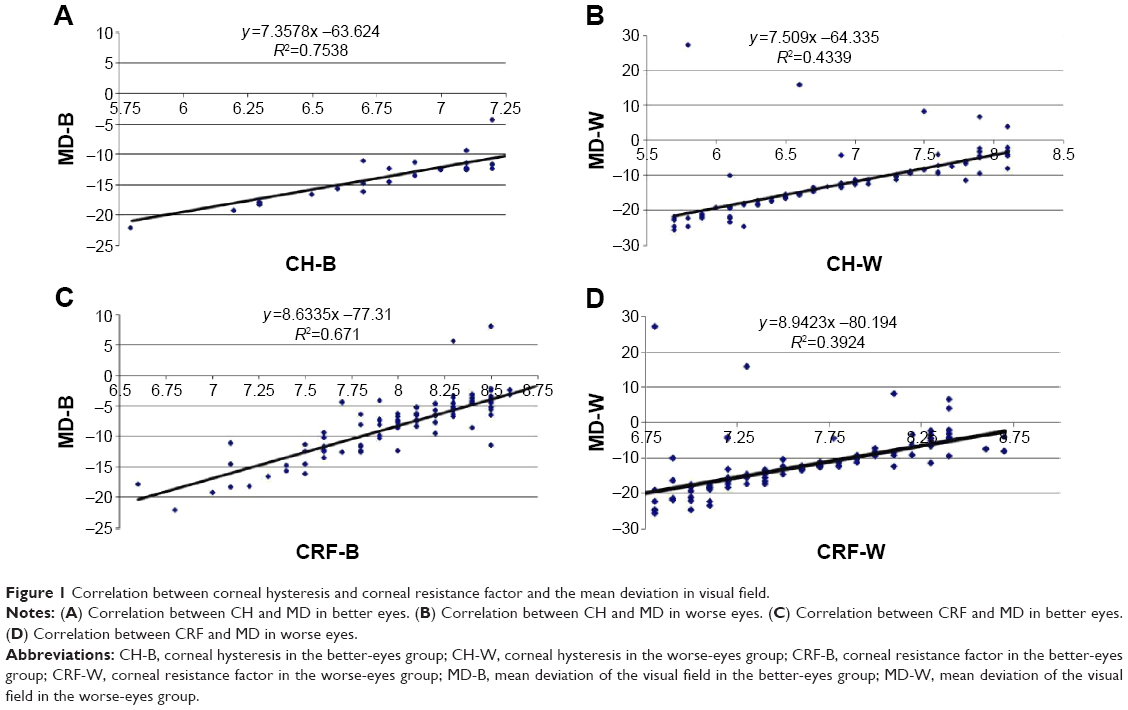 | Figure 1 Correlation between corneal hysteresis and corneal resistance factor and the mean deviation in visual field. |
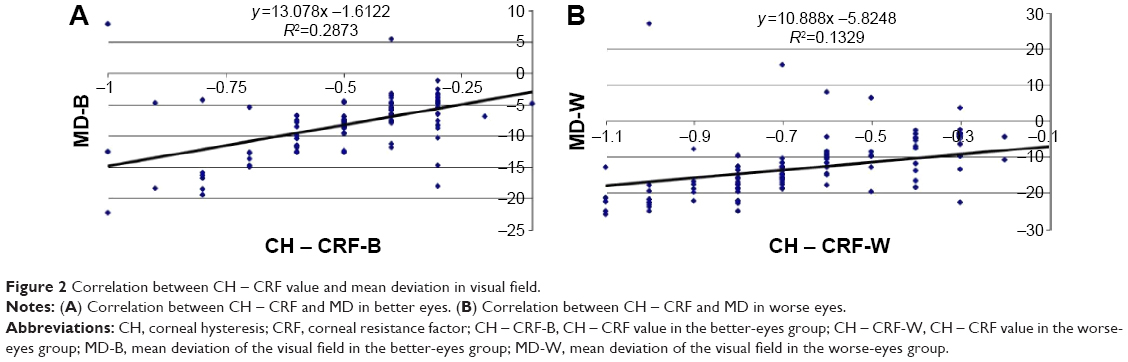 | Figure 2 Correlation between CH – CRF value and mean deviation in visual field. |
Correlation between CCT, IOPcc, and CD ratio and the changes in visual field
No statistically significant relation could be established between CCT and MD of the visual field (P=0.12 and 0.19) for the better- and the worse-eyes groups, respectively.
IOPcc was directly proportional to MD of the visual field in the sense that lower IOPcc corresponded to less deterioration of MD, and vice versa (P=0.01 and 0.16), for better (lower IOPcc) and worse (higher IOPcc) eyes, respectively. CD ratio was directly proportional to MD of the visual field for better and worse eyes (P=0.01) (Figure 3).
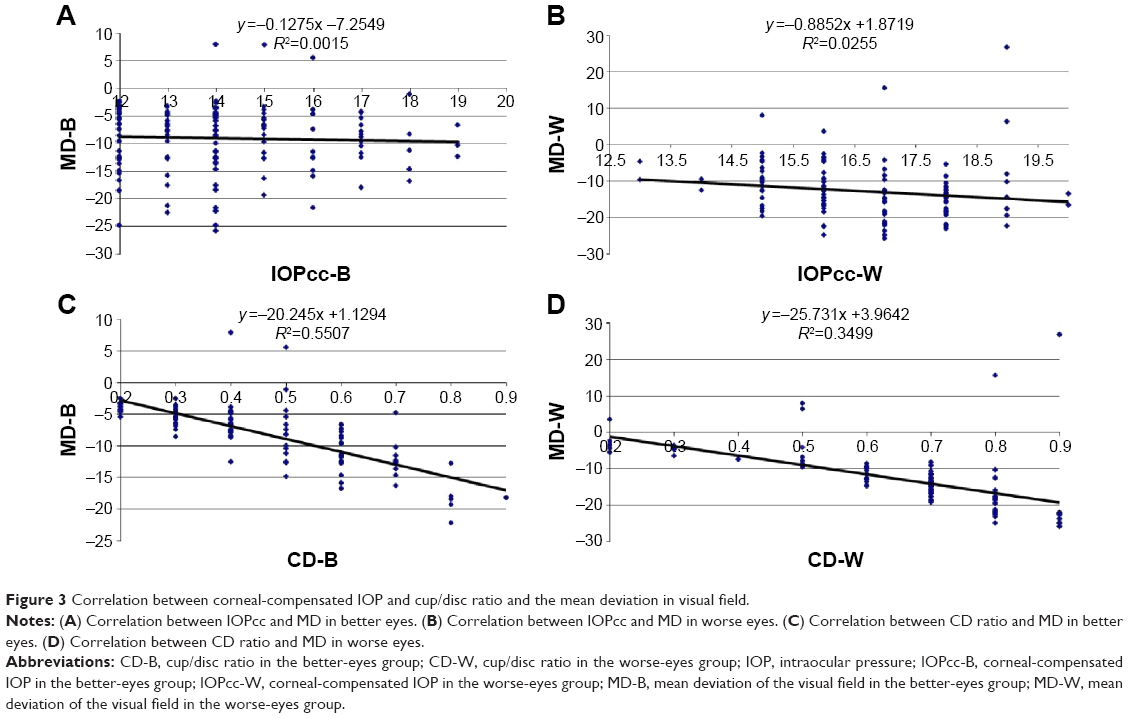 | Figure 3 Correlation between corneal-compensated IOP and cup/disc ratio and the mean deviation in visual field. |
Paired-eye comparison revealed that lower IOPcc was associated with higher CH, higher CRF, smaller CD ratio, and less deterioration of MD of visual field (Table 2). All correlations were statistically significant (Table 3).
 | Table 2 Comparisons between the better-eyes and the worse-eyes groups |
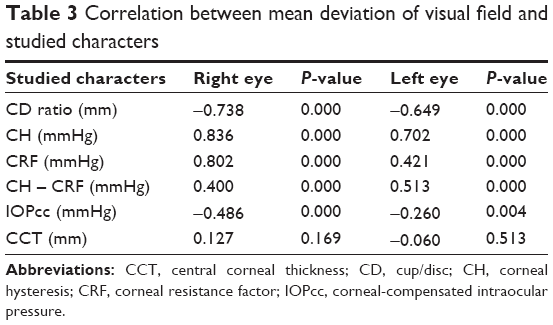 | Table 3 Correlation between mean deviation of visual field and studied characters |
Discussion
The findings of this study corroborate the notion that glaucoma progression is related to corneal biomechanics. CH has been reported to be lower in primary open angle glaucoma (POAG) than in healthy eyes, resulting in decreased damping properties and increased stiffness of the continuous collagenous sheaths of the eye, setting the focus of glaucoma pathogenesis in the region of the LC and the ONH.11–15
Our results demonstrated a statistically significant correlation between CH, CRF, and MD of visual field. Patients with lower CH were more prone to developing progression of MD of visual field. Similarly, patients who had lower CRF value developed more deterioration of MD of visual field.
In accordance with this study, a prospective observational case series including 114 eyes by Medeiros et al11 reported that eyes with lower CH values had faster rates of visual field loss. Similarly, Vu et al16 reported a close relation between CH and MD of visual field in a retrospective study of 131 patients. Similarly, Grise-Dulac et al17 and De Moraes et al18 reported significant association between low CH and glaucoma progression. A prospective study by Anand et al19 including 117 patients with asymmetric POAG found that asymmetric POAG was associated with asymmetric ORA parameters and that low CH was associated with worse visual field.
In contrast with the results of this study, Mansouri et al20 conducted an observational cross-sectional study that included 299 eyes of 191 patients with confirmed or suspected glaucoma. The authors reported weak associations between the corneal biomechanical parameters, namely, CH and CRF, and glaucoma-associated structural and functional damage.
Because the CRF is a measurement of ocular wall rigidity, a low CRF value – and hence decreased collagenous component – would reflect a thinner LC that provides less support to axonal fibers.21–23 In pursuit of this theory, we subtracted the CRF value from the CH value (CH - CRF) of our patients and compared the resultant value against the MD of the visual field. We found that lower CRF, ie, higher CH - CRF difference, is significantly related to deterioration of MD of the visual field.
Similar results have been reported by Congdon et al.13 In an observational study, the authors detected a significant correlation between longer axial length, hence thinner LC, and glaucomatous field progression. Similarly, Prata et al23 investigated the association between corneal biomechanics and ONH morphology. In a prospective series of 42 patients with POAG, these authors found that patients with thinner corneas and lower CH values had larger CD values and deeper cups.
It is worthy of note that up to date, there is no reliable method for direct measurement of the LC thickness. We still rely on indirect estimation extrapolated from other measurable ocular variables, including CH - CRF and axial length.
A number of studies24–26 have tried to apply enhanced depth imaging (EDI)-OCT technology for direct measurement of LC thickness. Park et al25 failed to detect the posterior border of LC in 47 out of 137 patients tested (34.3%). Girard et al26 used EDI-OCT and swept-source OCT in combination with image enhancement technology but concluded that the visibility of the posterior boundary of LC with these techniques is poor and hence impractical as a reliable glaucoma progression biomarker.
In our study, we tested the relationship between CCT and MD of visual field. Our results in this regard did not reveal consistent relation between both variables. Therefore, we do not have basis to recommend CCT to be used as a reliable tool for predicting glaucomatous progression of the visual field.
Our results are congruous with two population-based studies, the Early Manifest Glaucoma Trial (EMGT)27 and the Barbados Eye Study.28 Both did not detect any significant association between CCT and glaucoma risk. However, longer years of follow-up in the EMGT study concluded that CCT is a risk factor, though with a preferential impact in patients with higher baseline IOP (≥21 mmHg).29 Medeiros et al11 reported that CH is a more significant risk factor for progression of glaucoma than CCT, as CCT was related to progression rates of glaucomatous field in 5.2% of their cases as compared to 17.4% for CH. In agreement, Congdon et al13 reported that CH is more closely associated with glaucomatous visual field progression than CCT.
Contrary to our findings, CCT was considered among the strongest independent predictors for the development of POAG by the European Glaucoma Prevention Study30 and the Ocular Hypertension Treatment Study.31
This study demonstrated that IOP is significantly related to glaucomatous visual field progression. The higher the IOP, the higher is the CD ratio and the greater is the deterioration of MD of visual field.
Our findings are synonymous with several benchmark reports29–35 that emphasize the pivotal association between higher IOP as well as larger vertical and horizontal CD ratios and glaucoma progression.
The use of ORA in our study allowed the direct measurement of corneal biomechanics, namely, measurement of CH and CRF, as well as extrapolation of CH - CRF. All three parameters demonstrated statistically significant relation with MD of the visual field. The machine is a noncontact device and provides fast, operator-independent, and reproducible measurements of corneal biomechanics.
An important limitation of this study is the lack of direct means of measuring the elasticity of LC; rather, we relied on indirect clues extrapolated from measurable parameters, namely, CH and CRF. An ideal study would include histopathological evidence that truly reflects the normal LC elasticity in vivo to corroborate our conclusion. Obviously, such a study cannot be performed on living human beings. Future advances in medical equipment and imaging techniques that provide direct in vivo noninvasive assessment of the collagenous component, hence the elasticity, of LC would be a revolutionary development in the diagnosis and management of NTG patients. Another limitation is that the current study relied on original ORA-pressure-derived parameters, namely, CH, CRF, IOPg, and IOPcc. Two of these four parameters (CRF and IOPcc) are largely calculated on empirical basis, which poses important limitations to their accuracy.3 More recent developments in ORA machinery that incorporate 37 waveform signal parameters could characterize the biomechanical features of the cornea more accurately.
Conclusion
CH, CRF, and CH - CRF are more powerful predictors of NTG progression than CCT. ORA should be used as an integral equipment in the diagnosis and follow-up of NTG patients.
Acknowledgment
This study was conducted in the Research Institute of Ophthalmology, Ministry of Scientific Research, Egypt.
Disclosure
The authors report no conflicts of interest in this work. None of the authors has proprietary interest in any material used in this study.
References
Radcliffe NM. Hysteresis: a powerful tool for glaucoma care. Rev Ophthalmol. 2014;21(1):50. | ||
Luce DA. Determining in vivo biomechanical properties of the cornea with an ocular response analyzer. J Cataract Refract Surg. 2005;31(1):156–162. | ||
Roberts CJ. Concepts and misconceptions in corneal biomechanics. J Cataract Refract Surg. 2014;40(6):862–869. | ||
Glass DH, Roberts CJ, Litsky AS, Weber PA. A viscoelastic biomechanical model of the cornea describing the effect of viscosity and elasticity on hysteresis. Invest Ophthalmol Vis Sci. 2008;49(9):3919–3926. | ||
Cankaya AB, Anayol A, Özcelik D, Demirdogen E, Yilmazbas P. Ocular response analyzer to assess corneal biomechanical properties in exfoliation syndrome and exfoliative glaucoma. Graefes Arch Clin Exp Ophthalmol. 2012;250(2):255–260. | ||
Spörl E, Terai N, Haustein M, Böhm AG, Raiskup-Wolf F, Pillunat LE. [Biomechanical condition of the cornea as a new indicator for pathological and structural changes]. Ophthalmologe. 2009;106(6):512–520. German. | ||
Herndon WL, Weizer JS, Stinnett SS. Central corneal thickness as a risk factor for advanced glaucoma damage. Arch Ophthalmol. 2004;122(1):17–21. | ||
Wasielica-Poslednik J, Berisha F, Aliyeva S, Pfeiffer N, Hoffmann EM. Reproducibility of ocular response analyzer measurements and their correlation with central corneal thickness. Graefes Arch Clin Exp Ophthalmol. 2010;248(11):1617–1622. | ||
Detry-Morel M, Jamart J, Hautenauven F, Pourjavan S. Comparison of the corneal biomechanical properties with the ocular response analyzer® (ORA) in African and Caucasian normal subjects and patients with glaucoma. Acta Ophthalmol. 2012;90(2):e118–e124. | ||
Agarwal DR, Ehrlich JR, Shimmyo M, Radcliffe NM. The relationship between corneal hysteresis and the magnitude of intraocular pressure reduction with topical prostaglandin therapy. Br J Ophthalmol. 2012;96:254–257. | ||
Medeiros FA, Meira-Freitas D, Lisboa R, Kuang TM, Zangwill LM, Weinreb RN. Corneal hysteresis as a risk factor for glaucoma progression: a prospective longitudinal study. Ophthalmology. 2013;120(8):1533–1540. | ||
Ang GS, Bochmann F, Townend J, Azuara-Blanco A. Corneal biomechanical properties in primary open angle glaucoma and normal tension glaucoma. J Glaucoma. 2008;17(4):259–262. | ||
Congdon NG, Broman AT, Bandeen-Roche K, Grover D, Quigley HA. Central corneal thickness and corneal hysteresis associated with glaucoma damage. Am J Ophthalmol. 2006;141(5):868–875. | ||
Klingenstein A, Kernt M, Seidensticker F, Kampik A, Hirneiss C. Anterior-segment morphology and corneal biomechanical characteristics in pigmentary glaucoma. Clin Ophthalmol. 2014;8:119–126. | ||
Mangouritsas G, Morphis G, Mourtzoukos S, Feretis E. Association between corneal hysteresis and central corneal thickness in glaucomatous and non-glaucomatous eyes. Acta Ophthalmol. 2009;87(8):901–905. | ||
Vu DM, Silva FQ, Haseltine SJ, Ehrlich JR, Radcliffe NM. Relationship between corneal hysteresis and optic nerve parameters measured with spectral domain optical coherence tomography. Graefes Arch Clin Exp Ophthalmol. 2013;251(7):1777–1783. | ||
Grise-Dulac A, Saad A, Abitbol O, et al. Assessment of corneal biomechanical properties in normal tension glaucoma and comparison with open-angle glaucoma, ocular hypertension, and normal eyes. J Glaucoma. 2012;21(7):486–489. | ||
De Moraes CV, Hill V, Tello C, Liebmann JM, Ritch R. Lower corneal hysteresis is associated with more rapid glaucomatous visual field progression. J Glaucoma. 2012;21(4):209–213. | ||
Anand A, De Moraes CG, Teng CC, Tello C, Liebmann JM, Ritch R. Corneal hysteresis and visual field asymmetry in open angle glaucoma. Invest Ophthalmol Vis Sci. 2010;51(12):6514–6518. | ||
Mansouri K, Leite MT, Weinreb RN, Tafreshi A, Zangwill LM, Medeiros FA. Association between corneal biomechanical properties and glaucoma severity. Am J Ophthalmol. 2012;153(3):419–427. | ||
Jonas JB, Berenshtein E, Holbach L. Lamina cribrosa thickness and spatial relationships between intraocular space and cerebrospinal fluid space in highly myopic eyes. Invest Ophthalmol Vis Sci. 2004;45(8):2660–2665. | ||
Burgoyne CF, Downs JC, Bellezza AJ, Suh JK, Hart RT. The optic nerve head as a biomechanical structure: a new paradigm for understanding the role of IOP-related stress and strain in the pathophysiology of glaucomatous optic nerve head damage. Prog Retin Eye Res. 2005;24(1):39–73. | ||
Prata TS, Lima VC, Guedes LM, et al. Association between corneal biomechanical properties and optic nerve head morphology in newly diagnosed glaucoma patients. Clin Experiment Ophthalmol. 2012;40(7):682–688. | ||
Park SC, De Moraes CG, Teng CC, Tello C, Liebmann JM, Ritch R. Enhanced depth imaging optical coherence tomography of deep optic nerve complex structures in glaucoma. Ophthalmology. 2012;119(1):3–9. | ||
Park HYL, Jeon SH, Park CK. Enhanced depth imaging detects lamina cribrosa thickness differences in normal tension glaucoma and primary open angle glaucoma. Ophthalmology. 2012;119(1):10–20. | ||
Girard MJ, Tun TA, Husain R, et al. Lamina cribrosa visibility using optical coherence tomography: comparison of devices and effects of image enhancement techniques. Invest Ophthalmol Vis Sci. 2015;56(2):865–874. | ||
Leske MC, Heijl A, Hussein M, et al; Early Manifest Glaucoma Trial Group. Factors for glaucoma progression and the effect of treatment: the early manifest glaucoma trial. Arch Ophthalmol. 2003;121(1):48–56. | ||
Nemesure B, Wu SY, Hennis A, Leske MC. Corneal thickness and intraocular pressure in the Barbados eye studies. Arch Ophthalmol. 2003;121(2):240–244. | ||
Leske MC, Heijl A, Hyman L, et al; EMGT Group. Predictors of long-term progression in the early manifest glaucoma trial. Ophthalmology. 2007;114(11):1965–1972. | ||
European Glaucoma Prevention Study (EGPS) Group. Predictive factors for open-angle glaucoma among patients with ocular hypertension in the European Glaucoma Prevention Study. Ophthalmology. 2007;114(1):3–9. | ||
Gordon MO, Beiser JA, Brandt JD, et al. The Ocular Hypertension Treatment Study: baseline factors that predict the onset of primary open-angle glaucoma. Arch Ophthalmol. 2002;120(6):714–720. | ||
Medeiros FA, Alencar LM, Zangwill LM, Sample PA, Weinreb RN. The relationship between intraocular pressure and progressive retinal nerve fiber layer loss in glaucoma. Ophthalmology. 2009;116(6):1125–1133. | ||
European Glaucoma Prevention Study (EGPS) Group. Results of the European Glaucoma Prevention Study. Ophthalmology. 2005;112(3):366–375. | ||
AGIS Investigators. The Advanced Glaucoma Intervention Study (AGIS): 7. The relationship between control of intraocular pressure and visual field deterioration. Am J Ophthalmol. 2000;130(4):429–440. | ||
Kass MA, Heuer DK, Higginbotham EJ, et al. The Ocular Hypertension Treatment Study: a randomized trial determines that topical ocular hypotensive medication delays or prevents the onset of primary open-angle glaucoma. Arch Ophthalmol. 2002;120(6):701–713. |
 © 2016 The Author(s). This work is published and licensed by Dove Medical Press Limited. The
full terms of this license are available at https://www.dovepress.com/terms
and incorporate the Creative Commons Attribution
- Non Commercial (unported, 3.0) License.
By accessing the work you hereby accept the Terms. Non-commercial uses of the work are permitted
without any further permission from Dove Medical Press Limited, provided the work is properly
attributed. For permission for commercial use of this work, please see paragraphs 4.2 and 5 of our Terms.
© 2016 The Author(s). This work is published and licensed by Dove Medical Press Limited. The
full terms of this license are available at https://www.dovepress.com/terms
and incorporate the Creative Commons Attribution
- Non Commercial (unported, 3.0) License.
By accessing the work you hereby accept the Terms. Non-commercial uses of the work are permitted
without any further permission from Dove Medical Press Limited, provided the work is properly
attributed. For permission for commercial use of this work, please see paragraphs 4.2 and 5 of our Terms.