Back to Journals » International Journal of Chronic Obstructive Pulmonary Disease » Volume 11 » Issue 1
COPD exacerbations associated with the modified Medical Research Council scale and COPD assessment test among Humana Medicare members
Authors Pasquale MK, Xu Y, Baker CL ![]() , Zou KH
, Zou KH ![]() , Teeter JG, Renda A
, Teeter JG, Renda A ![]() , Davis C, Lee TC, Bobula J
, Davis C, Lee TC, Bobula J
Received 13 August 2015
Accepted for publication 7 November 2015
Published 14 January 2016 Volume 2016:11(1) Pages 111—121
DOI https://doi.org/10.2147/COPD.S94323
Checked for plagiarism Yes
Review by Single anonymous peer review
Peer reviewer comments 3
Editor who approved publication: Prof. Dr. Richard Russell
Margaret K Pasquale,1 Yihua Xu,1 Christine L Baker,2 Kelly H Zou,3 John G Teeter,4 Andrew M Renda,5 Cralen C Davis,1 Theodore C Lee,6 Joel Bobula2
1Comprehensive Health Insights, Inc., Humana Inc., Louisville, KY, 2Outcomes and Evidence, Global Health & Value, Pfizer Inc., 3Statistical Center for Outcomes, Real-World and Aggregate Data, Global Innovative Pharma Business, Pfizer Inc., New York, NY, 4Global Medical Development, Global Innovative Pharma Business, Pfizer Inc., Groton, CT, 5Retail Strategy & Execution, Humana Inc., Louisville, KY, 6Global Medical Affairs, Global Innovative Pharma Business, Pfizer Inc., New York, NY, USA
Background: The Global initiative for chronic Obstructive Lung Disease guidelines recommend assessment of COPD severity, which includes symptomatology using the modified Medical Research Council (mMRC) or COPD assessment test (CAT) score in addition to the degree of airflow obstruction and exacerbation history. While there is great interest in incorporating symptomatology, little is known about how patient reported symptoms are associated with future exacerbations and exacerbation-related costs.
Methods: The mMRC and CAT were mailed to a randomly selected sample of 4,000 Medicare members aged >40 years, diagnosed with COPD (≥2 encounters with International Classification of Diseases-9th Edition Clinical Modification: 491.xx, 492.xx, 496.xx, ≥30 days apart). The exacerbations and exacerbation-related costs were collected from claims data during 365-day post-survey after exclusion of members lost to follow-up or with cancer, organ transplant, or pregnancy. A logistic regression model estimated the predictive value of exacerbation history and symptomatology on exacerbations during follow-up, and a generalized linear model with log link and gamma distribution estimated the predictive value of exacerbation history and symptomatology on exacerbation-related costs.
Results: Among a total of 1,159 members who returned the survey, a 66% (765) completion rate was observed. Mean (standard deviation) age among survey completers was 72.0 (8.3), 53.7% female and 91.2% white. Odds ratios for having post-index exacerbations were 3.06, 4.55, and 16.28 times for members with 1, 2, and ≥3 pre-index exacerbations, respectively, relative to members with 0 pre-index exacerbations (P<0.001 for all). The odds ratio for high vs low symptoms using CAT was 2.51 (P<0.001). Similarly, exacerbation-related costs were 73% higher with each incremental pre-index exacerbation, and over four fold higher for high- vs low-symptom patients using CAT (each P<0.001). The symptoms using mMRC were not statistically significant in either model (P>0.10).
Conclusion: The patient-reported symptoms contribute important information related to future COPD exacerbations and exacerbation-related costs beyond that explained by exacerbation history.
Keywords: Global initiative for chronic Obstructive Lung Disease, COPD symptomatology, exacerbations, exacerbation-related cost, survey data
Introduction
COPD is a major public health problem due to its high incidence and related morbidity and mortality.1–3 A diagnosis of COPD was reported for 6.3% of adults aged 18 years and older in the USA in 2011,4 and the disease was more prevalent in older age groups and in women more than men.5 However, fewer than half of Americans with airflow obstruction have actually received a diagnosis of COPD, and a severe undertreatment has been observed for those with a diagnosis of the disease.6,7 Chronic lower respiratory diseases are the third leading cause of death in the USA and pose significant health and economic burdens on society.8 The direct and indirect costs of COPD were estimated at a total of $36 billion for the year 2010,9 with hospitalizations due to severe exacerbations accounting for the majority of medical costs.10,11
Patients with COPD have a progressive condition in which airflow is consistently obstructed making it difficult for them to breathe.12,13 These patients may experience an acute worsening of respiratory symptoms such as elevated sputum volume, purulence, and dyspnea, which is defined as an exacerbation.14–16 Exacerbations are often associated with acute health care utilization, such as emergency room visits and hospitalizations. In addition, associated with COPD progression, exacerbations accelerate the rate of decline in lung function as measured by forced expiratory volume in 1 second (FEV1).12,17
The Global initiative for chronic Obstructive Lung Disease (GOLD) has historically provided guidelines for COPD assessment and treatment purely on the basis of the degree of airflow limitation as measured by spirometry.18 The patients with COPD have been classified into severity stages I–IV on the basis of post-bronchodilator FEV1. More recently, however, the GOLD guidelines have been expanded to recommend a combined assessment of COPD severity, which includes both symptomatology using the modified Medical Research Council (mMRC) score or COPD assessment test (CAT) score, as well as risk as determined by the degree of airflow obstruction and exacerbation history.19 While there is great interest in incorporating symptomatology into overall COPD assessment, little is known about how responses to questions in these two instruments are associated with the relative severity of COPD outcomes among the respondents.
Using observational data to assess these guidelines, this study administered the mMRC and CAT to Medicare members aged 40 years and older enrolled with a large national health insurance provider, Humana Inc. (Louisville, KY, USA), and linked each member’s survey responses to his or her claims data contained in the Humana Research Database. This allowed for retrieval of each member’s exacerbation history and thus GOLD classification. The claims data were then followed for 365-day post-survey to determine whether patient-reported symptoms added valuable information beyond exacerbation history in predicting future exacerbations.
Patients and methods
Data sources
This observational study utilized retrospective administrative claims data and prospectively collected survey data from Humana Inc. The Humana Research Database contains enrollment, medical, and pharmacy claims for Humana’s commercial and Medicare fully-insured patients. The data required for COPD member identification and post-survey follow-up were collected retrospectively from the administrative claims data. Responses to the mMRC and CAT were collected from Humana members via mailed survey. Each member’s survey responses were then linked to his/her administrative claims data for analysis. The study was approved by Schulman IRB.
Study design
Humana Medicare members aged 40 years or older, with two or more incidents of inpatient or outpatient encounters for COPD ≥30 days apart (International Classification of Diseases 9th Edition Clinical Modification [ICD-9-CM]: 491.xx, 492.xx, or 496.xx), were identified during the identification period from January 1, 2009 to March 31, 2013. Members were excluded if they had any of the following diagnoses: cancer (ICD-9-CM: 140.xx–172.xx; 174.xx–208.xx), pregnancy (ICD-9-CM: 630.xx–679.xx, V22.xx, and V23.xx), or organ transplants (V42.xx), stayed in a skilled nursing facility for ≥90 days, or were not continuously enrolled for a minimum of 365 days before their most recent date of enrollment. Among these COPD members, 4,000 were randomly selected to participate in a mailed survey (Supplementary material A), which included the mMRC and CAT instruments. In order to avoid ordering bias, two versions of the survey were administered: one version listed CAT first, and a second version listed mMRC first. The index date was assigned to the end date of survey collection (August 18, 2013). Baseline univariate analyses linked patient reported symptoms to each patient’s demographic and clinical characteristics. The COPD-related exacerbations as well as exacerbation-related costs were then examined from the Humana Research Database during 365 days of post-survey follow-up to determine whether the patient-reported symptoms added valuable information beyond exacerbation history in predicting future exacerbations and costs.
The GOLD guidelines recommend a patient classification for risk of exacerbation be dependent on FEV1 or the history of exacerbations, whichever is worse; however, for this study, a history of exacerbations was used exclusively, since FEV1 measures were not available in the claims data. The categories used in this study were therefore an approximation of the GOLD guideline categories.
The exacerbations identified in the claims data were adapted from Mapel et al20 and Stein et al21, and defined by ICD-9-CM codes in any diagnosis position (see Supplementary material B for ICD-9-CM codes). An overnight inpatient hospital stay with one or more documented of the ICD-9-CM codes was defined as severe while all outpatient visits accompanied by prescriptions for systemic corticosteroids or antibiotics22 within ±7 days of the outpatient visit were defined as moderate. Members were excluded from the follow-up analysis if they were lost to follow-up or met any of the exclusion criteria during follow-up.
In addition to exacerbations, two comorbidity index scores were calculated from the claims data for inclusion in the analysis: the Deyo–Charlson and RxRisk-V comorbidity index scores. The Deyo–Charlson comorbidity index score (DCI) uses 17 categories of comorbidities to calculate a score, which reflects the cumulative increased likelihood of 1-year mortality. It is based on ICD-9-CM diagnosis and procedural codes, and their associated weights.23 The RxRisk-V (RxRisk assessment instrument adapted for the Veterans Health Administration population) is determined on the basis of the identification of 45 distinct comorbid conditions via their associated medication treatments.24–27
Statistical analysis
Univariate analysis was used to compare symptoms, as well as demographic and clinical characteristics, between survey respondents and non-respondents, and among respondents who completed the survey vs those who submitted incomplete responses to the survey (completers vs non-completers). Descriptive statistics such as means and standard deviations (SDs) were presented for continuous measures. Counts and proportions were presented for categorical measures. The chi-square test and Fisher’s exact test were used to compare categorical measures and t-tests were used to compare continuous measures. The CAT and mMRC agreement were assessed using the Kappa statistic, and their association was measured using Spearman correlation. All tests were two-sided.
A multivariate binary stepwise logistic regression model was used to estimate the predictive value of exacerbation history and symptomatology for post-index exacerbations. The dependent variable was whether a patient had one or more exacerbations during the 365-day post-index period (1= yes, 0= no). Variables for exacerbation history, high- vs low-symptom categories according to the mMRC (≥2 vs <2) and CAT (≥10 vs <10), and other demographic and clinical characteristics were considered using a stepwise selection approach to select statistically significant predictors for the final model. The stepwise selection method is a modification of the forward-selection technique and differs in that variables already in the model do not necessarily stay there. A significance threshold of <0.05 (two-sided) was used to allow a variable to stay in the final model. A generalized linear model with log link and gamma distribution was used to model the association between exacerbation-related costs in the 365-day post-index period and pre-index symptoms, pre-index exacerbations, and other demographic and clinical characteristics, as costs are known to have a non-normal distribution as well as non-constant variance.28 All P-values were two-sided and statistical significance was reached when P<0.05. The data analyses were conducted using SAS Enterprise Guide 5.1 (SAS Institute Inc., Cary, NC, USA).
Results
The subject flow diagram (Figure 1) displays the sample sizes of Humana members with COPD remaining for analysis at each step of the study. There were 182,504 COPD members identified in Humana’s claims data after inclusion/exclusion criteria were applied from which 4,000 were randomly selected for survey participation. Of the 1,159 members who responded to the survey (29.0% response rate), 765 (66% of respondents; 19% of the overall sample) completed both the mMRC and CAT components (Figure 1).
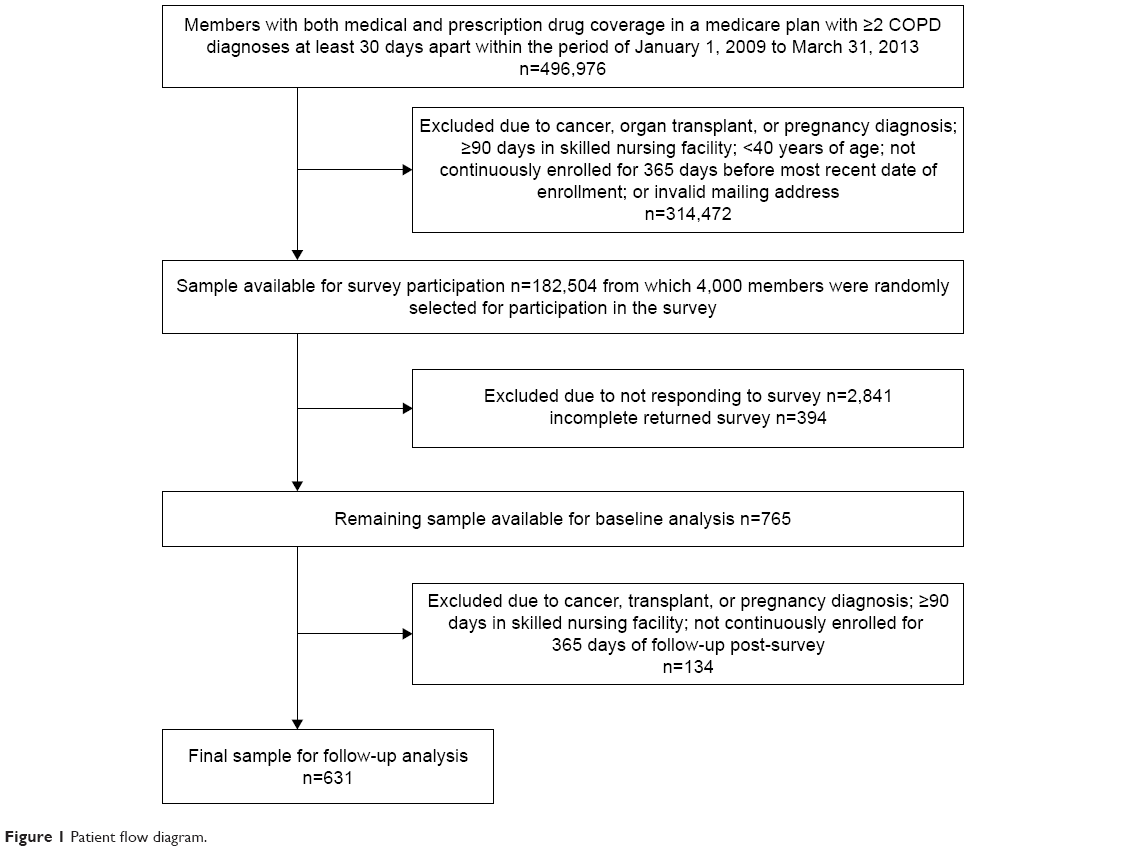 | Figure 1 Patient flow diagram. |
Comparisons of baseline demographic and clinical characteristics between respondents vs non-respondents and completers vs non-completers (among respondents) are displayed in Table 1. Mean age (SD) was similar for respondents and non-respondents at 72.2 (8.5) years old vs 72.0 (9.5) years old, respectively (P=0.640), but the proportion aged ≥65 years was slightly higher for the respondents than the non-respondents (P=0.029). A higher percentage of respondents were white (89.3% for respondents vs 85.8% for non-respondents, P=0.024), and a lower percentage of respondents resided in the South (59.9% for respondents and 68.0% for non-respondents, P<0.001). The mean RxRisk-V score (SD) was statistically significantly lower for respondents (5.7 [3.7]) in comparison to non-respondents (6.0 [3.8], P=0.014), but the DCI score was not significantly different between the two groups (P=0.135). Non-respondents had higher rates of diabetes than respondents at 36.4% for non-respondents vs 31.4% for respondents (P=0.003). Among survey completers vs non-completers, a slightly higher percentage of completers were white (91.2% for completers vs 85.5% for non-completers, P=0.031) and a lower percentage of completers resided in the South (57.9% for completers and 63.7% for non-completers, P=0.043). A lower percentage of completers qualified for low income subsidy (LIS) and were dual eligible (13.3% completers vs 17.8% non-completers, P=0.044). The mean RxRisk-V comorbidity score (SD) was slightly higher for non-completers (6.0 [3.7]) compared to completers (5.6 [3.8], P=0.033), but the DCI score was similar (P=0.877).
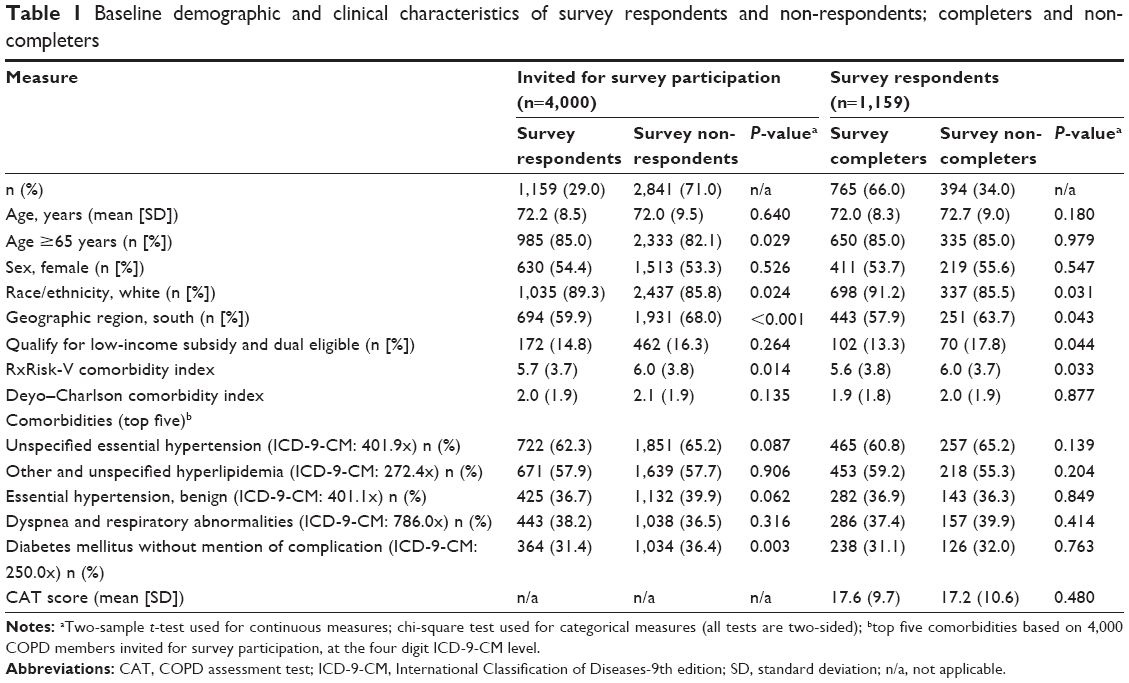 | Table 1 Baseline demographic and clinical characteristics of survey respondents and non-respondents; completers and non-completers |
Of note, the order in which the mMRC and CAT questions were listed affected the completion of the mMRC. Completion on CAT was similar between the two versions: 90% for one vs 89% for the other; however, for mMRC, the completion was 85% for the version that listed the mMRC after the CAT and only 55% for the version that listed the mMRC first (not shown). The mean (SD) of the CAT scores was 17.6 (9.7) for members who completed the mMRC and 17.2 (10.6) for members who did not complete the mMRC (P=0.480, Table 1).
Table 2 reports demographic and clinical characteristics of high-symptom vs low-symptom members according to the mMRC and CAT. High-symptom members according to the mMRC were younger (mean age [SD], 70.3 [9.0]) than low-symptom members (mean age [SD], 73.3 [7.4], P<0.001). A larger proportion of high-symptom members qualified for LIS and dual eligibility (P<0.001). High-symptom members according to the mMRC had significantly higher mean comorbidity scores (SD) than low-risk members: 6.6 (3.9) vs 4.7 (3.5) for the RxRisk-V score, 2.3 (2.0) vs 1.7 (1.7) for the DCI (P<0.001 for both comparisons). Among comorbidities, high-symptom members had higher rates of dyspnea and respiratory abnormalities (43.8% vs 32.0%, P<0.001), and diabetes mellitus (37.3% vs 26.0%, P<0.001) than low-symptom members (Table 2).
 | Table 2 Baseline demographic and clinical characteristics of low- and high-symptom patients by mMRC and CAT among survey completers (n=765) |
Similar to the mMRC, high-symptom members according to the CAT were younger (mean age [SD], 71.3 [8.5]) than low-symptom members (mean age 74.1 [7.1], P<0.001) and had a higher percent of white members (92.1% vs 88.7%, P=0.027, Table 2). As expected, high-symptom members according to the CAT had significantly higher mean (SD) comorbidity scores than low-symptom members: 6.0 (3.8) vs 4.3 (3.3) for the RxRisk-V score (P<0.001), and 2.0 (1.9) vs 1.7 (1.8) for the DCI (P=0.014). Among comorbidities, high-symptom members had higher rates of dyspnea and respiratory abnormalities (40.5% vs 27.6%, P=0.002) than low-symptom members.
The GOLD classification by symptom categories is reported in Table 3. The proportion of members classified as a high symptom by both instruments was 42.2%, and classified as low symptom by both instruments was 22.5%, for a total of 64.7% agreement in the categories. The Kappa statistic (95% confidence interval [CI]) was 0.331 (0.27–0.39), indicating fair agreement between the two instruments. The Spearman correlation coefficient estimate for the raw scores of the mMRC and CAT was 0.63 (P<0.001).
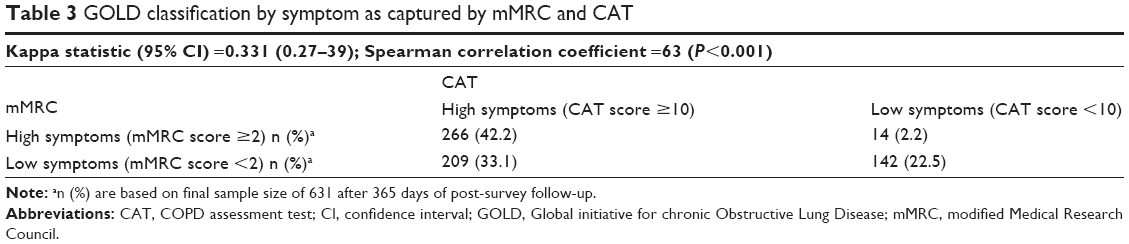 | Table 3 GOLD classification by symptom as captured by mMRC and CAT |
The GOLD classification by symptom and exacerbation history is reported in Table 4. The GOLD classifications A and B include all the patients with a history of 0 or 1 exacerbations in the earlier year, while GOLD classifications C and D include all the patients with a history of 2 or more exacerbations in the earlier year. A significant proportion of the sample was categorized in a GOLD category B indicating low exacerbation history but high patient-reported symptoms (33.0% according to the mMRC instrument and 60.1% according to the CAT instrument). A very small proportion of members with a history of 2 or more exacerbations reported low symptoms (6.7% according to the mMRC and 2.9% according to the CAT).
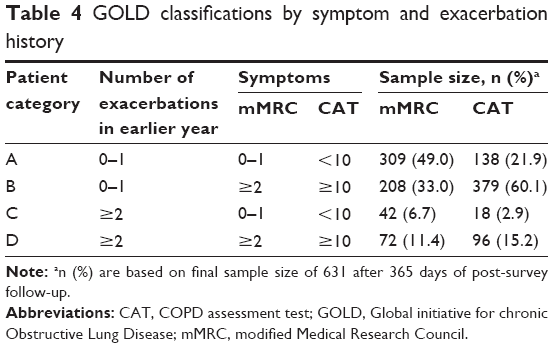 | Table 4 GOLD classifications by symptom and exacerbation history |
The exacerbations during follow-up are displayed by GOLD classifications according to the mMRC in Figure 2A and the CAT in Figure 2B. Mean numbers of exacerbations during the follow-up period were lower for the low-symptom patients than for the high-symptom patients whether symptoms according to the mMRC or CAT were compared (P<0.001 based on two sample t-test). For each of the four categorizations by symptom and exacerbation history, the mean number of exacerbations was directionally higher using the mMRC rather than the CAT. In general, the number of follow-up exacerbations rose as risk or pre-index exacerbations, and patient-reported symptoms increased from GOLD category A through GOLD category D.
 | Figure 2 Exacerbations during follow-up by risk and symptoms. |
The stepwise logistic regression results are reported in Table 5. This table reports results from a regression model that included symptoms and exacerbation history as separate, independent variables as well as results from a regression model that included independent variables, which combined symptoms and exacerbation history into GOLD classifications A–D. For the model that included symptoms and exacerbation history as separate, independent variables, pre-index exacerbations and symptoms by CAT were all statistically significantly associated with having post-index exacerbations (P<0.001), with the odds ratio (OR) for one pre-index exacerbation =3.06, two pre-index exacerbations =4.55, and three or more pre-index exacerbations =16.28, relative to the reference group with 0 pre-index exacerbations. The OR for high symptoms relative to low symptoms according to the CAT was 2.51. The parameter estimate for the symptoms variable by mMRC was not statistically significant and was not included in the final model.
 | Table 5 Logistic regression of factors associated with post-index exacerbations (≥1/0)a |
Replacing the separate variables for pre-index exacerbations and symptoms by CAT or mMRC with the approximated GOLD A–D classifications as independent variables resulted in similar findings (Table 5). Consistent with the first model reported in Table 5, the GOLD classification variables by CAT were significantly associated with having post-index exacerbations (P<0.001). The value of the ORs increased with each successive GOLD category B, C, and D relative to the reference category A (3.07, 6.15, and 13.67, respectively, P<0.001).
Table 6 displays the generalized linear model results associated with post-index exacerbation-related costs. Consistent with Table 5, the parameter estimate for pre-index exacerbations was statistically significant (exponentiated estimate =1.73, P<0.001), as was the parameter estimate for high vs low patient-reported symptoms captured by the CAT instrument (exponentiated estimate =4.14, P<0.001). The exponentiated estimate translates into an exacerbation-related mean cost difference of $413.80 for patients with high symptoms vs patients with low symptoms. The parameter estimate for symptoms captured by the mMRC instrument was not statistically significant in the exacerbation-related cost model, which is consistent with findings in Table 5.
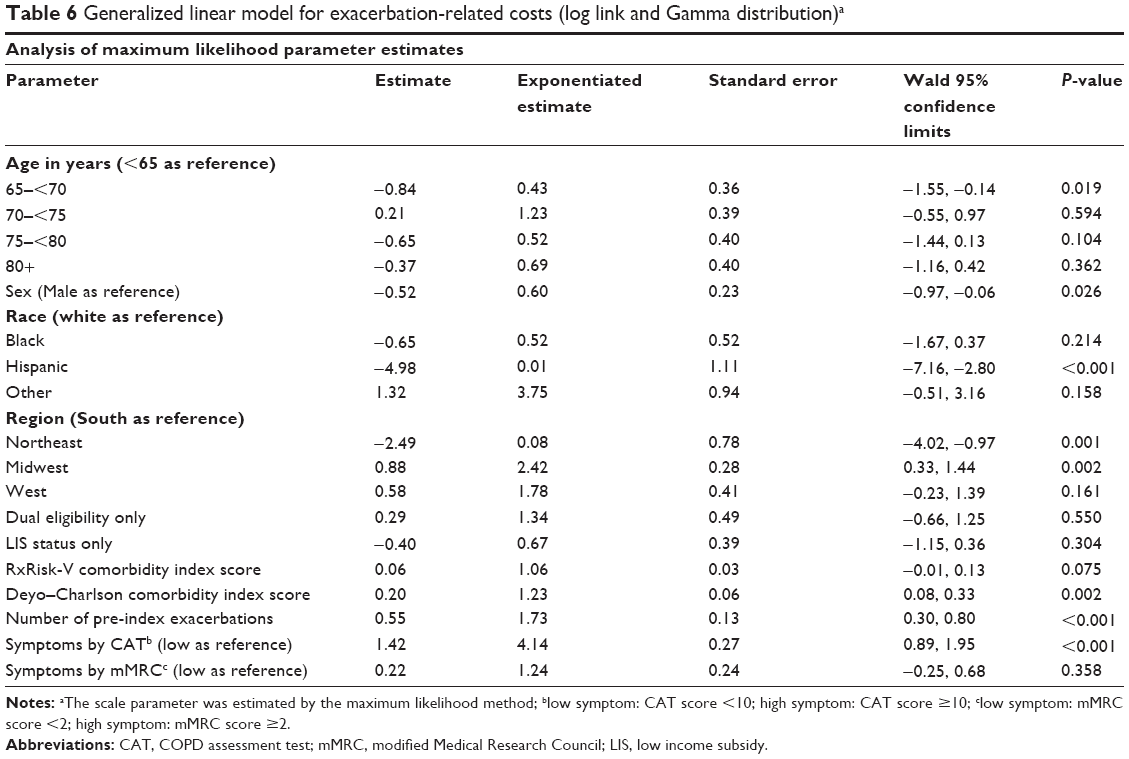 | Table 6 Generalized linear model for exacerbation-related costs (log link and Gamma distribution)a |
Discussion
In general, there were significant differences in the patient characteristics, which distinguished high-symptom members from low-symptom members, whether the information was obtained from the mMRC or CAT (Table 2). These differences were consistent with the demographic and clinical characteristics obtained from the administrative claims data for each survey respondent (Tables 1 and 2). High-symptom patients were younger, and, as expected, had higher comorbidity index scores whether the RxRisk-V or DCI scores were applied, and higher rates of specific comorbidities. According to the mMRC, high-symptom members had higher rates of dyspnea and respiratory abnormalities, diabetes, and chest pain, as compared to low-symptom members. High-symptom members according to the CAT had much higher rates of dyspnea and respiratory abnormalities and chest pain than low-symptom members, but not higher rates of diabetes. The higher comorbidity index scores and rates of dyspnea and respiratory abnormalities appeared consistent with Lange et al,29 who further indicated that higher dyspnea predicted increased mortality.
Interestingly, nearly all the mean comorbidity scores were slightly higher for both the low- and high-symptom members according to the threshold set for the mMRC relative to the CAT. For example, the mean RxRisk-V score for low-symptom members was 4.7 according to the mMRC, but 4.3 according to CAT; for high-symptom members the mean RxRisk-V score was 6.6 according to the mMRC (n=349), but 6.0 according to CAT (n=580, Table 2). In addition, the mean DCI for high-symptom members was 2.3 by mMRC and 2.0 by CAT (Table 2). These results, coupled with only fair agreement between the instruments as indicated by the kappa statistic of 0.331,30 are consistent with Price et al31 who found inconsistencies in patient classification among the mMRC and CAT, and suggested an alternative higher threshold of 24–26 for the CAT instrument to produce better alignment between the CAT and mMRC.
However, while Price et al examined consistency between the two instruments, their study did not examine which instrument better predicted future exacerbations and exacerbation-related costs. The stepwise logistic regression results from our study specifically examined the relationship between future exacerbations and exacerbation history, as well as symptoms by mMRC and CAT separately, in order to shed light on this matter. The results indicated that symptoms indeed provide additional valuable information above and beyond exacerbation history, in that both the symptoms and exacerbation history each independently predicted whether a patient would experience one or more exacerbations in the future. These results suggest that patients may be aware of periodic worsening of symptoms even if these episodes have not been identified as exacerbations of COPD, consistent with a summary of the importance of symptoms in the GOLD guidelines.18
These findings are also consistent with Nakahara et al, who examined body mass index, pulmonary function tests, CAT scores, and history of exacerbation within the earlier year as predictors for future exacerbations in a sample of patients with COPD in Japan.32 In their multivariate analysis, only CAT scores (hazard ratio =1.06, P=0.006) and a history of exacerbation within the earlier year (hazard ratio =4.76, P<0.001) were significant predictors of acute exacerbation. Notably, in our study, the variable for high vs low symptoms as captured by the CAT instrument was a better predictor of future exacerbation than symptoms captured by the mMRC instrument, as the latter variable did not appear in the final model. It may be that the CAT instrument, comprised of eight questions and with scores ranging from 0–40, was able to capture more symptom domains than the mMRC instrument, comprised of one question, with scores ranging from 0–4.
Inclusion of approximated GOLD classifications as covariates in the stepwise logistic regression model, rather than including symptoms and exacerbation history separately, resulted in statistically significant parameter estimates and corresponding ORs that increased incrementally for GOLD categories B, C, and D, relative to GOLD category A. These results are consistent with a study by Chen et al,33 who found the relative risk of exacerbation relative to GOLD category A was 1.7 (95% CI =0.6–4.3) for Group B, 14.1 (95% CI =4.6–43.2) for Group C, and 17.9 (95% CI =7.6–42.0) for Group D. The Hosmer and Lemeshow Goodness-of-Fit chi-square test and c statistic indicated a better model fit and prediction accuracy when symptoms and exacerbation history were included as separate variables than when they were combined as GOLD categories in the model (Table 5).
As for the relative importance of symptom vs exacerbation history in predicting future exacerbations, the ORs for each incremental exacerbation during the earlier year (1, 2, and 3+, relative to 0) were greater than for the variable indicating high vs low symptoms as captured by the CAT instrument, suggesting the increased importance of exacerbation history. The ordering of GOLD categories A–D sheds additional light on this comparison. In Table 5, ORs increased across each approximated GOLD category. If symptoms were more important than exacerbation history, then it is likely that the magnitude of the parameter estimates and ORs for GOLD categories B (low-risk/high-symptom) and C (high-risk/low-symptom) would have been reversed. This result is consistent with an earlier study that found the best predictor of current exacerbations is a patient’s exacerbation history.34
Limitations and suggestions for future research
This study is limited by the fact that spirometry results were not available in the claims data for the patients with COPD. Risk may have been better categorized by a comparison of FEV1 values and exacerbation history, using whichever value was worse to categorize a patient into GOLD categories A–D, in accordance with the GOLD guidelines. Due to the unavailability of spirometry values, this study relied solely on the exacerbation history from the claims data. As such, it is not known how the relative value of patient-reported symptoms would be altered with the inclusion of FEV1 values.
The identification of patients with COPD for this study relied on physician diagnosis and coding on claims submitted to Humana for reimbursement, which comprised the Humana Research Database. Smoking history was not well-coded. While it is hoped that physician diagnosis and coding accurately reflected the presence of the disease, it is possible that misdiagnoses may have occurred. Furthermore, an exacerbation was identified via an algorithm developed by the study team after reviewing published algorithms and updating with input from clinical experts on the study team. Exacerbations that required clinical attention, ie, outpatient visits or inpatient stays, were identified. However, any exacerbations treated at home were not captured in claims data. Such exacerbations may be of lower severity, or a result of differences in physician practice patterns, the latter of which is a limitation of this study. Future work should involve validation of this algorithm via chart review.
The patients classified in GOLD category B with low exacerbation history but high symptoms comprised a significant portion of the surveyed population (33.0% according to mMRC and 60.1% according to CAT, Tables 3 and 4). Since dyspnea is a cardinal symptom of COPD, it is unknown whether this group’s symptoms were predominantly being driven by their non-COPD comorbidities, since their exacerbation history was not consistent with their symptoms, or whether the symptoms indicated a worsening of their COPD condition. Future research should include the collection of FEV1 values and their comparison with symptoms at the time of survey completion. In addition to FEV1 values, inclusion of patients’ treatment regimens could help predict future exacerbations.
Surveys can be subjective and the quality of the responses may be based on the educational status of patients. However, both the mMRC and CAT were validated instruments containing questions that were simple and easy to read. All cover letters were written at the sixth grade reading level to mitigate any bias due to educational status as much as possible.
The order in which the mMRC and CAT questions were listed affected the completion of the mMRC. This discrepancy may have been due to confusion by some members who received a version of the survey with the mMRC listed first; who may have thought the mMRC was an example question within the survey rather than an actual question that was to be answered. Additional clarifying language may be needed in future surveys assessing an individual’s mMRC breathlessness score; however, the lack of difference in baseline characteristics between completers and non-completers of the mMRC indicated robustness of the results.
Because this study used data from a particular database comprised of records from Humana members only, the results may not be generalized to the general population; however, Humana is a large national health plan with members residing in a broad array of geographic regions.
Conclusion
The patient-reported symptoms captured by the mMRC and CAT instruments contribute important information related to future exacerbations and exacerbation-related costs, beyond that measured by exacerbation history. As such, patient-reported symptoms should be seriously considered in determining treatment for patients with COPD. Furthermore, this study suggests patient-reported symptoms measured by the CAT instrument more effectively predict future exacerbations and exacerbation-related costs than those measured by the mMRC instrument.
Acknowledgment
This manuscript was edited by Mary Costantino, PhD, an employee of Comprehensive Health Insights, Inc., a wholly owned subsidiary of Humana, and funded by Pfizer Inc.
Disclosure
This study was sponsored by Pfizer Inc. MK Pasquale, Y Xu, and CC Davis are employees of Comprehensive Health Insights, Inc., a wholly owned subsidiary of Humana. CL Baker, KH Zou, JG Teeter, TC Lee, and J Bobula are employees and stockholders of Pfizer Inc. AM Renda is an employee of Humana Inc. Comprehensive Health Insights received funding from Pfizer for conducting this study and for the development of this manuscript.
References
American Lung Association. Trends in COPD (chronic bronchitis and emphysema): morbidity and mortality. Available from: http://www.lung.org/finding-cures/our-research/trend-reports/copd-trend-report.pdf. Accessed June 12, 2015. | ||
Guarascio AJ, Ray SM, Finch CK, Self TH. The clinical and economic burden of chronic obstructive pulmonary disease in the USA. Clinicoecon Outcomes Res. 2013;5:235–245. | ||
Doll H, Miravitlles M. Health-related QOL in acute exacerbations of chronic bronchitis and chronic obstructive pulmonary disease: a review of the literature. Pharmacoeconomics. 2005;23(4):345–363. | ||
Centers for Disease Control and Prevention (CDC). Chronic obstructive pulmonary disease among adults – United States, 2011. MMWR Morb Mortal Wkly Rep. 2012;61(46):938–943. | ||
Akinbami LJ, Liu X. Chronic obstructive pulmonary disease among adults aged 18 and over in the United States, 1998–2009. NCHS Data Brief. 2011;(63):1–8. | ||
Wilt TJ, Niewoehner D, Kim C, et al. Use of spirometry for case finding, diagnosis, and management of chronic obstructive pulmonary disease (COPD). Evid Rep Technol Assess (Summ). 2005;(121):1–7. | ||
Ingebrigtsen TS, Marott JL, Vestbo J, et al. Characteristics of undertreatment in COPD in the general population. Chest. 2013;144(6):1811–1818. | ||
Kochanek KD, Xu J, Murphy SL, Miniño AM, Kung H-C. Deaths: final data for 2009. Natl Vital Stat Rep. 2011;60(3):1–116. | ||
Ford ES, Murphy LB, Khavjou O, Giles WH, Holt JB, Croft JB. Total and state-specific medical and absenteeism costs of COPD among adults aged ≥18 years in the United States for 2010 and projections through 2020. Chest. 2015;147(1):31–45. | ||
Toy EL, Gallagher KF, Stanley EL, Swensen AR, Duh MS. The economic impact of exacerbations of chronic obstructive pulmonary disease and exacerbation definition: a review. COPD. 2010;7(3):214–228. | ||
Pasquale MK, Sun SX, Song F, Hartnett HJ, Stemkowski SA. Impact of exacerbations on health care cost and resource utilization in chronic obstructive pulmonary disease patients with chronic bronchitis from a predominantly Medicare population. Int J Chron Obstruct Pulmon Dis. 2012;7:757–764. | ||
Burge S, Wedzicha JA. COPD exacerbations: definitions and classifications. Eur Respir J Suppl. 2003;41:46s–53s. | ||
American Lung Association. COPD. Available from: http://www.lung.org/lung-disease/copd/. Accessed June 12, 2015. | ||
Donaldson GC, Seemungal TA, Bhowmik A, Wedzicha JA. Relationship between exacerbation frequency and lung function decline in chronic obstructive pulmonary disease. Thorax. 2002;57(10):847–852. | ||
Waschki B, Kirsten AM, Holz O, et al. Disease progression and changes in physical activity in patients with Chronic Obstructive Pulmonary Disease. Am J Respir Crit Care Med. 2015;192(3):295–306. | ||
Nagai K, Makita H, Suzuki M, et al. Differential changes in quality of life components over 5 years in chronic obstructive pulmonary disease patients. Int J Chron Obstruct Pulmon Dis. 2015;10:745–757. | ||
Kanner RE, Anthonisen NR, Connett JE. Lower respiratory illnesses promote FEV(1) decline in current smokers but not ex-smokers with mild chronic obstructive pulmonary disease: results from the lung health study. Am J Respir Crit Care Med. 2001;164(3):358–364. | ||
Global initiative for chronic Obstructive Lung Disease. Global strategy for diagnosis, management and prevention of COPD. Feb. 2015; Available from: http://www.goldcopd.org/uploads/users/files/GOLD_Report_2015_Feb18.pdf. Accessed May 12, 2015. | ||
Global initiative for chronic Obstructive Lung Disease. At-a-glance outpatient management reference for COPD, based on the Global strategy for diagnosis, management and prevention of COPD. 2014; Available from: http://www.goldcopd.org/uploads/users/files/GOLD_AtAGlance_2014_Jun11.pdf. Accessed June 10, 2015. | ||
Mapel DW, Dutro MP, Marton JP, Woodruff K, Make B. Identifying and characterizing COPD patients in US managed care. A retrospective, cross-sectional analysis of administrative claims data. BMC Health Serv Res. 2011;11:43. | ||
Stein BD, Charbeneau JT, Lee TA, et al. Hospitalizations for acute exacerbations of chronic obstructive pulmonary disease: how you count matters. COPD. 2010;7(3):164–171. | ||
Bartlett JG, Sethi S. Management of infection in active exacerbations of chronic obstructive pulmonary disease. Wolters Kluwer Health UpToDate. 2015. Available from: http://www.uptodate.com/contents/management-of-infection-in-exacerbations-of-chronic-obstructive-pulmonary-disease?source=see_link. Accessed June 10, 2015. | ||
Deyo RA, Cherkin DC, Ciol MA. Adapting a clinical comorbidity index for use with ICD-9-CM administrative databases. J Clin Epidemiol. 1992;45(6):613–619. | ||
Sloan KL, Sales AE, Liu CF, et al. Construction and characteristics of the RxRisk-V: a VA-adapted pharmacy-based case-mix instrument. Med Care. 2003;41(6):761–774. | ||
Sales AE, Liu CF, Sloan KL, et al. Predicting costs of care using a pharmacy-based measure risk adjustment in a veteran population. Med Care. 2003;41(6):753–760. | ||
Fishman PA, Goodman MJ, Hornbrook MC, Meenan RT, Bachman DJ, O’Keeffe Rosetti MC. Risk adjustment using automated ambulatory pharmacy data: the RxRisk model. Med Care. 2003;41(1):84–99. | ||
Farley JF, Harley CR, Devine JW. A comparison of comorbidity measurements to predict healthcare expenditures. Am J Manag Care. 2006;12(2):110–119. | ||
Blough DK, Ramsey SD. Using generalized linear models to assess medical care costs. Health Serv Outcomes Res Methodol. 2000;1(2):185–202. | ||
Lange P, Marott JL, Vestbo J, et al. Prediction of the clinical course of chronic obstructive pulmonary disease, using the new GOLD classification: a study of the general population. Am J Res Crit Care Med. 2012;186(10):975–981. | ||
Viera AJ, Garrett JM. Understanding interobserver agreement: the kappa statistic. Family Med. 2005;37(5):360–363. | ||
Price DB, Baker CL, Zou KH, Higgins VS, Bailey JT, Pike JS. Real-world characterization and differentiation of the Global Initiative for Chronic Obstructive Lung Disease strategy classification. Int J Chron Obstruct Pulmon Disease. 2014;9:551–561. | ||
Nakahara Y, Taniguchi H, Kondoh Y, et al. COPD Assessment Test as a predictive factor of acute exacerbation of Chronic Obstructive Pulmonary Disease. Respirology. 2013;18(S4):125. | ||
Chen C-Z, Ou C-Y, Yu C-H, Yang S-C, Chang H-Y, Hsiue T-R. Comparison of global initiative for chronic obstructive pulmonary disease 2013 classification and body mass index, airflow obstruction, dyspnea, and exacerbations index in predicting mortality and exacerbations in elderly adults with chronic. J Am Geriatr Soc. 2015;63(2):244–250. | ||
Hurst JR, Vestbo J, Anzueto A, et al. Susceptibility to exacerbation in chronic obstructive pulmonary disease. N Engl J Med. 2010;363(12):1128–1138. doi:1110.1056/NEJMoa0909883. |
 © 2016 The Author(s). This work is published and licensed by Dove Medical Press Limited. The
full terms of this license are available at https://www.dovepress.com/terms
and incorporate the Creative Commons Attribution
- Non Commercial (unported, 3.0) License.
By accessing the work you hereby accept the Terms. Non-commercial uses of the work are permitted
without any further permission from Dove Medical Press Limited, provided the work is properly
attributed. For permission for commercial use of this work, please see paragraphs 4.2 and 5 of our Terms.
© 2016 The Author(s). This work is published and licensed by Dove Medical Press Limited. The
full terms of this license are available at https://www.dovepress.com/terms
and incorporate the Creative Commons Attribution
- Non Commercial (unported, 3.0) License.
By accessing the work you hereby accept the Terms. Non-commercial uses of the work are permitted
without any further permission from Dove Medical Press Limited, provided the work is properly
attributed. For permission for commercial use of this work, please see paragraphs 4.2 and 5 of our Terms.