Back to Journals » International Journal of Nanomedicine » Volume 13
Controlled quercetin release from high-capacity-loading hyperbranched polyglycerol-functionalized graphene oxide
Authors Islami M, Zarrabi A ![]() , Tada S, Kawamoto M, Isoshima T
, Tada S, Kawamoto M, Isoshima T ![]() , Ito Y
, Ito Y ![]()
Received 27 June 2018
Accepted for publication 9 August 2018
Published 5 October 2018 Volume 2018:13 Pages 6059—6071
DOI https://doi.org/10.2147/IJN.S178374
Checked for plagiarism Yes
Review by Single anonymous peer review
Peer reviewer comments 4
Editor who approved publication: Dr Thomas Webster
Matin Islami,1 Ali Zarrabi,1 Seiichi Tada,2 Masuki Kawamoto,2,3 Takashi Isoshima,3 Yoshihiro Ito2,3
1Department of Biotechnology, Faculty of Advanced Sciences and Technologies, University of Isfahan, Isfahan 8174673441, Iran; 2Emergent Bioengineering Materials Research Team, RIKEN Center for Emergent Matter Science, Wako, Saitama 351-0198, Japan; 3Nano Medical Engineering Laboratory, RIKEN Cluster for Pioneering Research, Wako, Saitama 351-0198, Japan
Purpose: An efficient drug-delivery system was prepared based on graphene oxide using a facile and one-step strategy for controlling the release of anticancer drugs.
Methods: Fabrication of single-layer graphene oxide (GO) sheets was carried out by both modified and improved Hummers method. Biocompatible hyperbranched polyglycerol (HPG) was grafted on the surface of GO through the ring-opening hyperbranched polymerization of glycidol. Various ratios of GO and glycidol were used for polymer grafting. An anticancer drug, quercetin (Qu), was loaded into modified GO via noncovalent interactions.
Results: Polymer grafting on the surface of GO sheets was confirmed by results obtained from Fourier-transform infrared and Raman spectroscopy, thermogravimetric analysis, energy-dispersive X-ray and X-ray spectroscopy, scanning electron microscopy, and atomic force microscopy. It was revealed that polymerization increased d-spacing between the basal planes. In addition, as a hydrophilic polymer, HPG improved the stability and dispersion of GO sheets in biological solutions and endowed extra drug-loading capacity for the sheets. The effect of hyperbranched structure on drug loading and release was investigated by comparing drug loading and release for HPG-modified GO and linear PPO-modified GO. Our experiments indicated high drug-loading capacity (up to 185%), and excellent encapsulation efficiency (up to 93%) for HPG-GO compared to linear PO-grafted GO. The release profile of Qu under various pH levels exhibited controlled and sustained drug release without an initial burst effect for HPG-GO, suggesting that an acidic solution could facilitate drug release. HPG-GO did not show any cytotoxicity on the MCF7 cell line in different concentrations during 72 hours’ incubation. Uptake and entrance of HPG-GO into the cells were verified by determining the intracellular amount of Qu by high-performance liquid chromatography.
Conclusion: A combination of the unique properties of GO and the biodegradable polymer polyglycerol revealed high drug-loading capacity, pH-dependent drug release, and cytocompatibility with HPG-GO, thus introducing it as a promising nanocarrier for anticancer drug delivery.
Keywords: polyglycerol, graphene oxide, hyperbranched polymer, cancer cell
Introduction
There is an urgent demand for development of biocompatible drug carriers to improve the therapeutic profile of hydrophobic anticancer drugs. Drug-delivery systems based on nanomaterials can enhance the efficiency of free hydrophobic drugs by reducing systemic toxicity and increasing drug solubility and cellular uptake. High drug-loading capacity and triggering of drug release near cancer cells are two important issues in introducing a nanocarrier as a proper drug-delivery system. Graphene derivatives have attracted remarkable attention for use in biomedical applications, due to their amazing and unique physical and chemical properties. A graphene sheet is a single layer of sp2-hybridized carbon atoms arranged as a two-dimensional honeycomb lattice1–4 and a novel substrate biomaterial that appeared in 2004.5 The formation of irreversible graphene aggregates in polar solvents by van der Waals interactions and π–π stacking has limited its biomedical applications.6
Graphene oxide (GO), one of the most important derivatives of graphene, possesses hydroxyl and epoxide groups on the basal plane and carboxyl groups at the edges,4,7 which provide better dispersibility in pure water and also offer reactive sites for further surface chemical functionalizations.8,9 Unlike graphene sheets, the polar groups can facilitate the water solubility of GO nanosheets,10 enabling wide application in the biomedical sphere, including biosensing, molecular imaging, gene transfection, and drug delivery.4,11–15 The excellent properties of GO, such as high aspect ratio, large specific surface area, abundant surface chemistry, and good dispersion in aqueous solution, have significantly increased its efficiency for loading aromatic molecules, such as anticancer drugs, and have introduced it as a much more effective drug-delivery system11,16,17 than other carbon nanomaterials.18 These have been the main drivers of GO drug-delivery system development in the last decade. Although GO makes stable suspensions in pure water,19 it has a strong tendency to form irreversible agglomerates into multilayer GO in solutions rich in salts or proteins, such as cell media and sera, through strong π–π stacking and van der Waals interactions1,9,19 that pose a practical challenge for GO biomedical applications.
In recent years, many experiments have been conducted in order to optimize the biocompatibility, solubility, and stability of GO sheets in physiological media via noncovalent or covalent functionalization.11,16,20–22 Such functionalization improves the stability and biocompatibility of GO in the aqueous phase by preventing the formation of van der Waals and π–π interactions. Chemical modifications of carbon-based nanomaterials with polymers seem to be an efficient approach.23 A six-armed PEG-GO complex was used for the first time as a novel nanocarrier by Dai et al8 to load water-insoluble anticancer drugs via hydrophobic and π–π stacking interactions. Such polymers as chitosan,17,24 polyvinyl alcohol,25 and poly-L-lysine21 have been demonstrated to increase the aqueous solubility of graphene and its derivatives. Biocompatible coating for GO could transform it into a promising biomaterial with great potential for controlled anticancer drug delivery. The aliphatic polyether polyol polyglycerol (PG) has been known as a hyperbranched polymer with degrees of branching up to 0.52–0.59.26 Hyperbranched PG (HPG)-based nanostructures have been widely investigated as applicable carriers in biotechnology and pharmacology, because of their biodegradability, high biocompatibility, and excellent solubility in aqueous media.27–32
In this work, an efficient GO-based drug-delivery system was designed for controlled release of quercetin (Qu), a hydrophobic anticancer drug, via the covalent grafting of HPG onto the surface of GO, based on in situ ring-opening polymerization of glycidol and polymer grafting via a one-step strategy. As a hyperbranched polymer, PG is capable of expanding the distance between the GO nanosheets so that drug molecules can be physically entrapped in cavities between branches of this polymer, which is beneficial for achieving a larger drug-loading amount. Interactions between HPG-GO and drug molecules occur based on several types of interaction, such as hydrophobic interactions, hydrogen bonding, and π–π stacking.33 Moreover, the drug-loading capacity and drug-release profile of HPG-GO were compared with GO grafted with linear polypropylene oxide (PPO). It was concluded that the combination of the inherent characteristics of GO and a biodegradable PG can result in a promising drug-delivery system.
Methods
Materials
Qu was obtained from Sigma-Aldrich (St Louis, MO, USA). Graphite powder (77882-42-5; Merck, Darmstadt, Germany) was used for GO preparation. PO 99% was purchased from Tokyo Chemical Industry and glycidol 95% from Kanto Chemical (Tokyo, Japan). Sulfuric acid (H2SO4) 95%, phosphoric acid (H3PO4) 95%, nitric acid (HNO3) 65%, hydrogen peroxide 30%, hydrochloric acid (HCl) 37%, ethanol (≥99.5%), acetone, anhydrous dimethyl sulfoxide (DMSO), 0.1% Triton X-100, and 2-propanol 99.7% were acquired from Wako Pure Chemical Industries (Osaka, Japan). Methanol 99.8% was purchased from Junsei. Potassium permanganate (KMnO4) was purchased from Merck. MCF7 and L929 cells were procured from JCRB Cell Bank (Osaka, Japan). DMEM, FBS, and penicillin–streptomycin 1% were obtained from Thermo Fisher Scientific (Waltham, MA, USA). WST-8 based cell counting kit (CCK8) and dialysis bags (molecular weight 1,000 and 15,000 Da) were acquired from Dojindo (Kumamoto, Japan) and Repligen (Waltham, MA, USA), respectively. All other reagents were analytical grade and used as received.
Preparation of graphene oxide
Graphite flakes were oxidized using two procedures: improved34 and modified Hummers35 method.
Synthesis of GO by modified Hummers method
At the first step, 0.5 g (1 weight equivalent) of graphite flakes was pretreated with a 3:1 volume ratio of concentrated H2SO4:HNO3 at room temperature for 24 hours. Deionized (DI) water (120 mL) was then added to the resultant solution to quench the reaction. The resultant product was washed out with DI water and freeze-dried. At the second step, 0.5 g of the product was mixed with 110 mL H2SO4 and 1.3 g (3 weight equivalents) potassium permanganate (KMnO4) was gradually added during 1 hour in an ice-water bath to maintain the reaction temperature below 20°C. The resultant solution was then stirred for 24 hours at room temperature. After that, 300 mL DI water was added to the mixture to produce a highly exothermic reaction. The temperature of the solution reached 25°C after 30 minutes. The reaction was terminated by adding a 3:1 volume ratio of an aqueous solution of H2O2, resulting in a yellow–brown mixture. The mixture was then centrifuged (10 minutes, 4,000 rpm) and washed out twice with HCl solution (37%) and three times with DI water.
Synthesis of GO by improved Hummers method
A 9:1 mixture of concentrated H2SO4/H3PO4 was added to graphite flakes (1 g, 1 weight equivalent) and KMnO4 (6 g, 6 weight equivalents), producing a slight exothermic reaction (35°C–40°C). The temperature of the reaction was increased to 50°C and the mixture stirred for 12 hours. The reaction was cooled to room temperature and poured onto ice (100 mL) with H2O2 (1 mL). It was then centrifuged (10 minutes, 4,000 rpm) and washed out twice with HCl (37%) solution and three times with DI water. In both procedures, NaHCO3 was used for neutralization. GO was dialyzed with a dialysis bag (14,000 Da cutoff) against DI water for 48 hours to remove impurities. The dialysis product was centrifuged and freeze-dried to produce GO powders. The procedure was followed by sonication to produce nanosheets of GO.
Polymer grafting to graphene oxide
Synthesis of HPG-GO
Different predefined amounts of glycidol (Table 1) and GO powder were mixed and sonicated for 2 hours in an ice-water bath. Subsequently, the mixture was magnetically stirred under a nitrogen atmosphere for 20 hours at 140°C in an oil bath. The resulting black gel-like product was cooled and dissolved in methanol, and the resultant mixture was precipitated in acetone (10 minutes, 4,000 rpm). Finally, HPG-GO was dialyzed in DI water with a dialysis bag (1,000 Da cutoff) for 24 hours to remove the solvent and impurities. After purification, the product was centrifuged and freeze-dried.
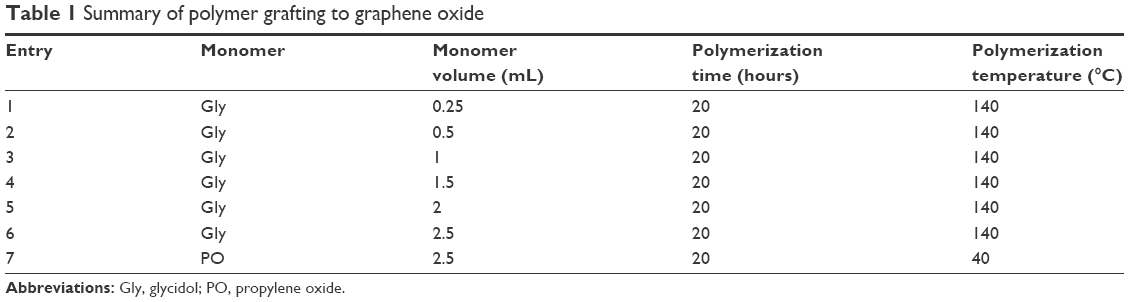 | Table 1 Summary of polymer grafting to graphene oxide |
Synthesis of PPO-GO
Polymerization of PO on the surface of GO was initiated by sonication of GO and PO in an ice-water bath for 2 hours, followed by magnetic stirring for 20 hours at 40°C. The sediment of linear PPO grafting was obtained by a similar approach for HPG-GO.
Spectroscopic and microscopic characterization
Thermogravimetric analysis (TGA) was carried out with an STA 503 analyzer at a heating rate of 10°C/min from ambient temperature to 800°C under an argon atmosphere. Fourier-transform infrared (FTIR) spectra were recorded on an IR Prestige 21 spectrometer (Shimadzu Corporation, Kyoto, Japan) at 400–4,000 cm−1 with a resolution of 1 cm−1 using potassium bromide pellets. Raman spectra were performed on an NRS-5100 (Jasco, Tokyo, Japan) using an excitation laser with a wavelength of 532 nm. X-ray diffraction (XRD) patterns of 2°–65° with a scanning rate of 2°/min were collected with a SmartLab® goniometer (Rigaku Corporation, Tokyo, Japan). XRD patterns of 1°–3° were also generated with the SmartLab (Rigaku Corporation) with CuKa radiation (λ=1.5406 Å). Atomic force microscopy (AFM) images were obtained with an MFP-3D microscope (Oxford Instruments, Abingdon, UK) using NCH probes (NanoWorld, Neuchâtel, Switzerland) in AC mode to measure thickness and particle-size distribution. AFM samples were prepared by spin-coating the aqueous solution of the nanosheets onto a freshly cleaved silicon substrate. The morphology and elemental analysis were obtained using field-emission scanning electron microscopy equipped with an energy-dispersive X-ray (EDX) spectrometer (MIRA3; TESCAN, Brno, Czech Republic). Absorption spectra were measured using ultraviolet (UV)-visible spectrophotometry (V-550; Jasco).
Qu loading in HPG-GO and PPO-GO
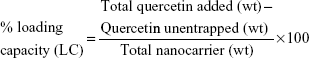
The drug-loading behavior of the HPG-GO nanocarrier was assessed by encapsulation of Qu as a drug model. HPG-GO was dispersed in DI water for 1 hour, producing the homogeneous solution. Various ratios of aqueous solution of nanocarrier and Qu dissolved in ethanol (1:1, 1:2, and 2:1 ratios) were mixed together and vigorously shaken for 12, 18, and 24 hours at 4°C. The product (drug-loaded nanocarrier) was collected by centrifugation. The amount of free Qu was determined by UV visibility at 373 nm. To quantify free Qu, standard curves were prepared by measuring the UV absorbance of a series of Qu solutions with known concentrations in ethanol. The Qu-loading capacity and entrapment efficiency were calculated based on Equations 1 and 2:
|
|
|
|
Moreover, the loading capacity of PPO-GO was compared with HPG-GO according to the same protocol.
Qu release from HPG-GO and PPO-GO nanocarriers
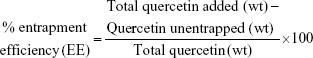
Drug-release profiles of HPG-GO and PPO-GO nanocarriers were investigated at a physiological temperature of 37°C, pH 6.6 (environmental pH of tumors), and pH 7.4 (physiological pH). Briefly, 2 mL drug-loaded nanocarrier aqueous solution was transferred into a dialysis bag (1,000 Da cutoff), which was immersed in 25 mL PBS 0.1 M and incubated at 37°C. All drug-release media were withdrawn after certain intervals. Fresh medium was used for each measurement. The amount of Qu released into the buffer solution was measured using UV-visible spectrophotometry. The cumulative release (%) of the drug-loaded nanocarriers was calculated according to Equation 3:
|
|
Cellular experiments
Cell culture
The human breast cancer MCF7 cell line and normal mouse fibroblast L929 cell line were cultured in DMEM supplemented with 10% FBS and penicillin–streptomycin 1%. Cells were incubated in a humidified atmosphere at 37°C containing 5% CO2.
Cell-toxicity assays
WST8 assays were performed to evaluate the cytotoxicity of free Qu and GO, HPG-GO, and Qu-HPG-GO nanocarriers. Qu was dissolved in DMSO (1%) and diluted in DMEM to evaluate the growth inhibition of MCF7 cells. Cells were seeded in 96-well plates at a density of 104 cells/well. Then, cells were incubated with different concentrations of samples for predetermined periods. Relative cell viability was evaluated by adding CCK8 (10 μL/well) after 2 hours. Cytotoxic activity of compounds was quantitatively determined using a fluorescence microplate reader (PerkinElmer Inc., Waltham, MA, USA) at 450 nm. Data are presented as mean ± SD.
Cellular uptake
Quantitative cell-uptake assay
MCF7 and L929 cells (2.5×10⁵ cells/well) were separately seeded in 24-well plates, followed by incubation at 37°C and 5% CO2 for 24 hours. Subsequently, after 24 hours, the medium was replaced with fresh medium containing free Qu (dissolved in DMSO 1%) and diluted Qu-HPG-GO nanocarriers with a concentration of 50 μg/mL. Uptake studies were carried out in a time-dependent manner. At predetermined time intervals, the culture medium was removed and cells were rinsed twice with cold PBS (pH 7.4). Further, 0.1% Triton X-100 was applied for lysing the cells, and the internalized drug was then solubilized via washing the cells with methanol. The cell extract was centrifuged at 15,000 rpm for 15 minutes and the supernatant subjected to high-performance liquid chromatography (HPLC) analysis for quantification of drugs. Analysis of samples was performed using a Smartline 2600 HPLC system (KNAUER, Berlin, Germany) equipped with a ProntoSil C18 (5 μm–150 mm) column and UV detector (detection wavelength of 373 nm). The mobile phase employed for the analysis was a mixture of methanol and water (0.1% orthophosphoric acid, 35:65 v:v). The flow rate was maintained at 1 mL/min and 20 μL sample injected, with a run time of 30 minutes and column temperature of 25°C. The concentrations of Qu were determined by comparing peak areas with the standard curve.
Results and discussion
Synthesis of GO sheets
To obtain GO, graphite exfoliation typically occurs with powerful oxidizing agents. KMnO4 and NaNO3 in concentrated H2SO4 and a mixture of KMnO4 and concentrated H2SO4 can be considered common oxidizing agents. The specific oxidants, the source of graphite, and conditions of reactions influence the final product greatly.35 We utilized flake graphite as a mineral source of graphite to synthesize GO. The structure of graphene sheets will not be completely maintained by these procedures, and remarkable defects appear in the sheet structure.36 Recently, Marcano et al have demonstrated that treating graphite with H3PO4 keeps the graphitic basal planes more intact.34
For clarity, herein we use the terms “IGO” for the product of an improved method and “MGO” for the product of a modified method. For a modified Hummers method, in addition to KMnO4, HNO3 acts as an oxidizing agent and is introduced to react strongly with aromatic carbon surfaces.37 Oxidization of graphite provides GO with various oxygen-containing species, such as epoxides, alcohols, ketone carbonyls, and carboxyls, in its structural lattice.34
FTIR spectra of graphite oxide did not show any significant absorption peaks (Figure 1). FTIR spectra of GO revealed the existence of characteristic peaks: OH stretching vibrations (3,420 cm−1), C=O stretching vibrations (1,724 cm−1), C=C from unoxidized sp2 C–C bonds (1,616 cm−1), C–O–H in plain bending vibrations (1,382 cm−1), C–O–C stretching vibrations (1,253 cm−1) in the epoxy groups, and C–O stretching vibrations (1,064 cm−1) in the alkoxy group verifying the formation of carboxyl and hydroxyl groups. Oxidation of flake graphite increased water-solubility and available surface functional groups (carboxyl and hydroxyl) for subsequent polymer grafting. With regard to FTIR spectra, MGO sheets consisted of fewer defects in the basal plane in comparison with IGO sheets.
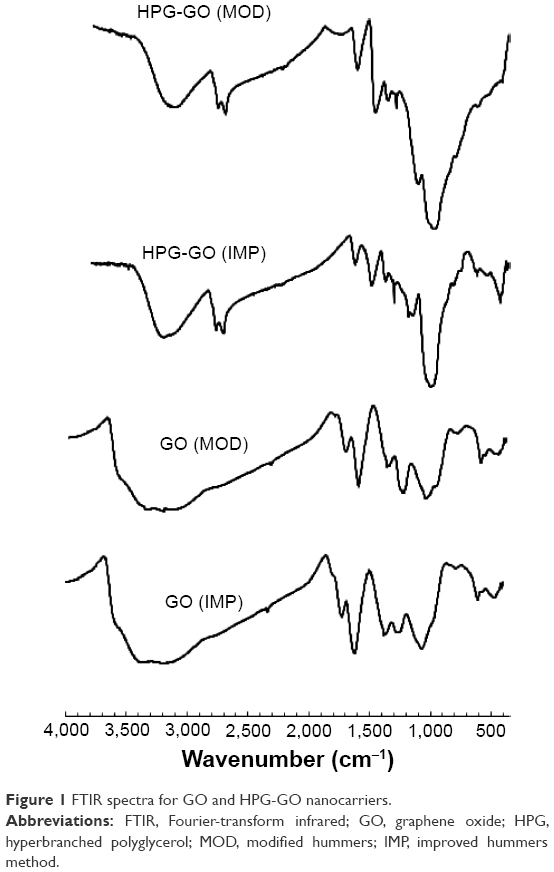 | Figure 1 FTIR spectra for GO and HPG-GO nanocarriers. |
Raman spectra demonstrated extreme similarity in both IGO and MGO sheets. Two prominent characteristic peaks were visible in Raman spectra: D bonds at ~1,350 cm−1 and G bonds at ~1,590 cm−1, confirming lattice distortions (Figure 2A). The G band was attributed to the domains of sp2-hybridized carbons, whereas the D band was ascribed to structural defects. The intensity ratio of the D band to G band (ID:IG) was considered an indication of the extent of disorder in graphene-based materials. The spectra recorded for GO sheets showed that the ID:IG ratios of IGO and MGO were 0.98 and 0.89, respectively. Raman spectra showed more regular structure for MGO sheets than IGO, illustrating a greater amount of basal plane framework retained.
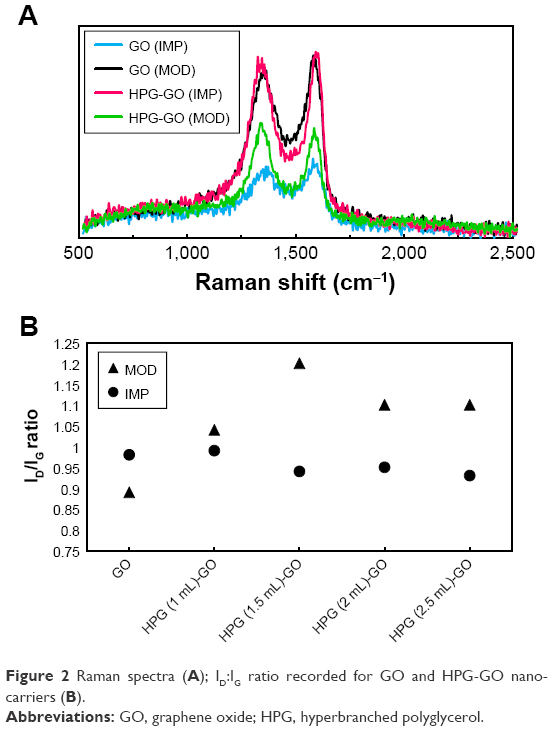 | Figure 2 Raman spectra (A); ID:IG ratio recorded for GO and HPG-GO nanocarriers (B). |
XRD patterns of pristine graphite and GO powder samples are shown in Figure 3. The strong, sharp peak corresponding to the (002) plane of graphite appears at 2θ=26.5° and that of GO exhibits a single sharp diffraction peak (001) at 2θ=10.4°, corresponding to the presence of functional groups containing oxygen, formed by the oxidation process.38 Interlayer spacing of the materials was proportional to the degree of oxidation. The functional groups cause increased d-spacing from 0.33 nm (2θ=26.5°) to 0.85 nm (2θ=10.4°). The same order of overall oxidation can be concluded from the XRD pattern. An increase in interlayer spacing from 0.33 nm for graphite to 0.85 nm for both MGO and IGO sheets was attributed to disruption of the carbon lattice, rather than to the contiguous aromatic lattice of graphene.
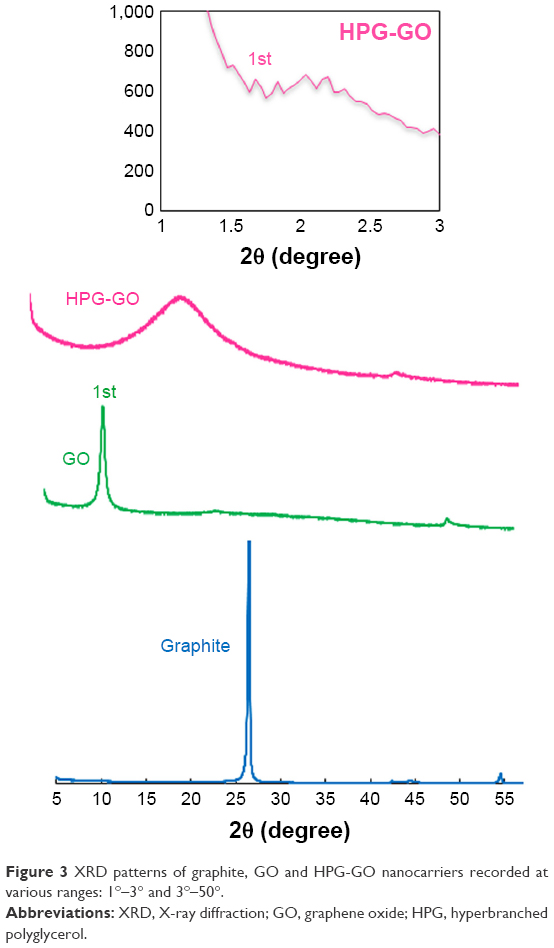 | Figure 3 XRD patterns of graphite, GO and HPG-GO nanocarriers recorded at various ranges: 1°–3° and 3°–50°. |
Polymer grafting to GO sheets
The functional groups provided the possibility of surface modification for GO sheets. The hydroxyl and carboxyl groups on the GO surface initiated the polymerization of epoxy ring-opening branching. As a substrate, GO increased the ordering and level of polymerization. Polymerization of the monomers and grafting of the resultant polymer on the surface of GO sheets occurred simultaneously. Successful polymerization of glycidol and polymer grafting on the surfaces of GO sheets was carried out by various ratios of glycidol to GO powder (Table 1).
Covalent attachment of PG on the surface of both types of GO sheets (M and I) was verified by FTIR spectroscopy (Figure 1). The FTIR spectrum of the HPG-GO nanocarrier differed from that of GO sheets, due to the presence of new picks at ~2,900 and ~1,240 cm−1, which were attributed to the stretching vibrations of the methylene C–H and C–O–C bonds, respectively, in the epoxy group. This supported the grafting of HPG on the surface of GO sheets. ID:IG indicates the extent of disorder in graphene-based materials. Raman spectra showed that the ID:IG ratio for the modified GO materials increased in the order MGO < HPG-IGO ≤ IGO < HPG-MGO. Based on these findings, it is recommended to use MGO than IGO for polymer grafting. Moreover, in the case of HPG-MGO, using 1 mL and 1.5 mL monomers led to increases in ID:IG ratio of 1.04 and 1.20, respectively. However, a further increase in monomer decreased the ID:IG ratio to 1.10 (Figure 2B). The ascending trend of ID:IG was associated with a decline in average size of the sp2 domains and a higher degree of disordered structure, which was due to the polymer-grafting procedure.
The crystallinity of the synthesized modified GO was also investigated using XRD (Figure 3). The appearance of the diffraction peak at 2θ=2° indicated successful HPG grafting on the GO surface. In contrast to GO, the HPG-GO sheets exhibited larger d-spacing than GO, attributed to the polymer grafting on the GO surface (Table 2). In addition, the emergence of a broad reflection peak at ~20° associated with the grafted PG as a polyepoxide confirmed our hypothesis. In accordance with Raman spectra, XRD patterns indicated that MGO sheets were the more suitable substrate for polymer grafting compared with IGO. By increasing the concentration of glycidol, at first both ID:IG ratio and d-spacing increased more than pure GO sheets. However, these factors were decreased when more monomer was added, and finally higher concentrations of monomers resulted in reincreased ID:IG ratio and d-spacing. This phenomenon could have been due to polymerization and branching, which occurred at low concentrations. The branches reverted to the inside with the addition of more monomers. In particular, the terminal groups can fold back into the interior of the molecule by hydrogen binding,39,40 and eventually after saturation of the interior space, the branches will regrow to the outside at higher concentrations of monomers. The thickness and size of GO and HPG-GO sheets were characterized using AFM. As Figure 4A shows, the thickness and diameter of individual GO sheets were <1 nm and ~0.3–0.7 μm, respectively. Considering the typical thickness of monolayer GO flakes (ca 0.71 nm),3,41 most of the synthesized GO sheets were single-layered.
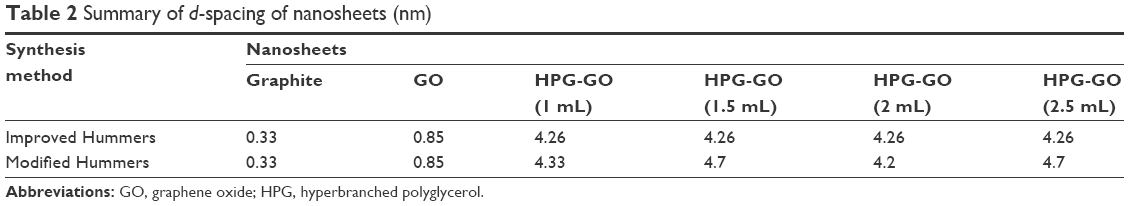 | Table 2 Summary of d-spacing of nanosheets (nm) |
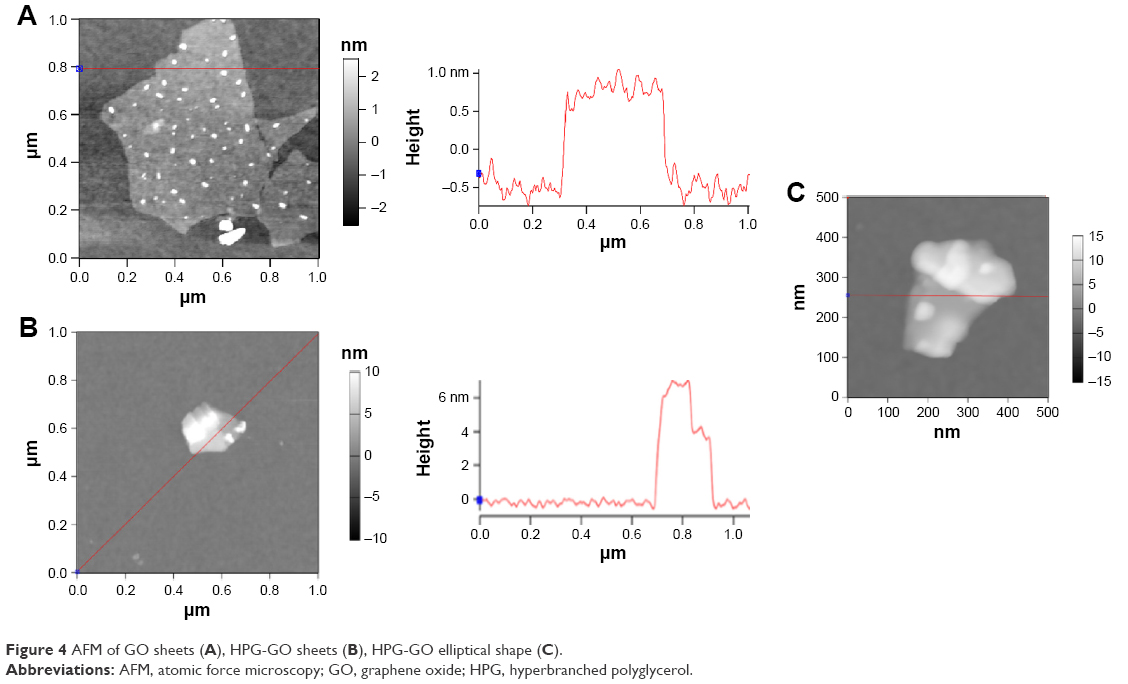 | Figure 4 AFM of GO sheets (A), HPG-GO sheets (B), HPG-GO elliptical shape (C). |
AFM images revealed variations in the thickness of HPG-GO sheets: 3.5 and 7 nm associated with single and double layers, respectively (Figure 4B). Statistical analysis demonstrated an increase in thicknesses for HPG-GO sheets compared to pristine GO, due to polymer grafting. Notably, the lateral size of some sheets was smaller than pristine GO sheets by ~0.26 μm (Figure 4C). Observations of elliptical HPG-GO sheets suggested size reduction resulting from the polymer condensation-reaction process.7
Field-emission scanning electron microscopy provided morphological information on GO sheets and HPG-GO nanocarriers (Figure 5). The GO sheets had flake-like shapes with sharp edges and flat surfaces. In contrast, HPG-GO sheets showed thicker and wrinkled surfaces. This demonstrated the grafting of polymer onto GO-sheet surfaces. The wrinkled surface can provide not only a high surface area for more drug loading but also prevents the aggregation of GO sheets.17 EDX analysis was utilized to characterize the chemical composition of GO and HPG to support the FTIR results. In addition, EDX mapping (element-distribution images) was provided to exhibit a meaningful picture of element distribution on the surface, and verified the presence of carbon and oxygen elements throughout the surface of both GO and HPG-GO sheets (Figure 6). EDX spectra also showed peaks for carbon (C) and oxygen (O) for both GO and HPG-GO sheets. The TGA curve of GO showed the first weight-loss stage below 100°C, due to the removal of physically adsorbed water. The second stage occurring around 180°C–220°C was ascribed to pyrolysis of the oxygen-containing groups on GO sheets,1 and overall GO lost almost 50% of its total weight (Figure 7). In contrast, TGA curves of HPG-GO exhibited the main weight loss around a wider temperature range of 300°C–420°C, attributed to thermal degradation of the grafted PG on the surface of GO sheets.1 The content of grafted polymer was estimated to be ~70 wt%. The increasing amount of monomer resulted in a slight increase in polymer content.
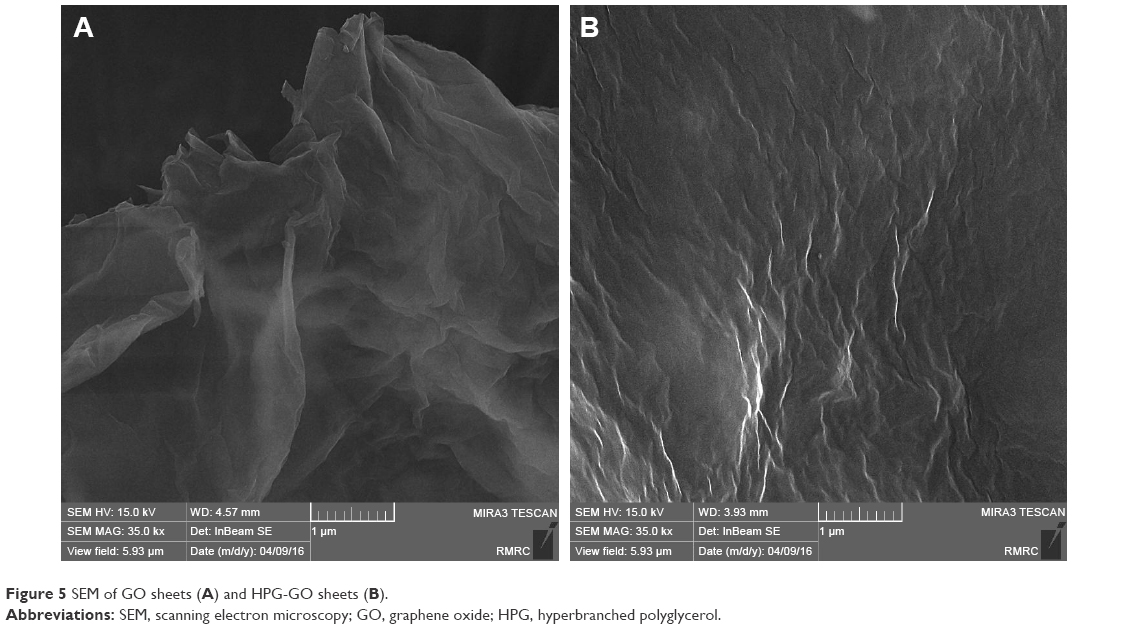 | Figure 5 SEM of GO sheets (A) and HPG-GO sheets (B). |
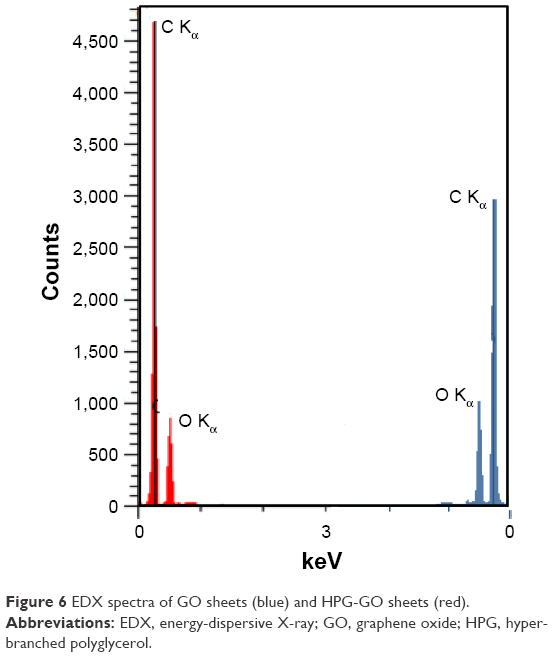 | Figure 6 EDX spectra of GO sheets (blue) and HPG-GO sheets (red). |
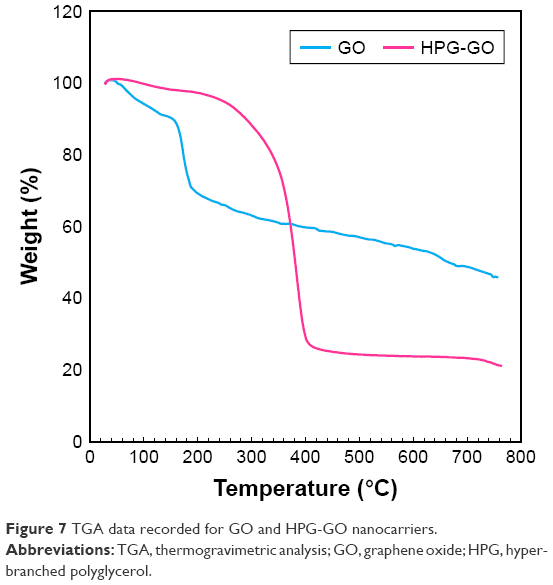 | Figure 7 TGA data recorded for GO and HPG-GO nanocarriers. |
Drug-loading capacity and encapsulation efficiency
Phytochemicals, such as polyphenols and carotenoids, have been receiving great attention, due to their contribution to human health.42–44 A variety of biological activities, such as anticancer, antioxidation, and anti-inflammation have been reported using Qu. As a polyphenol, Qu is the major representative of the flavone subclass, which limits the negative effects of free radicals through the quick transfer of hydrogen atoms to the radicals.44,45 However, low aqueous solubility and instability in physiological media hamper application of this compound, but entrapment of this therapeutic molecule into biodegradable polymeric nanoparticles could be introduced as an approach to improve the efficacy of Qu. Nanosystems can protect chemically labile bioactive compounds in target pathways and blood circulation and also reinforce aqueous solubility, biological half-life, and subsequent bioavailability of hydrophobic drug, resulting in enhancement of therapeutic effects of Qu and improvement in biodistribution.
Drug-loading assays were carried out under different time intervals and various ratios of nanocarrier and drug. Increasing exposure time did not influence drug-loading capacity, though our data indicated a significant effect of nanocarrier and drug ratios on this capacity. The concentration of Qu present in different samples was obtained by standard regression, based on equation 4:
|
|

Average drug-loading and entrapment efficiency of HPG-GO achieved with the optimized formulation are summarized in Tables 3 and 4, respectively. Our observations revealed the highest encapsulation efficiency for Qu-loaded HPG-GO (93%) and the highest drug-loading capacity (185.4%). Encapsulation efficiency and drug-loading capacity for Qu were increased from 40% to 93% and 80% to 185.4%, respectively, by increasing the amount of monomer. This can be attributed to the saturation of hyperbranched polymer structure. Moreover, we compared the drug-loading capacity of HPG-GO with linear polymer-grafted GO (PPO-GO). The drug-loading capacity of the hyperbranched polymer was approximately five times that of the linear polymer.
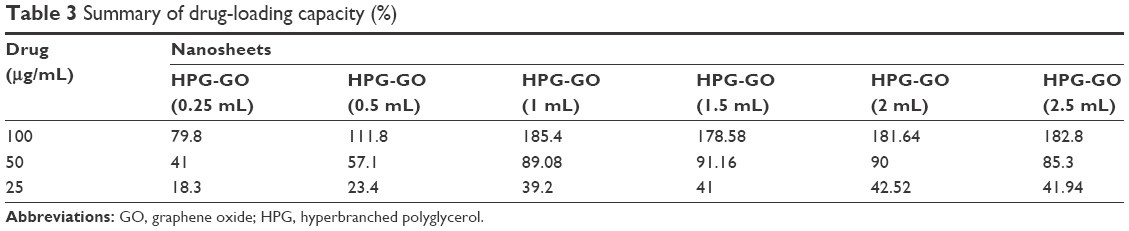 | Table 3 Summary of drug-loading capacity (%) |
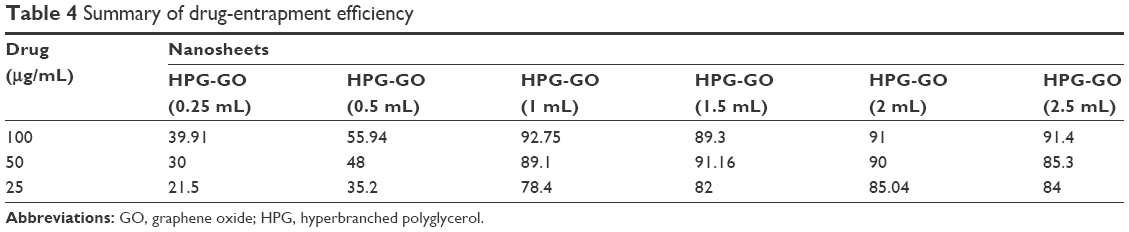 | Table 4 Summary of drug-entrapment efficiency |
In vitro release assays
The release behavior of polymer-GO nanocarriers was recorded under different pH values (Figure 8). In the first 12 hours, 20.6% and 27% of Qu was released from HPG-GO nanocarriers in PBS at natural and acidic pH, respectively. After 72 hours, total released drug had risen to 36.5% and 49.2% at natural and acidic pH, respectively. The different release rates at 72 hours can be associated with the different locations of drug in nanocarriers.
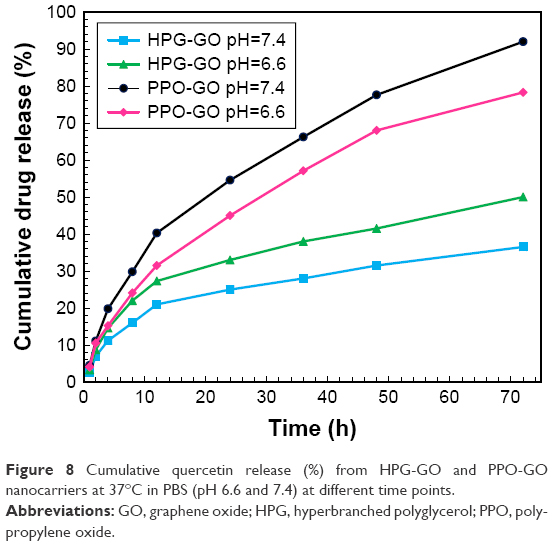 | Figure 8 Cumulative quercetin release (%) from HPG-GO and PPO-GO nanocarriers at 37°C in PBS (pH 6.6 and 7.4) at different time points. |
In vitro release assays indicated a higher release ratio for HPG-GO nanocarriers under acidic pH than natural pH. The drug-release behavior of PPO-GO nanocarriers was also studied in the same conditions. Qu was released quickly in the initial stage: 40.2% of loaded drug had been released after 12 hours’ incubation at pH 7.4, and the maximum release ratio reached 92% at 72 hours. However, 31.6% of the drug was released at pH 6.6 for the same incubation time and had increased to 80% after 72 hours. The release profiles of the drug from HPG-GO and GO-PPO nanocarriers were significantly different at the same physiological conditions.
HPG-GO nanocarriers showed a sustained and slow release, avoiding the initial burst release of Qu compared to PPO-GO nanocarriers. The controlled and sustained release from HPG-GO nanocarriers could have been due to drug entrapment in cavities, hydrophobic attractions between hydrophobic segments of polymers, hydrophobic bioactive compounds,46 and hydrogen bonding between polymers and drug, which may have reduced the diffusion of Qu. On the other hand, hydrogen bonding and hydrophobic interaction between the hyperbranched polymer and drug were stronger than the linear polymer and drug, and drug, since there are lots of hydroxyl groups and hydrophobic cavities inside the structure of the hyperbranched polymer. Moreover, it was revealed that these graphene derivatives exhibited pH-dependent drug-release profiles. Based on the drug-release pattern from HPG-GO nanocarriers, it is suggested that an acidic solution can facilitate drug release. The Qu-release rate from HPG-GO nanocarriers at pH 6.6 was faster than at pH 7.4. This can be ascribed to the hydrogen bonding between drug and HPG, which was more prominent in neutral conditions, resulting in a sustained-release pattern. The three-dimensional structure of hyperbranches can be influenced significantly by the polarity of the solvent.39 The interaction between water and polymer takes preference over the weak interaction between polymer and Qu.47 The higher release rate at neutral pH compared to the acidic solution and rapid-burst effect is not proper for anticancer drug delivery and cancer therapy, as the drug would immediately be removed from blood circulation (pH 7.4) by reticuloendothelial system macrophages before reaching cancer tissue. Due to the acidic tumor environment, pH-dependent drug release from HPG-GO nanocarriers could be exploited for controlled drug-delivery applications, subsequently reducing premature drug release and its related side effects. HPG seems to play two key roles in HPG-GO nanocarriers: stabilizing GO sheets in electrolyte solutions and preventing fast drug release in neutral media. It could be a good candidate for smart drug release.
In vitro cytotoxicity
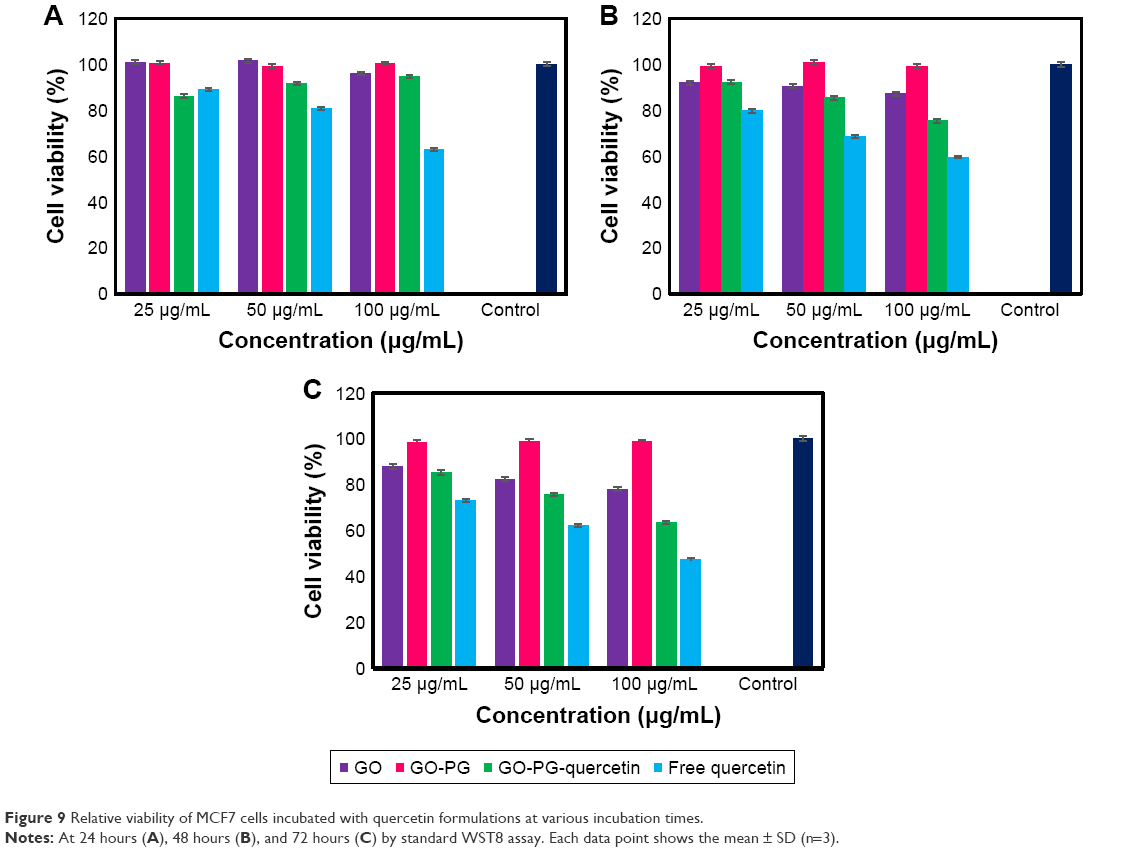
The cytocompatibility of a nanocarrier is a prerequisite for applying drug-delivery systems. The concentration- and time-dependent cytotoxicities of free drug, GO, HPG-GO, and Qu-HPG-GO nanocarriers were evaluated on MCF7 cells using WST8 assays. As shown in Figure 9, HPG-GO sheets did not affect cell viability at any incubation time or studied concentration, whereas GO, Qu-HPG-GO, and free Qu induced concentration- and time-dependent toxicities for MCF7 cells. GO had not exhibited any significant change in cell viability after 24 hours’ treatment for 25 and 50 μg/mL concentrations, while 100 μg/mL decreased cell viability by 96%. Notably, the viability of cells had decreased after 48 hours and 72 hours for all studied concentrations. These results indicate that the cytotoxicity of GO is directly related to time and concentration. Loading Qu in HPG-GO nanocarriers led to a reduction in cell viability according to the release rate of the drug over time and increased concentration of Qu into HPG-GO nanocarriers. According to diagrams, free Qu displayed appreciable toxic effects on cells. The IC50 values of the free Qu with optimal concentration (100 μm/mL) after 72, 48, and 24 hours were 95, 123/76 and 135/13, respectively.
 | Figure 9 Relative viability of MCF7 cells incubated with quercetin formulations at various incubation times. |
In comparison with free Qu, the IC50 values of the Qu-HPG-GO nanocarrier were calculated at 137, 203/25, and 943/39, respectively. The lower cell-killing ability of Qu-HPG-GO nanocarriers compared to free Qu could be attributed to delayed Qu release, as only 32.92%, 41.72%, and 49.22% of the drug had been released after 24, 48, and 72 hours, respectively, and only 50% of the drug had been released after 3 days. The charts revealed a significant reduction in viability of MCF7 cells with increased concentrations of free drug or drug-loaded nanocarriers. HPG-GO nanocarriers enhanced the solubility of Qu in the cell-culture medium compared to free Qu.
Quantitative cellular uptake
Cellular uptake and intracellular amount of free Qu and Qu loaded in HPG-GO nanocarriers for normal and cancer cells were investigated by HPLC. Figure 10 depicts the quantitative cellular uptake for MCF7 and L929 cells. After 12 hours’ incubation, the Qu uptake from drug-loaded HPG-GO and free Qu was almost similar for both cell lines (~27%), while after 24 hours’ incubation, a negligible change was revealed in the level of Qu by being exposed cells to Qu-HPG-GO compared to free Qu. This phenomenon could be attributable to two factors. First, in accordance with toxicity results, only 33% and 25% drug had been released after 24 hours under acidic and neutral conditions, respectively. Therefore, only a third of the drug had been released after 24 hours. Second, the distinct pathways of cellular uptake can influence the rate of drug release. It is well known that endocytosis is a pathway for the internalization of nanocarriers into cells, whereas free Qu molecules are transported into cells via passive diffusion.48–50 This is noteworthy: Qu is very hydrophobic and not dissolvable in water or cell-culture medium. Therefore, DMSO (1%) was used as an adjuvant to improve Qu solubility. In our body, free Qu had very low solubility and exhibited insignificant bioavailability.
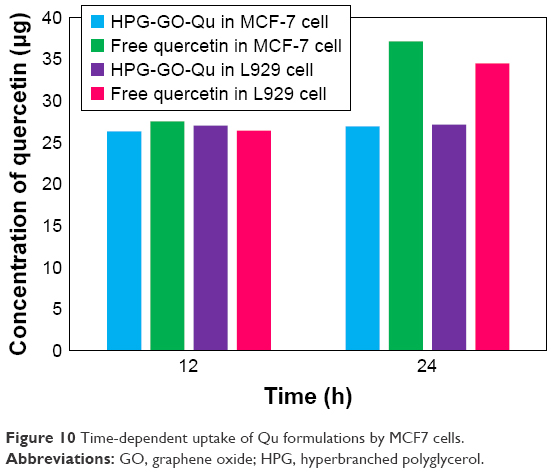 | Figure 10 Time-dependent uptake of Qu formulations by MCF7 cells. |
Conclusion
In summary, we synthesized GO using modified and improved Hummers methods. HPG-GO nanocarriers were developed by grafting biocompatible HPG onto the surface of GO based on in situ ring-opening polymerization of glycidol via a one-step procedure. More desirable polymer grafting was achieved by MGO in comparison with IGO. Increased d-spacing was observed for HPG-MGO only when the amount of applied monomer for polymerization was increased. This effect can provide more interlayer space for increasing drug-loading capacity. The thicker and wrinkled surface after polymer grafting introduces HPG-MGO sheets as suitable nanocarriers for delivering the hydrophobic aromatic anticancer drug Qu. Moreover, drug release from HPG-GO nanocarriers was found to be more sustained and controlled than PPO-GO (as a linear nanocarrier). Excellent cytocompatibility of HPG-GO nanocarriers was verified using WST8 assays, illustrating that Qu-HPG-GO induced inhibition for MCF7 cells in a concentration- and time-dependent manner. Our in vitro quantitative cellular studies of the Qu-HPG-GO nanocarriers revealed that surface functionalization played a significant role in improvement in biocompatibility and sufficient uptake of graphene-based nanomaterials. This study points to HPG-GO nanocarriers being a promising and potent drug-delivery system for cancer therapy.
Disclosure
We wish to confirm that there are no known conflicts of interest associated with this publication, nor has there been any significant financial support for this work that could have influenced its outcome.
References
Pham TA, Kumar NA, Jeong YT. Covalent functionalization of graphene oxide with polyglycerol and their use as templates for anchoring magnetic nanoparticles. Synth Met. 2010;160(17–18):2028–2036. | ||
Balandin AA, Ghosh S, Bao W, et al. Superior thermal conductivity of single-layer graphene. Nano Lett. 2008;8(3):902–907. | ||
Gómez-Navarro C, Weitz RT, Bittner AM, et al. Electronic transport properties of individual chemically reduced graphene oxide sheets. Nano Lett. 2007;7(11):3499–3503. | ||
Zhao H, Ding R, Zhao X, et al. Graphene-based nanomaterials for drug and/or gene delivery, bioimaging, and tissue engineering. Drug Discov Today. 2017;22(9):1302–1317. | ||
Novoselov KS, Geim AK, Morozov SV, et al. Electric field effect in atomically thin carbon films. Science. 2004;306(5696):666–669. | ||
Lq X, Yee YK, Neoh KG, et al. Cyclodextrin-functionalized graphene nanosheets, and their host-guest polymer nanohybrids. Polymer. 2013;54(9):2264–2271. | ||
Fang M, Wang K, Lu H, Yang Y, Nutt S. Covalent polymer functionalization of graphene nanosheets and mechanical properties of composites. J Mater Chem. 2009;19(38):7098–7105. | ||
Liu Z, Robinson JT, Sun X, Dai H. PEGylated nanographene oxide for delivery of water-insoluble cancer drugs. J Am Chem Soc. 2008;130(33):10876–10877. | ||
Xu Z, Zhu S, Wang M, Li Y, Shi P, Huang X. Delivery of paclitaxel using PEGylated graphene oxide as a nanocarrier. ACS Appl Mater Interfaces. 2015;7(2):1355–1363. | ||
Paredes JI, Villar-Rodil S, Martínez-Alonso A, Tascón JM. Graphene oxide dispersions in organic solvents. Langmuir. 2008;24(19):10560–10564. | ||
Huang T, Zhang L, Chen H, Gao C. A cross-linking graphene oxide–polyethyleneimine hybrid film containing ciprofloxacin: one-step preparation, controlled drug release and antibacterial performance. J Mater Chem B. 2015;3(8):1605–1611. | ||
Yang K, Zhang S, Zhang G, et al. Graphene in mice: ultrahigh in vivo tumor uptake and efficient photothermal therapy. Nano Lett. 2010;10(9):3318–3323. | ||
Chen ML, He YJ, Chen XW, Wang JH. Quantum-dot-conjugated graphene as a probe for simultaneous cancer-targeted fluorescent imaging, tracking, and monitoring drug delivery. Bioconjug Chem. 2013;24(3):387–397. | ||
Shi J, Zhang H, Snyder A, et al. An aqueous media based approach for the preparation of a biosensor platform composed of graphene oxide and Pt-black. Biosens Bioelectron. 2012;38(1):314–320. | ||
Enayati M, Nemati A, Zarrabi A, Shokrgozar MA. Reduced graphene oxide: An alternative for Magnetic Resonance Imaging contrast agent. Ma. Lett. 2018;233:363–366. | ||
Zhang S, Yang K, Feng L, Liu Z. In vitro and in vivo behaviors of dextran functionalized graphene. Carbon N Y. 2011;49(12):4040–4049. | ||
Bustos-Ramírez K, Martínez-Hernández AL, Martínez-Barrera G, Icaza M, Castaño VM, Velasco-Santos C. Covalently bonded chitosan on graphene oxide via redox reaction. Materials. 2013;6(3):911–926. | ||
Yang Y, Zhang YM, Chen Y, Zhao D, Chen JT, Liu Y. Construction of a graphene oxide based noncovalent multiple nanosupramolecular assembly as a scaffold for drug delivery. Chemistry. 2012;18(14):4208–4215. | ||
Sun X, Liu Z, Welsher K, et al. Nano-graphene oxide for cellular imaging and drug delivery. Nano Res. 2008;1(3):203–212. | ||
Shen H, Liu M, He H, et al. PEGylated graphene oxide-mediated protein delivery for cell function regulation. ACS Appl Mater Interfaces. 2012;4(11):6317–6323. | ||
Shan C, Yang H, Han D, et al. Water-soluble graphene covalently functionalized by biocompatible poly-L-lysine. Langmuir. 2009;25(20):12030–12033. | ||
Wu C, He Q, Zhu A, et al. Synergistic anticancer activity of photo- and chemoresponsive nanoformulation based on polylysine-functionalized graphene. ACS Appl Mater Interfaces. 2014;6(23):21615–21623. | ||
Zhang H, Grüner G, Zhao Y. Recent advancements of graphene in biomedicine. J Mater Chem B. 2013;1(20):2542–2567. | ||
Bao H, Pan Y, Ping Y, et al. Chitosan-functionalized graphene oxide as a nanocarrier for drug and gene delivery. Small. 2011;7(11):1569–1578. | ||
Veca LM, Lu F, Meziani MJ, et al. Polymer functionalization and solubilization of carbon nanosheets. Chem Commun. 2009;18(18):2565–2567. | ||
Haag R, Sunder A, Stumbé J-F. An approach to glycerol dendrimers and pseudo-dendritic polyglycerols. J Am Chem Soc. 2000;122(12):2954–2955. | ||
Zarrabi A, Shokrgozar MA, Vossoughi M, Farokhi M. In vitro biocompatibility evaluations of hyperbranched polyglycerol hybrid nanostructure as a candidate for nanomedicine applications. J Mater Sci Mater Med. 2014;25(2):499–506. | ||
Assadi Z, Emtiazi G, Zarrabi A. Hyperbranched polyglycerol coated on copper oxide nanoparticles as a novel core-shell nano-carrier hydrophilic drug delivery model. J Mol Liq. 2018;250:375–380. | ||
Jahandar M, Zarrabi A, Shokrgozar MA, et al. Synthesis, characterization and application of polyglycerol coated Fe3O4 nanoparticles as a nano-theranostics agent. Mater Res Express. 2015;2(12):125002. | ||
Mostaghasi E, Zarepour A, Zarrabi A. Folic acid armed Fe3O4 -HPG nanoparticles as a safe nano vehicle for biomedical theranostics. J Taiwan Inst Chem Eng. 2018;82:33–41. | ||
Zarrabi A, Vossoughi M. Paclitaxel/β-CD-g-PG inclusion complex: An insight into complexation thermodynamics and guest solubility. J Mol Liq. 2015;208:145–150. | ||
Sunder A, Mülhaupt R, Haag R, et al. Hyperbranched polyether polyols: a modular approach to complex polymer architectures. Adv Mater. 2000;12(3):235–239. | ||
Jansen JF, de Brabander-van den Berg EM, Meijer EW. Encapsulation of guest molecules into a dendritic box. Science. 1994;266(5188):1226–1229. | ||
Marcano DC, Kosynkin DV, Berlin JM, et al. Improved synthesis of graphene oxide. ACS Nano. 2010;4(8):4806–4814. | ||
Hummers WS, Offeman RE. Preparation of Graphitic Oxide. J Am Chem Soc. 1958;80(6):1339. | ||
Gómez-Navarro C, Meyer JC, Sundaram RS, et al. Atomic structure of reduced graphene oxide. Nano Lett. 2010;10(4):1144–1148. | ||
Zhang N, Wang L-Yan, Liu H, et al. Nitric acid oxidation on carbon dispersion and suspension stability. Surface and Interface Analysis. 2008;40(8):1190–1194. | ||
Ryu HJ, Mahapatra SS, Yadav SK, et al. Synthesis of click-coupled graphene sheet with chitosan: effective exfoliation and enhanced properties of their nanocomposites. Eur Polym J. 2013;49(9):2627–2634. | ||
Boas U, Heegaard PM. Dendrimers in drug research. Chem Soc Rev. 2004;33(1):43–63. | ||
Rosenfeldt S, Dingenouts N, Pötschke D, et al. Analysis of the spatial dimensions of fully aromatic dendrimers. Angew Chem Int Ed Engl. 2004;43(1):109–112. | ||
Gao X, Jang J, Nagase S. Hydrazine and thermal reduction of graphene oxide: reaction mechanisms, product structures, and reaction design. The Journal of Physical Chemistry C. 2010;114(2):832–842. | ||
Butnariu M, Sarac I, Pentea M, et al. Approach for Analyse Stability of Lutein from Tropaeolum majus. Rev chim. 2016;67(3):503–506. | ||
Petrache P, Rodinob S, Butub M. Polyacetylene and carotenes from petroselinum sativum root. Dig J Nanomater Biostruct. 2014;9(4):1523–1527. | ||
Ravishankar D, Rajora AK, Greco F, Osborn HM. Flavonoids as prospective compounds for anti-cancer therapy. Int J Biochem Cell Biol. 2013;45(12):2821–2831. | ||
Alrawaiq NS, Abdullah A. A Review of Flavonoid Quercetin: Metabolism, Bioactivity and Antioxidant Properties. International Journal of Pharm Tech Research. 2014;6(3):933–941. | ||
Hk H, Kim JW, Lee MR, et al. Formation and characterization of quercetin-loaded chitosan oligosaccharide/β-lactoglobulin nanoparticle. Food Res Int. 2013;52(1):82–90. | ||
Otto DP, Otto A, de Villiers MM. Experimental and mesoscale computational dynamics studies of the relationship between solubility and release of quercetin from PEG solid dispersions. Int J Pharm. 2013;456(2):282–292. | ||
Kratz F, Beyer U, Roth T, et al. Transferrin conjugates of doxorubicin: synthesis, characterization, cellular uptake, and in vitro efficacy. J Pharm Sci. 1998;87(3):338–346. | ||
Cao Y, Gu Y, Ma H, et al. Self-assembled nanoparticle drug delivery systems from galactosylated polysaccharide-doxorubicin conjugate loaded doxorubicin. Int J Biol Macromol. 2010;46(2):245–249. | ||
Zhang X, Achazi K, Steinhilber D, Kratz F, Dernedde J, Haag R. A facile approach for dual-responsive prodrug nanogels based on dendritic polyglycerols with minimal leaching. J Control Release. 2014;174:209–216. |
 © 2018 The Author(s). This work is published and licensed by Dove Medical Press Limited. The
full terms of this license are available at https://www.dovepress.com/terms
and incorporate the Creative Commons Attribution
- Non Commercial (unported, 3.0) License.
By accessing the work you hereby accept the Terms. Non-commercial uses of the work are permitted
without any further permission from Dove Medical Press Limited, provided the work is properly
attributed. For permission for commercial use of this work, please see paragraphs 4.2 and 5 of our Terms.
© 2018 The Author(s). This work is published and licensed by Dove Medical Press Limited. The
full terms of this license are available at https://www.dovepress.com/terms
and incorporate the Creative Commons Attribution
- Non Commercial (unported, 3.0) License.
By accessing the work you hereby accept the Terms. Non-commercial uses of the work are permitted
without any further permission from Dove Medical Press Limited, provided the work is properly
attributed. For permission for commercial use of this work, please see paragraphs 4.2 and 5 of our Terms.