Back to Journals » Clinical Optometry » Volume 12
Contrast-Sensitivity Function and Photo Stress–Recovery Time in Prediabetes
Authors Chande PK ![]() , Raman R, John P, Srinivasan S
, Raman R, John P, Srinivasan S
Received 28 April 2020
Accepted for publication 31 July 2020
Published 18 September 2020 Volume 2020:12 Pages 151—155
DOI https://doi.org/10.2147/OPTO.S259397
Checked for plagiarism Yes
Review by Single anonymous peer review
Peer reviewer comments 2
Editor who approved publication: Mr Simon Berry
Prema K Chande,1 Rajiv Raman,2 Preethi John,3 Sangeetha Srinivasan4
1Chitkara School of Health Sciences and Lotus College of Optometry, Mumbai, India; 2Sankara Nethralaya, Medical Research Foundation, Chennai, India; 3Chitkara School of Health Sciences, Chitkara University, Rajpura, Punjab, India; 4Vision Research Foundation, Chennai, India
Correspondence: Prema K Chande
Lotus College of Optometry, 13th North South Road, Vithal Nagar, Juhu, Mumbai, Maharashtra 400049, India
, Tel +91-98-2016-4222
Email [email protected]
Purpose: The purpose of this study was to assess contrast sensitivity and macular function test in prediabetes.
Methods: Participants aged 25– 45 years with or without diabetes were enrolled and classified as normal, prediabetic, and diabetic based on their HbA1C values. They underwent a comprehensive eye examination, and those with diabetic retinopathy, cataract, glaucoma, and high myopia were excluded. Participants with best-corrected visual acuity of 0 logMAR were included. Contrast-sensitivity function (CSF) was measured using a Pelli–Robson chart, and photo stress–recovery time (PSRT) assessed using direct ophthalmoscopy for the 70 eligible participants. Mean values were compared among the three groups.
Design: This was a cross-sectional observational study.
Results: In the 70 participants, mean CSF was 1.71± 0.10, 1.64± 0.11, and 1.61± 0.08 log units in the normal, prediabetic, and diabetic groups, respectively (p< 0.001). Similarly, PSRT was found to be 35.80 seconds, 41.63 seconds, and 47.77 seconds in the normal, prediabetic, and diabetic groups, respectively (p< 0.001).
Conclusion: The data suggested that reduced CSF and delayed PSRT seen in subjects with prediabetes could give valuable clinical insight into early changes before diabetes and microvascular damage is incurred. A future study with a larger sample could help substantiate the results.
Keywords: contrast-sensitivity function, prediabetes, diabetes, HbA1C, photo stress–recovery test
Background
The International Diabetes Federation estimated in their 2019 atlas that India had 77 million adults aged 20–79 years with diabetes and that this number was estimated to grow to 134.2 million by 2045. Age-adjusted prevalence is estimated to be 8.8%.1,2 People with diabetes are known to develop systemic and ocular complications, and the onset of these complications is associated with prolonged disease.3,5 The prevalence of diabetes and prediabetes in India reported by the Indian Council of Medical Research INDIAB group in 2017 was 7.3% and 10.3%, respectively.6
The Chennai Urban Rural Epidemiological Study showed that among those with prediabetes at baseline, 58.9% converted to diabetes over a mean follow-up of 9.1 years, whereas among the normal individuals, 19.4% converted to diabetes during a follow-up of 10 years.7 Ganglion cell–layer changes and inner retinal neurons have been reported in studies in subjects with no clinical signs of retinopathy. Reduced contrast-sensitivity function (CSF) has also been reported in patients with no diabetic retinopathy.8,9 The purpose of this study was to assess macular functional measures in subjects with prediabetes. The study outcomes may help to further understanding of screening methods in early detection of diabetes in the prediabetic stage and in timely referral.10
Methods
This was a cross-sectional observational study to record and analyze macular functional assessment, namely CSF and photo stress–recovery time (PSRT) in those who had no diabetes, prediabetes, and diabetes. Subjects with or without known diabetes aged 25–45 years were enrolled. Anjana et al7 included adults with a cutoff of 25 years of age, and found that the mean age of becoming diabetic was 40 years; therefore, the age-group 25–45 years was chosen in this study. Patients, attendees, and volunteers at the outpatient department of a tertiary eye-care hospital aged 25–45 years were randomly invited to participate. Sample size was calculated based on the prevalence of diabetic retinopathy among prediabetics or the impaired fasting-glucose group reported as 7.9% (by the Diabetes Prevention Program group in 2007).11 The study obtained ethical approval from the Institutional Review Board of Lotus College of Optometry and was in accordance with the Declaration of Helsinki. After providing written informed consent, participants underwent HbA1c testing using the Bayer A1CNow point-of-care device test (Bayer HealthCare, Sunnyvale, CA, USA).12
Individuals were classified as normal or prediabetic based on their HbA1C values. The definition to diagnose them was based on the guidelines provided by the American Diabetic Association of A1C values of 5.7%–6.4%. Those with known diabetes were classified as such by either self-report or HbA1C >6.5%. Following this, body-fat mass and body-mass index were assessed. Participants then underwent a comprehensive eye examination that included history, visual acuity assessment, refraction, slit-lamp examination, tonometry using pneumotonometry, and posterior-segment evaluation with 90 D lenses. Slit-lamp examinations and 90 D tests were done by an ophthalmologist.
Those with diabetic retinopathy, cataracts that decreased visual acuity or equal to or worse than grade 1, glaucoma, myopia >6 DS and visual acuity poorer than 0.1 LogMAR (Snellen equivalent 20/25 or 6/7.5), and other ocular diseases were excluded from the study.11,13 Participants underwent CSF assessment using a Pelli–Robson chart.14 Tests were performed in the low-vision clinic with standard room illumination with the recommended 1 m test distance for all subjects. Scores were recorded for all three optotypes identified by the participant with least contrast.
For measuring PSRT, the macular spot of a direct ophthalmoscope (professional model, Keeler, UK; adjusted to full intensity) was projected directly onto the macula for 30 seconds from a distance of 5 cm nasally, while the other eye was covered. After 30 seconds, the participant was instructed to read the Pelli–Robson chart. The time taken by the participant to reach baseline CS levels was noted. The procedure was repeated for the other eye. Data were then analyzed for both eyes and compared among the three groups.15,16
Statistical Analysis
Statistical analysis was done using the Statistical Package for Social Sciences (IBM SPSS Statistics for Windows, Verion 25.0, Armonk, NY, USA) SPSS to estimate means and SD. Continuous data were assessed for normality of distribution. Since these were not normally distributed, Kruskal–Wallis tests followed by Mann–Whitney U tests were performed to compare significant differences among groups. Proportions were compared with a χ2 test of independence. Spearman correlations were assessed between age and HbA1c values with the CS and PSRT values.
Results
Of the 118 subjects enrolled in the study, 43 (36%) had been diagnosed with diabetes. Of the 75 individuals who were not known diabetics, 41 (55%) were identified as having prediabetes and 34 (29%) had no diabetes (normal). Data for CSF and PSRT were analysed for 70 participants. In sum, 48 of 118 participants were excluded based on visual, myopia more than 6 DS or did not want to proceed with further tests due to lack of time.17
Demographic and clinical characteristics of the study groups are shown in Table 1. The mean age of the study group was 36.89±6.30 years, and 46% were men. Mean HbA1C values in the normal, prediabetes, and diabetes groups were 5.3%±0.2%, 5.9%±0.2%, and 8.3%±2.6%, respectively, and were significantly different among the groups (p<0.001). Mean body mass index (BMI) was 24.32±3.19, 24.51±4.77, and 25.69±3.57, (p<0.001), and body-fat mass 29.57±6.27, 31.42±7.89, and 28.90±5.51 (p<0.001) in normal, prediabetes, and diabetes groups, respectively. Based on inclusion criteria, data for CSF and PSRT were analyzed for 70 subjects. Mean CSF values for the normal, prediabetes and diabetes groups were 1.71±0.10, 1.64±0.11 and 1.61±0.08 log units, respectively. Mean PSRT for the normal, prediabetic, and diabetic groups was 35.8 seconds, 41.63 seconds, and 47.77 seconds, respectively.
 |
Table 1 Clinical characteristics of the participants in normal, prediabetic, and diabetic groups |
Table 2 shows the CSF and PSRT in the three groups. The difference in CSF among the three groups was significant (p<0.001). CSF differed between the groups with prediabetes and diabetes compared with the normal group. PSRT showed a statistically significant difference among the three groups (p<0.001) and differed between any two-group comparison.The correlation between age and CSF in the prediabetes group was rs=−0.258(p=0.245), normal group rs=−0.412(p=0.056), diabetes group rs=0.040 (p=0.848). Correlations between HbA1c and CSF were rs=-0.070(p=0.713) in the prediabetes group, rs=−0.026 (p=0.909) in the normal group, and rs=−0.204(p=0.362) in the diabetic group. The correlation between age and PSRT in the normal group was rs=0.152 (p=0.523), in the prediabetes group rs=0.416 (p=0.68 and in the diabetes group rs=−0.126 (p=0.682). Similarly, correlations between HbA1c and PSRT were rs=0.24 (p=0.922), rs=0.197 (p=0.406), and rs=0.421 (p= 0.152) in the normal, prediabetes, and diabetes groups, respectively. Neither age nor HbA1c showed any significant correlations with CSF or PSRT.
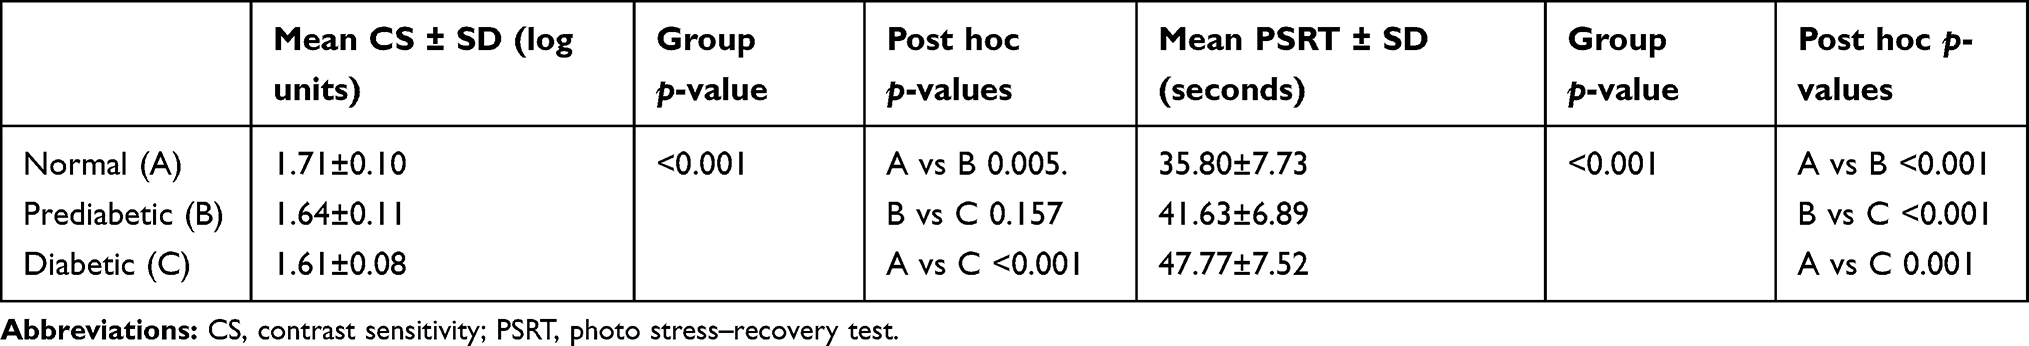 |
Table 2 Contrast-sensitivity and photo stress–recovery test in normal, prediabetic, and diabetic groups |
Discussion
Loss of visual function in individuals with diabetes with and without retinopathy has been extensively reported in the literature.18,20 The present study results showed that those with prediabetes had loss of CSF in comparison to participants with no diabetes. The normative datum as per the Pelli–Robson chart for CSF for the age-group <50 years is 1.80 log units.17 In the present study, CSF was 1.64 log units in the prediabetes group and 1.61 log units in those with known diabetes, both being much lower than the nondiabetic groups and also below the age-related normative data reported by Elliot et al.17
Safi et al18 assessed CSF with spatial gratings in moderate and dim light in patients with diabetes in the absence of diabetic retinopathy. They concluded that those with diabetes without clinical signs of retinopathy exhibit a uniform loss in CSF across all spatial frequencies. The present study is in agreement with this, as those with diabetes had CS of 1.61 log units, with a mean age of 43 years. Joltikov et al19 and Neriyanuri et al20 reported that visual functional measures like CS and retinal sensitivity are affected in those with diabetes with no retinopathy. The results of the present study concur with this for the group with diabetes, and the data further showed that when comparing intergroup values, the difference was statistically significant. Parvocellular pathways have been reported to be responsible for higher spatial frequencies, and Gualtieri et al reported reduced CS in cases with no diabetic retinopathy with inferred magno- and parvocellular pathways.21,23 The present study data showed reduced CS in prediabetes, indicating that magnocellular and parvocellular pathways could be affected due to impaired fasting glucose values in prediabetes.
PSRT has been reported to be a reliable test for macular function.24,26 In 2001, Grott demonstrated that using low-contrast charts to measure PSRT could be a useful clinical tool for assessing macular function.16 The present study data showed significant reduction in PSRT time in those with prediabetes. The normative datum for PSRT measured using direct ophthalmoscopy for age-group ≤50 years is 35 seconds.16 Our normal-group results concurred with this, and the present study data showed that in the group with prediabetes, recovery time was delayed by 6.1 seconds. Further, the data showed a significant delay of 11.97 seconds in macular recovery time in the group with diabetes compared to the normal group. Zingirian et al27 also reported delayed PSRT in individuals with diabetes. Khan et al28 also reported loss of CSF and presence of glare in individuals with no diabetic retinopathy among those known to have type 2 diabetes (T2DM). They also reported that in early cases with no retinopathy, the condition is reversible with glycemic control. If CSF and PSRT become a part of the routine eye examination, individuals in the prediabetic stage could be counseled for lifestyle correction and thereby improve their quality of vision.28
The current study observed a high prevalence of undiagnosed prediabetes (55%). In India, a multicenter study done in 15 states documented a prevalence of prediabetes compared to T2DM (7%–24.7%),6 less than what was observed in the current study. A likely explanation for the higher prevalence in our study could be related to the selection of participants from a tertiary eye hospital, rather than from the general population. The strength of this study is that the tests utilized are easily available in ophthalmic centers. A potential limitation of this study could be that the three groups could not be age-matched. In addition, we do not have information on the duration of diabetes for the group with known diabetes and thus are unable to comment on this.
Conclusion
The study data suggest that reduced CSF and delayed PSRT seen in subjects with prediabetes could give valuable clinical insight into early changes before diabetes and microvascular damage is incurred. A future study with a larger sample could help substantiate the results.
Study Settings
Data were collected in the outpatient department of Lotus Eye Hospital, Mumbai, India.
Study Participants
Staff, patients, and attendants who visited the hospital were enrolled in the study. Contrast-sensitivity function (CSF) and photo stress–recovery time (PSRT) were assessed for 70 participants.
Acknowledgment
We acknowledge interns, staff, and patients of Lotus Eye Hospital and the College of Optometry for participating in the study and support with data collection.
Disclosure
The authors have no conflicts of interest.
References
1. Zinman B. The international diabetes federation world diabetes congress 2015. US Endocrinol. 2015;11(02):104. doi:10.17925/USE.2015.11.02.104
2. Saeedi P, Petersohn I, Salpea P, et al. Global and regional diabetes prevalence estimates for 2019 and projections for 2030 and 2045: results from the international diabetes federation diabetes Atlas, 9th edition. Atlas Diabetes Res Clin Pract. 2019;157:107843. doi:10.1016/j.diabres.2019.107843
3. Ogurtsova K, da Rocha Fernandes JD, Huang Y, et al. IDF diabetes atlas: global estimates for the prevalence of diabetes for 2015 and 2040. Diabetes Res Clin Pract. 2017;128:40–50. doi:10.1016/j.diabres.2017.03.024
4. Evans JM, Newton RW, Ruta DA, et al. Socio-economic status, obesity and prevalence of type 1 and type 2 diabetes mellitus. Diabet Med. 2000;17(6):478–480. doi:10.1046/j.1464-5491.2000.00309.x
5. Johnson EL, Feldman H, Butts A, et al. Standards of medical care in diabetes—2019 abridged for primary care providers. Clin Diabetes. 2019;37:11–34.
6. Anjana RM, Deepa M, Pradeepa R, et al. Prevalence of diabetes and prediabetes in 15 states of India: results from the ICMR–INDIAB population-based cross-sectional study. Lancet Diabetes Endocrinol. 2017;5(8):585–596. doi:10.1016/S2213-8587(17)30174-2
7. Anjana RM, Rani CSS, Deepa M, et al. Incidence of diabetes and prediabetes and predictors of progression among Asian Indians: 10-year follow-up of the Chennai urban rural epidemiology study (CURES). Diabetes Care. 2015;38(8):1441–1448. doi:10.2337/dc14-2814
8. Hyvarinen L, Flower W. Contrast sensitivity in evaluation of visual impairment due to diabetes. Ada Ophthalmol. 1981;61:94–110.
9. Gella L, Raman R, Pal SS, Ganesan S, Sharma T. Contrast sensitivity and its determinants in people with diabetes: SN-DREAMS-II, report no 6. Eye. 2017;31(3):460–466. doi:10.1038/eye.2016.252
10. Huang ES, Laiteerapong N, Liu JY, et al. Rates of complications and mortality in older patients with diabetes mellitus: the diabetes and aging study. JAMA Intern Med. 2014;174(2):251–258. doi:10.1001/jamainternmed.2013.12956
11. Group DPPR. The prevalence of retinopathy in impaired glucose tolerance and recent-onset diabetes in the diabetes prevention program. Diabet Med. 2007;24(2):137–144. doi:10.1111/j.1464-5491.2007.02043.x
12. Whitley HP, Hanson C, Parton JM. Systematic diabetes screening using point-of-care HbA 1c testing facilitates identification of prediabetes. Ann Fam Med. 2017;15(2):162–164. doi:10.1370/afm.2035
13. Liou S-W, Chiu C-J. Myopia and contrast sensitivity function. Curr Eye Res. 2001;22(2):81–84. doi:10.1076/ceyr.22.2.81.5530
14. Pelli DG, Robson JG, Wilkins AJ. The design of a new letter chart for measuring contrast sensitivity. Clin Vision Sci. 1988;2:187–199.
15. Margrain TH, Thomson D. Sources of variability in the clinical photostress test. Ophthalmic Physiol Opt. 2002;22(1):61–67. doi:10.1046/j.1475-1313.2002.00005.x
16. Grott R. Photostress recovery time as assessed using high- and low-contrast letters. Optom Vis Sci. 2001;78:98. doi:10.1097/00006324-200112001-00145
17. Elliott DB, Sanderson K, Conkey A. The reliability of the Pelli-Robson contrast sensitivity chart. Ophthalmic Physiol Opt. 1990;10(1):21–24. doi:10.1111/j.1475-1313.1990.tb01100.x
18. Safi S, Rahimi A, Raeesi A, et al. Contrast sensitivity to spatial gratings in moderate and dim light conditions in patients with diabetes in the absence of diabetic retinopathy. BMJ Open Diabetes Res Care. 2017;5:e000408. doi:10.1136/bmjdrc-2017-000408
19. Joltikov KA, de Castro VM, Davila JR, et al. Multidimensional functional and structural evaluation reveals neuroretinal impairment in early diabetic retinopathy. Invest Ophthalmol Vis Sci. 2017;58:BIO277–BIO290. doi:10.1167/iovs.17-21863
20. Neriyanuri S, Pardhan S, Gella L, et al. Retinal sensitivity changes associated with diabetic neuropathy in the absence of diabetic retinopathy. Br J Ophthalmol. 2017;101(9):1174–1178. doi:10.1136/bjophthalmol-2016-309641
21. Arend O, Remky A, Evans D, Stüber R, Harris A. Contrast sensitivity loss is coupled with capillary dropout in patients with diabetes. Invest Ophthalmol Vis Sci. 1997;38:1819–1824.
22. Bresnick GH, Condit R, Palta M, Korth K, Groo A, Syrjala S. Association of hue discrimination loss and diabetic retinopathy. Arch Ophthalmol. 1985;103(9):1317–1324. doi:10.1001/archopht.1985.01050090069034
23. Gualtieri M, Bandeira M, Hamer RD, Damico FM, Moura ALA, Ventura DF. Contrast sensitivity mediated by inferred magno- and parvocellular pathways in type 2 diabetics with and without nonproliferative retinopathy. Invest Ophthalmol Vis Sci. 2011;52(2):1151–1155. doi:10.1167/iovs.09-3705
24. Bartlett H, Davies LN, Eperjesi F. Reliability, normative data, and the effect of age-related macular disease on the Eger Macular Stressometer photostress recovery time. Ophthalmic Physiol Opt. 2004;24(6):594–599. doi:10.1111/j.1475-1313.2004.00245.x
25. Bindu S, Pt J, Prabhu PB, et al. Photostress test as a predictor of macular dysfunction in patients with asymmetrical age-related maculopathy. Indian J Clin Exp Ophthalmol. 2017;3:61–65.
26. Severin SL, Harper C, Culver JF. Photostress test for the evaluation of macular function. Arch Ophthalmol. 1963;70(5):593–597. doi:10.1001/archopht.1963.00960050595003
27. Zingirian M, Polizzi A, Grillo N. The macular recovery test after photostress in normal and diabetic subjects. Acta Diabetol Lat. 1985;22:169–172. doi:10.1007/BF02590791
28. Khan A, Petropoulos IN, Ponirakis G, Malik RA. Visual complications in diabetes mellitus: beyond retinopathy. Diabet Med. 2017;34(4):478–484. doi:10.1111/dme.13296
 © 2020 The Author(s). This work is published and licensed by Dove Medical Press Limited. The
full terms of this license are available at https://www.dovepress.com/terms
and incorporate the Creative Commons Attribution
- Non Commercial (unported, 3.0) License.
By accessing the work you hereby accept the Terms. Non-commercial uses of the work are permitted
without any further permission from Dove Medical Press Limited, provided the work is properly
attributed. For permission for commercial use of this work, please see paragraphs 4.2 and 5 of our Terms.
© 2020 The Author(s). This work is published and licensed by Dove Medical Press Limited. The
full terms of this license are available at https://www.dovepress.com/terms
and incorporate the Creative Commons Attribution
- Non Commercial (unported, 3.0) License.
By accessing the work you hereby accept the Terms. Non-commercial uses of the work are permitted
without any further permission from Dove Medical Press Limited, provided the work is properly
attributed. For permission for commercial use of this work, please see paragraphs 4.2 and 5 of our Terms.