Back to Journals » Clinical Ophthalmology » Volume 15
Contrast Sensitivity Changes in Center Involving Diabetic Macular Edema Treated with Aflibercept
Authors Nixon DR, Flinn N, Enderlein C
Received 9 September 2021
Accepted for publication 2 November 2021
Published 11 November 2021 Volume 2021:15 Pages 4439—4445
DOI https://doi.org/10.2147/OPTH.S338478
Checked for plagiarism Yes
Review by Single anonymous peer review
Peer reviewer comments 2
Editor who approved publication: Dr Scott Fraser
Donald R Nixon,1 Nicholas Flinn,2 Claudia Enderlein3
1Department of Surgery Northern Ontario School of Medicine Nosm, Sudbury, Ontario, P3E 2C6, Canada; 2Trimed Eye Centre Barrie Ontario, Barrie, Ontario, L4M 4S5, Canada; 3Trillium Health Partners, Mississauga, Ontario, L5B 1B8, Canada
Correspondence: Donald R Nixon Email [email protected]
Purpose: To characterize the changes in contrast sensitivity (CS) and retinal anatomy in patients with center involving diabetic macular edema (CDME) measured from baseline to post-loading doses of aflibercept.
Patients and Methods: This single center, prospective, open-label, non-controlled evaluation of five aflibercept intravitreal injections for treatment of CDME over a 16-week period. One eye in each of the forty patients will receive aflibercept every 4 weeks. Subject testing includes measurements of central retinal thickness (CRT), best corrected visual acuity (BCVA), Pelli–Robson (PR) CS, and CamBlobs (CB) CS at 20 weeks post baseline.
Results: A total of 40 eyes from 40 patients with CDME were analyzed. The mean age was 62.9 ± 10.6 years and 55% were male. At baseline, CRT was 365 ± 94.6μm with logMAR BCVA 0.25± 0.20. CS PR at baseline was 1.46± 0.13 logCS compared to the normal population 1.79± 0.10 logCS (P=< 0.01), and the CS CB was 1.55± 0.16 logCS compared to 1.92± 0.08 logCS in the normal population (P=< 0.01). At the completion of the study, CRT was decreased to 289 ± 43.7μm (P=< 0.001), and the logMAR BCVA improved to 0.18± 0.02 (P=< 0.05). At the same point the CS PR was 1.52± 0.16 and CS CB was 1.62± 0.16 logCS. At the end of the study 85% of eyes obtained BCVA of 0.3 logMAR or better. There was a reduction from baseline of 82.5% to 57.5% in the number of patients that had a CS that was two standard deviations below the mean. The greatest improvement in CS was associated with those patients that had the greatest reduction in CRT.
Conclusion: CS impairment in patients with CDME is significant. Although treatment can be associated with improvement, there still remains a group with decreased CS that could impact activities of daily living. Earlier intervention using reduction in CS as a metric may be associated with reduced residual deficit associated with treatment.
Keywords: contrast sensitivity, residual deficit, functional impairment
Introduction
In the developed world, diabetes has become a healthcare crisis with implications on treatment and long-term care. Concerns about visual performance in this population are relevant today as diabetes in the adult population has increased almost four-fold from 1980 to 2014 due to population growth, increased prevalence, and aging in the population. Diabetic macular edema (DME) is the most common cause of decreased best corrected visual acuity (BCVA) and irreversible vision loss, with up to 10% of diabetic patients affected.1,2
Current intravitreal anti-VEGF treatment recommendations for DME specify that along with the presence of center involving macular edema CDME, as measured by Optical Coherence Tomography (OCT), there must also be a decrease in BCVA of 0.20 logMAR or more as measured at distance using a black on a white letter chart to be a candidate for treatment.3–5 There is a growing body of literature that demonstrates patients with CDME and diabetic retinopathy suffer from decreased contrast sensitivity (CS) before there are any detectable changes in visual acuity.6–9 Patients will tolerate a mild degree of macular edema, exudate, and vascular damage but they eventually reach a tipping point beyond which is characterized by a cascade of irreversible vision loss. Advanced testing, such as electroretinography and sensitive psychophysical testing, may detect early signs of progressive retinal dysfunction but time and cost limit their availability in general practice.26 CS testing can detect early retinal dysfunction that correlates to an impact on quality of life since contrast is a key component in facial recognition, driving, and reading.10,11 It is unknown at this time whether the patients that lose CS associated with diabetic macular edema will regain what they have lost once they meet current treatment BCVA recommendations and begin intravitreal treatment. In a recent study of patients with CDME treated to stabilization following standard enrolment criteria and injection frequency as expected, retinal anatomy could be re-established and 95% of the study population had a BCVA acuity ≥+0.4 logMAR satisfying the criteria for driving. However, CS in the same group was more than two standard deviations below the normal population mean in 88% of treated eyes.12 The impact of this decreased visual function cannot be understated and is the driving force to understand what is the CS of patients at enrolment who satisfy the present criteria for intravitreal injections for CDME and whether treatment will improve or slow the loss of CS over time.
This study is focused on changes in CS and its association with BCVA and Central Retinal Thickness (CRT) in patients undergoing standard treatment for CDME using aflibercept. Any relationships noted might be used for future studies to ensure proper and timely initiation of treatment to restore and preserve visual function.
Patients and Methods
This institutional review board (IRB)-Approved (Advarra, Aurora, ON, Canada) (CR 00029923) prospective, observational, non-controlled, single center study was conducted at Tri Med Laser Eye Center, Barrie Ontario (October 2018 and June 2020). A total of 40 patients with DME were enrolled if they met the inclusion and exclusion criteria listed in Table 1. The study was conducted in accordance with the principles of the Declaration of Helsinki and in compliance with Good Clinical Practice and applicable regulatory requirements. Written informed consent was obtained from all participants before study enrollment.
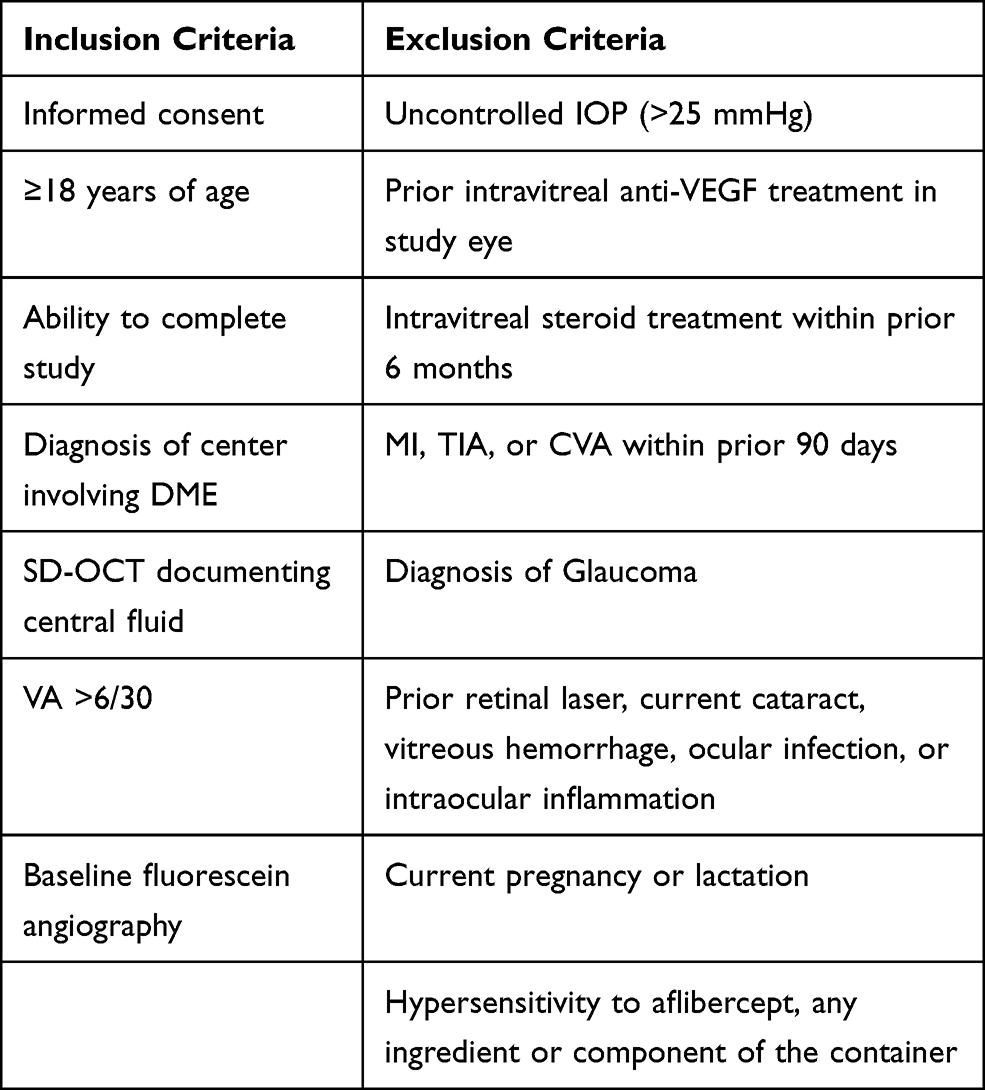 |
Table 1 Inclusion and Exclusion Criteria |
The primary endpoints were the CS, BCVA and CRT of the treated eyes, with the CS results compared to baseline and the normal database for CS.3,13–15 The primary investigator (PI) was masked to the CRT and CS results until the end of the study.
The patient populations that satisfied the criteria for intervention for CDME7 received a loading dose5,16 with aflibercept after all baseline measurements were tested and recorded and received treatment for at least 6 months. They were assessed at 4 weeks after the fifth dose. In patients satisfying the criteria for treatment in both eyes, the eye with the lower BCVA at the time of enrolment was considered the study eye.
Eligible subjects were tested monocularly for CS using the Pelli–Robson (PR) chart and the CamBolbs (CB) CS testing system,3,13,14 as well as high-resolution OCT and BCVA. The CS testing with PR was completed at 1m using the “per letter” method of scoring.13,14 The CS testing with CB was self-administered, taken in good lighting, at a comfortable reading distance.15
Monocular BCVA was recorded using the Snellen chart and converted to the logarithm of minimum angle of resolution (logMAR) equivalents for analysis.
OCT measures, including CRT and ganglion cell layer volume (GCLV), were measured using SD-OCT (Heidelberg Spectralis, Heidelberg Engineering In, Vista, CA, USA) and compared to a normative database for this system.17
Statistical Analysis
Statistical analysis was completed following the completion of the subjects using R version 3.4.0. Visual function statistical analysis included mean logMAR BCVA and mean CS, comparing study population to the normal population.17 If not otherwise stated, all values are presented as mean± SD. Comparison of the same population from baseline to the end of the study was completed using paired Wilcoxon Signed Rank tests. A P-value <0.05 was considered statistically significant. The normal data for CamBlobs and Pelli–Robson CS was used for the study.14,15
Results
A total of 40 eyes from 40 patients were included in the analysis, all with CDME. All patients were naïve to treatment at the time of enrolment. The mean age of the patients was 62.9±10.6 years and 55% were male. All patients completed the required testing and no adverse events were reported during their participation in the study.
Measures of Visual Function and Anatomic Outcomes
CRT
The CRT at baseline was 365 ±94.6 µm, four weeks after the final loading dose it was 289 ±43.7µm, a 75.6µm reduction (P < 0.001) (Figure 1). Thirty-six patients (90%) had stable CRT over the two previous visits and would satisfy the criteria to extend to the 8 weeks interval.
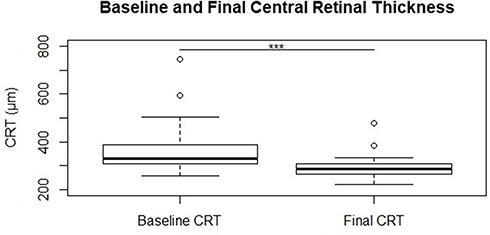 |
Figure 1 OCT measured central retinal thickness (µm) at baseline and final measurements and normal population data, black bar represents median value, open circles are outliers, statistical significance is noted above relevant groups (***p < 0.001). |
Visual Acuity
The baseline BCVA was 0.25±0.20 logMAR, four weeks after the final loading dose it was 0.18±0.13 logMAR, an improvement of 0.07 logMAR (P < 0.05) (Figure 2).
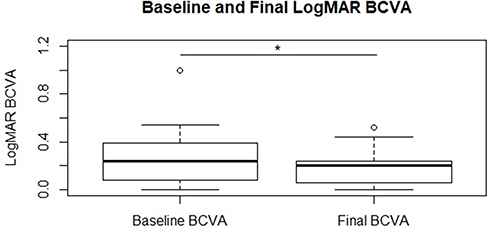 |
Figure 2 LogMAR BCVA in study eye at baseline and final measurements, black bar is the median value, open circles are outliers, statistical significance is noted above relevant groups (*p < 0.05). |
CamBlobs vs Pelli Robson
From other previous studies3,15 there is a moderate correlation between CamBlobs (CB) and Pelli Robson (PR) with consistently higher values for CamBlobs.
CB CS at baseline was 1.55±0.16 logCS compared to 1.92±0.08 logCS in the normal population, a difference of 0.37 logCS. Four weeks after the final loading dose the CB CS was 1.62±0.16, a difference of 0.07 logCS (P < 0.01) (Figure 3). CB CS after the loading dose was 1.62±0.16 logCS compared to 1.92±0.08 logCS in the normal population, a difference of 0.30 logCS.
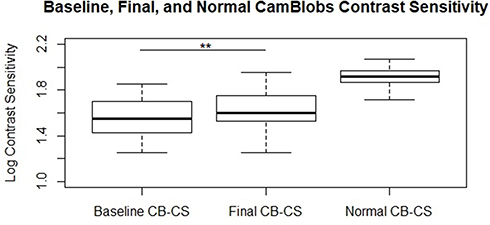 |
Figure 3 Camblobs contrast sensitivity in study eye at baseline and final measurements, and normal population data, black bar is the median value, open circles are outliers, statistical significance is noted above relevant groups (**p < 0.01). |
PR CS at baseline was 1.46±0.13 logCS compared to 1.79±0.10 logCS in the normal population, a difference of 0.33 logCS. Four weeks after the final loading dose the PR CS was 1.52±0.16 logCS, a difference of 0.06 logCS (P < 0.01) (Figure 4). PR CS after the loading dose was 1.52±0.16 logCS compared to 1.79±0.10 logCS in the normal population, a difference of 0.27 log units.
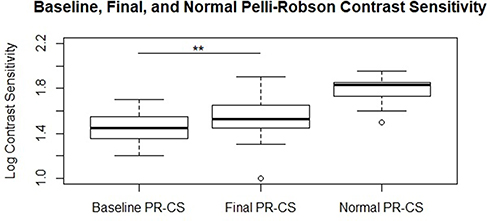 |
Figure 4 Pelli–Robson contrast sensitivity in study eye at baseline and final measurements, and normal population data, black bar is the median value, open circles are outliers, statistical significance is noted above relevant groups (**p < 0.01). |
There was a positive relationship between reduction in CRT and improvement in CS overall; the subset that had the greatest reduction in CRT also had the greatest improvement in CS (Figures 5 and 6).
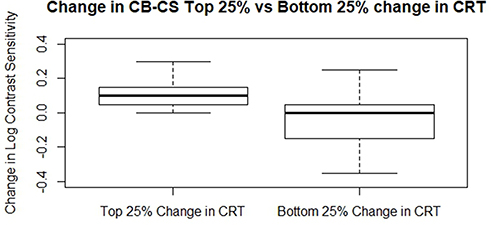 |
Figure 5 Change in Camblobs contrast sensitivity in subjects in the top 25% and bottom 25% change in central retinal thickness (CRT) between baseline and final measurements. |
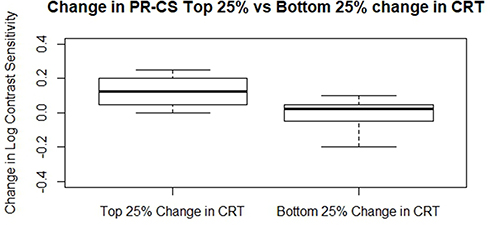 |
Figure 6 Change in Pelli–Robson Contrast Sensitivity in subjects in the top 25% and bottom 25% change in central retinal thickness (CRT) between baseline and final measurements. |
At baseline, 33 of 40 (82.5%) patients had a reduction in CS of 2 standard deviations from the mean compared to the normative data base while mean BCVA was 0.25 logMAR in the same population. At four weeks after the final loading dose, only 23 of 40 (57.5%) patients fell below the 2 standard deviations threshold (30.3% decrease) while mean BCVA improved to 0.18 logMAR.
Discussion
The use of anti-VEGF agents has had a disruptive effect on the treatment and outcomes of center involving diabetic macular edema with decreased BCVA.3,5 Several studies have shown differences in outcome in the same disease with different anti-VEGF agents.3,19 More recent studies using aflibercept that have evaluated the timing of intervention continue to focus on BCVA reduction in the presence of CDME as the threshold for intervention. One study looking at minimizing anti-VEGF treatment randomized patients with CDME having BCVA >6/9 into three groups: observation with deferred aflibercept as needed, focal laser with deferred aflibercept as needed, or initiation of prompt aflibercept, concluded that patients with center-involved diabetic macular edema and good vision can confidently be managed by observation, scheduling anti-VEGF injections only if vision deteriorates.18 There have, however, been concerns that the outcomes of this approach may leave the observation group with a lower level of BCVA and a greater number of ETDRS letters lost at 2 years.20 This approach also runs counter to the conclusions of the Early Treatment Diabetic Retinopathy Study that early intervention for CDME may prevent vision loss even in patients with good BCVA.21 More recent studies have taken another approach and evaluated another visual function outside of BCVA in the outcome analysis that is contrast sensitivity CS.12,19 CS is important in activities of daily living including mobility, reading speed, quality of life, and driving with symptoms most prevalent in low-level lighting conditions, fog, or reflective glare.22–24 In these studies, although treatment with anti VEGF intravitreal injections was associated with an improvement in BCVA18 the vast majority of patients had a significant reduction in their CS post stabilization.12,19
BCVA is tested at 100% contrast and the optotype reduces in size to determine what arc angle the patient can resolve. With CS testing, both the level of contrast and optotype size can change depending on the testing modality used. The extent to which BCVA and CS can be affected, as well as the level of recovery with therapy, depends on the duration and severity of the disease. BCVA has been well documented to improve with anti-VEGF therapy in DME,5 but fewer studies have included CS as an outcome parameter.18 A decrease in CS can lead to a loss of spatial awareness, mobility, and can increase the risk of injuries including motor vehicle accidents.25 This condition is not a direct indication of poor or weakening BCVA. It is possible to have normal VA while also experiencing reduced CS; therefore, testing photopic BCVA alone is not a good predictor of low contrast visual function and performance.11
The results of this study support the disconnect between CS and BCVA as, at the time of enrolment, 82.5% of patients had a minimum of at least a 2-standard deviation (SD) reduction in CS and although there was a significant improvement at the end of the study overall there were still 57.5% of patients that were two SD below the population mean. In the same population, the VA was 0.25 logMAR at baseline and improved to 0.18 logMAR with 97.5% <0.4 logMAR. Patients with diabetes and no retinopathy, diabetic retinopathy without edema, and persons with DME all can show decreased CS before changes in BCVA occur as measured on traditional tests.7–9 Inner retinal vascular diseases such as diabetic retinopathy are known to measurably reduce the inner retinal cell layers which may lead to the reduction in CS observed. In diabetic retinopathy, the cause and sequence of damage are multifactorial including metabolic, inflammatory, and vascular, as well as being chronic and progressive in nature.27 There does appear to be a relationship between a reduction in retinal edema and fluid leakage, as measured by ocular coherence tomography (OCT) with an improvement in BCVA; however, the amount of improvement and the final outcome has limited predictability.12 Researchers in ophthalmology focusing on glaucoma are also investigating reduced CS as part of visual functional loss in those with glaucoma. Current studies in glaucoma associate the loss of CS to loss of ganglion cell layer thickness in the macula;6 a physiological parallel can be drawn to diabetic macular edema as they too lose ganglion cells throughout the course of the disease.28 The difficulty in using the ganglion cell layer volume GCLV at baseline as a metric for initiation of treatment is the existence of fluid; unless there is an advancement in resolution and digital subtraction technology, this OCT metric is still of limited use. GCLV is also a poor metric to determine when treatment stability has been reached because at the time of stability it is also problematic as of the weak correlation between GCLV and CS in the DME group. This may be because the reduction in GCL is focal rather than diffuse.12 Therefore, looking at variability in discrete volume thickness or focal testing may be associated with more sensitive identification of ganglion cell loss than total ETDRS template volume.27
This study demonstrates that a reduction in CRT with the completion of a loading dose of aflibercept is associated with an improvement in CS, and that the greater reduction in CRT with treatment is associated with the greatest recovery of CS. This is the first study using two different CS testing methods that both show a significant impairment in CS at baseline and also provide evidence to support the notion that CS improves with treatment. The results of this study suggest that the existing guidelines for the initiation of treatment of CDME should include the measurement of CS given its importance in activities of daily living such as driving. Not measuring CS as part of a fuller assessment of visual function as a baseline and endpoint may have underestimated treatment effects in existing studies. With the current availability of inexpensive and reproducible CS tests that can be used in clinical studies and routine clinical practice, there are no objective reasons not to include CS testing. Further studies need to be initiated to determine if CS can be regained following treatment, as currently there are no recommendations available as to when to initiate anti-VEGF treatment if the goal is to preserve or regain CS function. If ganglion cell loss is responsible for the decrease in CS, then it is likely that the amount of loss may act as a predictor of how much improvement may occur.
There are many questions that remain. If the reduction in the ganglion cell population is the cause of decreased CS in diabetic retinopathy, will earlier intervention with anti-VEGF treatment with center involving DME, but better than 6/9 BCVA, reduce or prevent GC loss and therefore preserve CS?26 What CS testing modality will be best to apply for clinic and research purposes? Will the early identification of CS reduction be a factor in efforts to further improve glycemic control given that patients with higher hemoglobin A1c levels are more likely to lose vision?
Conclusion
In this study, we found that CS can be improved with aflibercept therapy, and the amount of improvement was associated with the total reduction in central retinal thickness (CRT) in a naïve population of patients with center involving macular edema and reduced BCVA. A significant amount of CS had already been lost at the time of enrolment and although improvement occurred there was still a measurable deficit compared to the normal population.
The results of this study are limited by the small sample size, and limited follow-up duration. There was also a limited variety of CS testing conditions and modalities, including only photopic and not mesopic or scotopic lighting and a static image size in both Pelli–Robson and CamBlobs. The normative data base for both the Pelli-Robson and CamBolbs that were used are limited in the higher age bracket and more work will be required to adjust for reduction in CS associated with age alone.24 It may be helpful to incorporate CS testing at baseline in large-scale studies to assess visual functional results such as determining in diabetic retinopathy if earlier intervention would have any effect in preserving CS before manifest diabetic macular edema.
Funding
This work was supported by Bayer and Sentrex in the capacity of Independent Investigator Research funding.
Disclosure
Dr Donald R Nixon reports grants, personal fees from Bayer and Sentrex for Independent Investigator Research funding Advisory board Speaker Bureau; Novatis and Johnson & Johnson for Investigator Research funding Advisory board Speaker Bureau; patent payments from Oculus, during the conduct of the study. The authors report no other conflicts of interest in this work.
References
1. Das A, McGuire PG, Rangasamy S. Diabetic macular edema: pathophysiology and novel therapeutic targets. Ophthalmology. 2015;122(7):1375–1394. doi:10.1016/j.ophtha.2015.03.024
2. Pelli DG, Robson JG, Wilkins AJ. The design of a new letter chart for measuring contrast sensitivity. Clin Vis Sci. 1988;2:187–99.37.
3. Wells J, Glassman A, Ayala AR, et al. Aflibercept, bevacizumab, or ranibizumab for diabetic macular edema two-year results forma comparative effectiveness randomized trial. Ophthalmology. 2016;123:1351–1359. doi:10.1016/j.ophtha.2016.02.022
4. Wells J, Glassman A, Ayala A, et al.; for the he Diabetic Retinopathy Clinical Research Network. Aflibercept, bevacizumab or ranibizumab for diabetic macular edema. N Engl J Med. 2015;372:1193–1203.
5. Aiello LP, Beck RW, Bressler NM, et al. Rationale for the diabetic retinopathy clinical research network treatment protocol for center-involved diabetic macular edema. Ophthalmology. 2011;118(12):5–14. doi:10.1016/j.ophtha.2011.09.058
6. Fatehi N, Nowroozizadeh S, Henry S, Coleman AL, Caprioli J, Nouri-Mahdavi K. Association of structural and functional measures with contrast sensitivity in glaucoma. Am J Ophthalmol. 2017;178:129–139.
7. Katz G, Levkovitch-Verbin H, Treister G, Belkin M, Ilany J, Polat U. Mesopic foveal contrast sensitivity is impaired in diabetic patients without retinopathy. Graefes Arch Clin Exp Ophthalmol. 2010;248(12):1699–1703. doi:10.1007/s00417-010-1413-y
8. Sokol S, Moskowitz A, Skarf B, Evans R, Molitch M, Senior B. Contrast sensitivity in diabetics with and without background retinopathy. Arch Ophthalmol. 1985;103(1):51–54. doi:10.1001/archopht.1985.01050010055018
9. Falsini B, Porciatti V, Scalia G, et al. Steady-state pattern electroretinogram in insulin dependent diabetics with no or minimal retinopathy. Doc Ophthalmol. 1989;73(2):193–200. doi:10.1007/BF00155037
10. Greenstein V, Sarter B, Hood D, Noble K, Carr R. Hue discrimination and cone pathway sensitivity in early diabetic retinopathy. Invest Ophthalmol Vis Sci. 1990;31:1008–1014.
11. Gruber N, Mosimann UP, Muri RM, Nef T. Vision and night driving abilities of the elderly. Traffic Inj Prev. 2013;14(5):477–485. doi:10.1080/15389588.2012.727510
12. Nixon D, Flinn N. Visual function for driving in diabetic macular edema and retinal vein occlusion post-stabilization with anti-vascular endothelial growth factor. Clin Ophthalmol. 2021;15:1659–1666. doi:10.2147/OPTH.S304229
13. Elliott DB, Bullimore MA, Bailey IL. Improving the reliability of the Pelli-Robson contrast sensitivity test. Clin Vis Sci. 1991;6:471–475.
14. Griffin A, Cheng H, Robson J. Measuring contrast sensitivity using CambBlobs2 disposable paper charts in normal subjects. Invest Ophthalmol Vis Sci. 2017;58(8):4231.
15. Robson J, Raman R, Jaisankar D, Sapkota RP, Pardhan S. Contrast sensitivity measured with illiterate single use printed paper charts to assess the severity of diabetic retinopathy. Invest Ophthalmol Vis Sci. 2017;58(8):4698.
16. Korobelnik J, Do D, Schmidt-Erfurth U, et al. Intravitreal aflibercept for diabetic macular edema. Ophthalmology. 2014;121(11):2247–2254. doi:10.1016/j.ophtha.2014.05.006
17. Nieves-Moreno M, Martínez-de-la-casa JM, Cifuentes-Canorea P, et al. Normative database for separate inner retinal layers thickness using spectral domain optical coherence tomography in Caucasian population. PLoS One. 2017;12(7):e0180450. doi:10.1371/journal.pone.0180450
18. Baker CW, Glassman AR, Beaulieu WT, for the DRCR Retina Network, et al. Effect of initial management with aflibercept vs laser photocoagulation vs. observation on vision loss among patients with diabetic macular edema involving the center of the macula and good visual acuity. A randomized clinical trial. JAMA. 321;2019:1880–1894. doi:10.1001/jama.2019.5790
19. Nixon DR, Flinn NA. Evaluation of contrast sensitivity and other visual function outcomes in diabetic macular edema patients following treatment switch to aflibercept from ranibizumab. Clin Ophthalmol. 2018;12:191–197. doi:10.2147/OPTH.S158268
20. Grassi M. What is just the right amount of anti-vascular endothelial growth factor treatment for diabetic macular edema?. JAMA Opthal. 2021;139:381–382.
21. Early Treatment Diabetic Retinopathy Study Research Group. Photocoagulation for diabetic macular edema: early Treatment Diabetic Retinopathy Study report number 1. Arch Ophthalmol. 1985;103:1796–1806. doi:10.1001/archopht.1985.01050120030015
22. West SK, Rubin GS, Bowman AT, Munoz B, Bandeen-Roche K, Turano K. How does visual impairment affect performance on tasks of everyday life? The SEE project. Arch Ophthalmol. 2002;120(6):774–780. doi:10.1001/archopht.120.6.774
23. Rubin GS, Bandeen-Roche K, Huang GH, et al. The association of multiple visual impairments with self-reported visual disability: SEE project. Invest Ophthalmol Vis Sci. 2001;42:64–72.
24. Owsley C, Sekuler R, Siemsen D. Contrast sensitivity throughout adulthood. Vision Res. 1983;23(7):689–699. doi:10.1016/0042-6989(83)90210-9
25. Swain T, McGwin G
26. Simo R, Stitt A, Gardner T. Neurodegeneration in diabetic retinopathy: does it really matter? Diabetologia. 2018;61(9):1902–1912. doi:10.1007/s00125-018-4692-1
27. Hegazy AI, Zedan RH, Macky TA, Esmat SM. Retinal ganglion cell complex changes using spectral domain optical coherence tomography in diabetic patients without retinopathy. Int J Ophthalmol. 2017;10(3):427. doi:10.18240/ijo.2017.03.16
28. George R, Hemamalini A, Baskaran M, Ramesh SV, Raju P, Vijaya L. The Chennai glaucoma study: prevalence and risk factors for glaucoma in cataract operated eyes in urban Chennai Indian. J Ophthalmol. 2010;58(3):243–245.
 © 2021 The Author(s). This work is published and licensed by Dove Medical Press Limited. The
full terms of this license are available at https://www.dovepress.com/terms
and incorporate the Creative Commons Attribution
- Non Commercial (unported, 3.0) License.
By accessing the work you hereby accept the Terms. Non-commercial uses of the work are permitted
without any further permission from Dove Medical Press Limited, provided the work is properly
attributed. For permission for commercial use of this work, please see paragraphs 4.2 and 5 of our Terms.
© 2021 The Author(s). This work is published and licensed by Dove Medical Press Limited. The
full terms of this license are available at https://www.dovepress.com/terms
and incorporate the Creative Commons Attribution
- Non Commercial (unported, 3.0) License.
By accessing the work you hereby accept the Terms. Non-commercial uses of the work are permitted
without any further permission from Dove Medical Press Limited, provided the work is properly
attributed. For permission for commercial use of this work, please see paragraphs 4.2 and 5 of our Terms.