Back to Journals » Patient Preference and Adherence » Volume 14
Continuity of Care in Swiss Cancer Patients Using Claims Data
Authors Blozik E ![]() , Bähler C, Näpflin M, Scherer M
, Bähler C, Näpflin M, Scherer M
Received 5 June 2020
Accepted for publication 28 October 2020
Published 18 November 2020 Volume 2020:14 Pages 2253—2262
DOI https://doi.org/10.2147/PPA.S266381
Checked for plagiarism Yes
Review by Single anonymous peer review
Peer reviewer comments 2
Editor who approved publication: Dr Johnny Chen
Eva Blozik,1,2 Caroline Bähler,1 Markus Näpflin,1 Martin Scherer3
1Department of Health Sciences, Helsana Group, Zürich, Switzerland; 2Institute of Primary Care, University of Zürich, Zürich, Switzerland; 3Department of General Practice, Primary Care, University Medical Center Hamburg-Eppendorf, Hamburg, Germany
Correspondence: Eva Blozik
Department of Health Sciences, Helsana Group, Post Box 8081, Zürich, Switzerland
Tel +41 58 340 7101
Fax +41 58 340 03 06
Email [email protected]
Background: Continuity of care is positively associated with beneficial patient outcomes. Data on the level of continuity of care in the ambulatory setting in Switzerland are lacking.
Aim: The aim of this study was to evaluate continuity of care in Swiss cancer patients based on routine data of mandatory health insurance using four established continuity scales.
Methods: Retrospective analysis of Swiss claims data (N=23ʹ515 patients with incident use of antineoplastics). The Usual Provider Continuity score, the Modified Modified Continuity Index, the Continuity of Care index, and the Sequential Continuity Index were analyzed based on consultations with general practitioners (GPs), physician specialists and ambulatory hospital wards.
Results: Using information of health insurance claims, the number of consultations and the general level of continuity of care in Swiss cancer patients are high. Continuity of care scores were significantly associated with sociodemographic and regional factors. When focusing on consultations with GPs only, all four scores consistently showed high values indicating high levels of continuity. Continuity with general practitioners was associated with lower costs and lower risks for hospitalization and death.
Conclusion: This is the first study giving insight into continuity of care in Swiss cancer patients. The present study shows that continuity of care is measurable using health insurance claims data. It indicates that continuity with general practitioners is associated with a beneficial outcome.
Keywords: continuity, cancer, health insurance, claims data, care, scale
Introduction
Indisputably, continuity of care is a key aspect of quality of care. It has been shown to be associated with beneficial outcomes such as mortality, healthcare utilization, preventive care utilization, care quality, patient satisfaction, and adherence.1
The beneficial effects of continuity of care seem to vary with increasing medical complexity.2 Cancer is a classic example of a very complex disease characterized by varying clinical features and treatment phases. Diagnosis and treatment of cancer require multidisciplinary collaboration across the interface of health-care sectors.3 Transitions between hospital and ambulatory care are the most vulnerable parts of the delivery of high quality and safe care, especially in fragmented health-care structures such as present in Switzerland.4 Continuity of care is therefore considered a marker of quality of care in cancer patients.5 Cancer patients regularly necessitate treatment from several providers, including surgeons, oncologists, primary care physicians, nutritionists, psychologists and social workers, who are often located in different settings. This may result in fragmented and uncoordinated care.6 Continuity of care is therefore a major concern of cancer patients and their relatives.7
Several instruments for the measurement of continuity of care have been developed8 and can be calculated based on claims data.9,10 It has been previously postulated that studies and quality initiatives seeking to evaluate continuity of care should make use of administratively derived measures whenever possible,11 or that patient-reported results should be used in tandem with administratively derived values.3 Switzerland has a system of mandatory health insurance covering a broad catalogue of health services for diagnosis and treatment of medical problems.12 Claims data of Swiss mandatory basic health insurance provide therefore an excellent opportunity to construct, use, and evaluate established continuity measures.
Based on a large sample of cancer patients, the present study evaluates continuity of care using four established continuity scales. It depicts consultation patterns in Swiss cancer patients and investigates continuity of care in Swiss cancer patients across patient subgroups and regions. In addition, it explores the association of different measures of continuity of care with health services’ utilization, costs, and death. In contrast to previous research, the present study differentiates the type of healthcare provider, ie, consultations with general practitioners, specialist physicians, and ambulatory hospital wards. Adverse effects of lack of continuity of care might be principally avoidable by better continuity of care. However, valid data is a prerequisite for quality improvement programs.
Methods
Study Design
Retrospective analysis of claims data from the Helsana health insurance group, Zürich, Switzerland. Helsana is one of the largest health insurances in Switzerland covering about 1.2 million mandatory insured persons (about 14% of the Swiss population). The patient-level linked database includes longitudinal information on sociodemographics, health insurance status, prescribed drugs, health-care utilization and its associated costs and the date of death.
Data and Study Population
Patient characteristics included age, sex, regional variables (language area, region of Switzerland, urbanity), and the type of health insurance plan. The health insurance plan was characterized by the choice of a managed care model and the chosen deductible class. Swiss residents are free to annually choose their basic mandatory health insurance. Premium reductions are available for those who accept restrictions in the free choice of service providers and select a so-called managed care model. Those models include health plans with capitation (joint budget responsibility of primary care physician and health insurance), family doctor models (gatekeeping by selected primary care physician), or telemedicine models (gatekeeping by telemedicine center). Deductibles are obligatory for all Swiss residents and range from 300 to 2500 Swiss Francs (CHF) per year. The standard deductible is 300 CHF, but the insured persons can choose higher deductibles in exchange for reduced premiums. For the analysis, we defined the lowest two levels of deductibles (300 and 500 CHF) as “low deductible” and deductibles from 1000 to 2500 CHF as “high deductibles”. These data are highly reliable because the collected insurance claims cover almost all health-care invoices. All geographic information was defined based on the zip codes of residence of the insured person. Level of urbanity (urban, intermediate, rural) was defined using information of the Federal Office of Statistics.13 General practitioners, specialists and ambulatory hospital wards are allocated in all parts of Switzerland and all groups are involved in care for cancer patients.
We performed a cohort study of Helsana enrollees aged older than 18 years with basic obligatory health insurance at the Helsana Group between 2014 and 2017. We selected all persons with an incident prescription of an antineoplastic agent (Anatomical Therapeutic Chemical Classification code L01), ie, they had no prior use in the preceding 12 months.
Measures of Continuity
Based on the available literature, we selected four indices constructible on routine data that are internationally established, validated, have been shown to be associated with patient outcomes, and reflect different aspects of continuity of care.4,14–17
- The Usual Provider Continuity index (UPC)4,20 This index describes the proportion of visits to the patient’s regular physician out of all visits. It ranges from 0 (no visit to the regular physician) to 1 (all visits made to the regular physician). If no regular physician is defined for a patient, the index is computed for the physician the patient visited most frequently.18 This index focuses on the dispersion between providers and is based on the number of caretakers and number of visits only. Index values range from 0 (each visit made to a different physician) to 1. (all visits made to a single physician)
- Modified Modified Continuity Index (MMCI). This index focuses on the dispersion between providers and is based on the number of caretakers and number of visits only. Index values range from 0 (each visit made to a different physician) to 1 (all visits made to a single physician).4,19
- The Continuity of Care index (COC)2,20 This index weights both the frequency of visits to each caretaker and the dispersion of visits between caretakers. Index values range from 0 (each visit made to a different physician) to 1 (all visits made to a single physician).
- The Sequential Continuity index (SECON).4,20 This index measures the number of visits made to the caretaker whom the patient saw in the most recent visit. This index is useful for assessing the need to share information among caretakers. Index values range from 0 (every visit made to a physician other than the physician seen in the previous visit) to 1 (all visits made to a single physician).
A consultation was defined as presence of a consultation tariff code based on the national tariff system for ambulatory services in Switzerland Tarmed. Only tariff codes related to face-to-face encounters were considered as indicators for consultations. Tariff codes are invoiced by either a GP, a specialist or an ambulatory hospital ward, so that consultations were assigned to the corresponding group of service providers.
Statistical Analyses
In a first step, we performed descriptive analyses of the study sample. Incident antineoplastic drug treatment is a proxy for an intensive treatment phase of a malignancy. We aimed to focus the present study on the “chronic” care period of patients with cancer, and therefore plotted consultations over time, stratified by consultations with general practitioners (GPs), specialists and ambulatory hospital wards to identify the average end of the intensive incident treatment phase with antineoplastics. Secondly, we calculated score values and did descriptive statistics (median, mean, interquartile range, standard deviation, number of patients with continuity score equal zero and equal one, respectively, number of patients with no consultation to a physician at all during a given period). In order to enable aggregate measurements and to facilitate benchmarking of continuity of care, we derived a composite measure of continuity by adding the score values of the four scales and dividing by four (COMP). In a third step, we calculated median scores stratified by patient characteristics and tested for differences between groups using Kruskal–Wallis rank-sum test. Fourthly, we calculated the correlation between the four continuity of care indices and the composite measure and healthcare services utilization and death were calculated using Spearman’s rank correlation coefficient or the Mann–Whitney test for median comparison, respectively. To evaluate the relationship between continuity of care as measures using the four different scales (and the composite measure) and the outcome costs, death, and hospitalization, multivariate regression analyses were performed with death/hospitalization in the months 19–30 as outcome variables and the continuity scores as measured in the months 6–18 after incidence and age, sex, number of household members, language region, urbanity, height of annual deductible, health plan, number of chronic conditions, and reason for leaving health insurance as independent variables. For multivariate analyses, quartiles of scores were calculated and a dichotomous variable (person with continuity score value in highest quartile) was built and included in multivariable models. These analyses were done in a subset of patients with incidence in 2014 or 2015 so that we were able to observe 30-month follow-up after incidence. Patient characteristics were assessed at the time of incidence. For costs, linear regression analyses were done accordingly. To avoid collinearity, for each score (N=5) and for each outcome (N=3), a separate model was calculated. This resulted in a total of 60 regression models. Four different versions of scores were calculated for consultations with GPs, with ambulatory hospital wards, for specialist, and for all consultations irrespective of the type of healthcare provider. Analyses were done for all four score versions. From step 2 onwards we only included persons with incident use of antineoplastics in 2014 or 2015 so that we were able to observe the follow-up period. Statistical significance was determined at the 0.05 level. All analyses were done using the statistical program “R”.
Results
Description of the Study Population
A total of 23,515 persons were included in the analytic study sample. They had a median age of 70 years. About half of them were male and were enrolled in the standard insurance model. The majority chose a low annual deductible and suffered from two or more chronic comorbidities. Persons came from all parts of Switzerland with the majority being from the German-speaking part and from rural areas (Table 1). Health service utilization was high with an annual median of seven consultations with GPs, eight with specialists, and eight with ambulatory hospital wards. Of the total study population, 12ʹ169 persons had incident use of antineoplastics in 2014 or 2015.
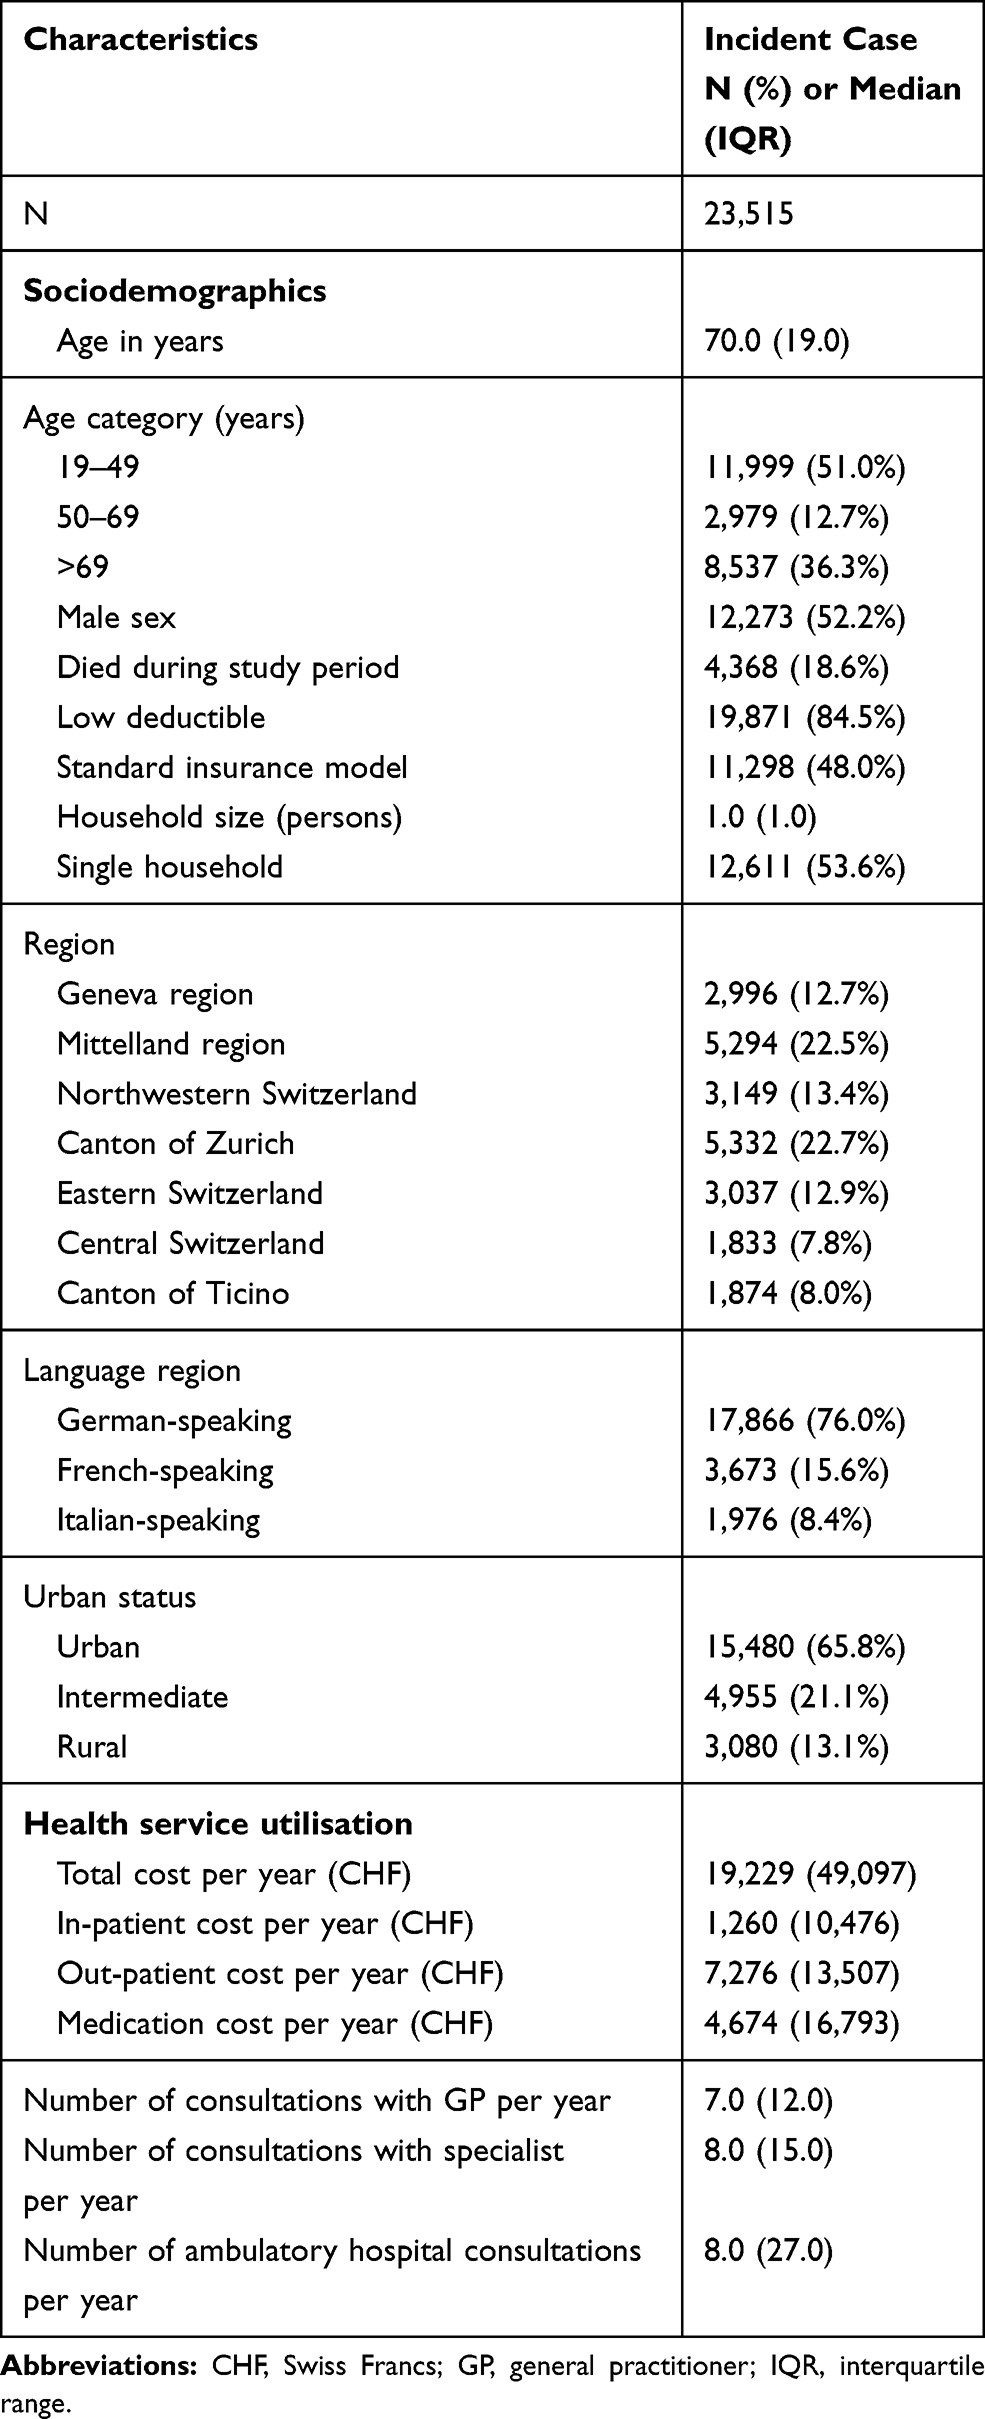 |
Table 1 Characteristics of the Study Population |
Distribution of Consultations Over Time
We plotted the number of consultations per patient over time (Figure 1) and observed that in the first 6 months after incident treatment with antineoplastics, patients had very intensive contacts with ambulatory hospital wards and specialists. The number of consultations with GP was relatively stable with about 0.15 consultations per week over the complete observation period. We therefore decided to focus on the period between 6 and 18 months after incidence for calculation of continuity scores as the incident treatment phase with antineoplastics is not representative for the long-term care phase of cancer patients.
 |
Figure 1 Distribution of consultations over time. |
Description of Scores
Continuity scores differed depending on the type of score used for calculation. MMCI score values were consistently higher than the other three scores and close to the maximum value of 1 indicating low discrimination in a population of patients with high service utilization. Continuity scores differed also markedly depending on whether we distinguished the type of healthcare provider. When focusing on consultations with GPs only, all four scores consistently showed high values indicating high levels of continuity. For both, consultations with specialists and ambulatory hospital consultations, the COC as opposed to the other three scales indicated lower values (Table 2).
 |
Table 2 Description of Continuity Scores (6–18 Months After Index Date) |
Median Score Values by Patient Characteristics
Table 3 depicts the correlation between patient characteristics and continuity score values. Interestingly, the scores correlate differently with sociodemographics, health insurance variables, and regional factors. And these correlations vary according to the type of healthcare provider. When focusing on consultations with GPs, we do not detect relevant differences in correlations between patient characteristics and continuity score values. This is different for scores calculated for specialist visits only and for ambulatory hospital consultations only. For example, continuity of care with specialists seems to be associated with participation in a managed care health plan with continuity scores being higher in the managed care population as compared to the standard care model population. The scores also seem to be sensitive to cultural and regional differences.
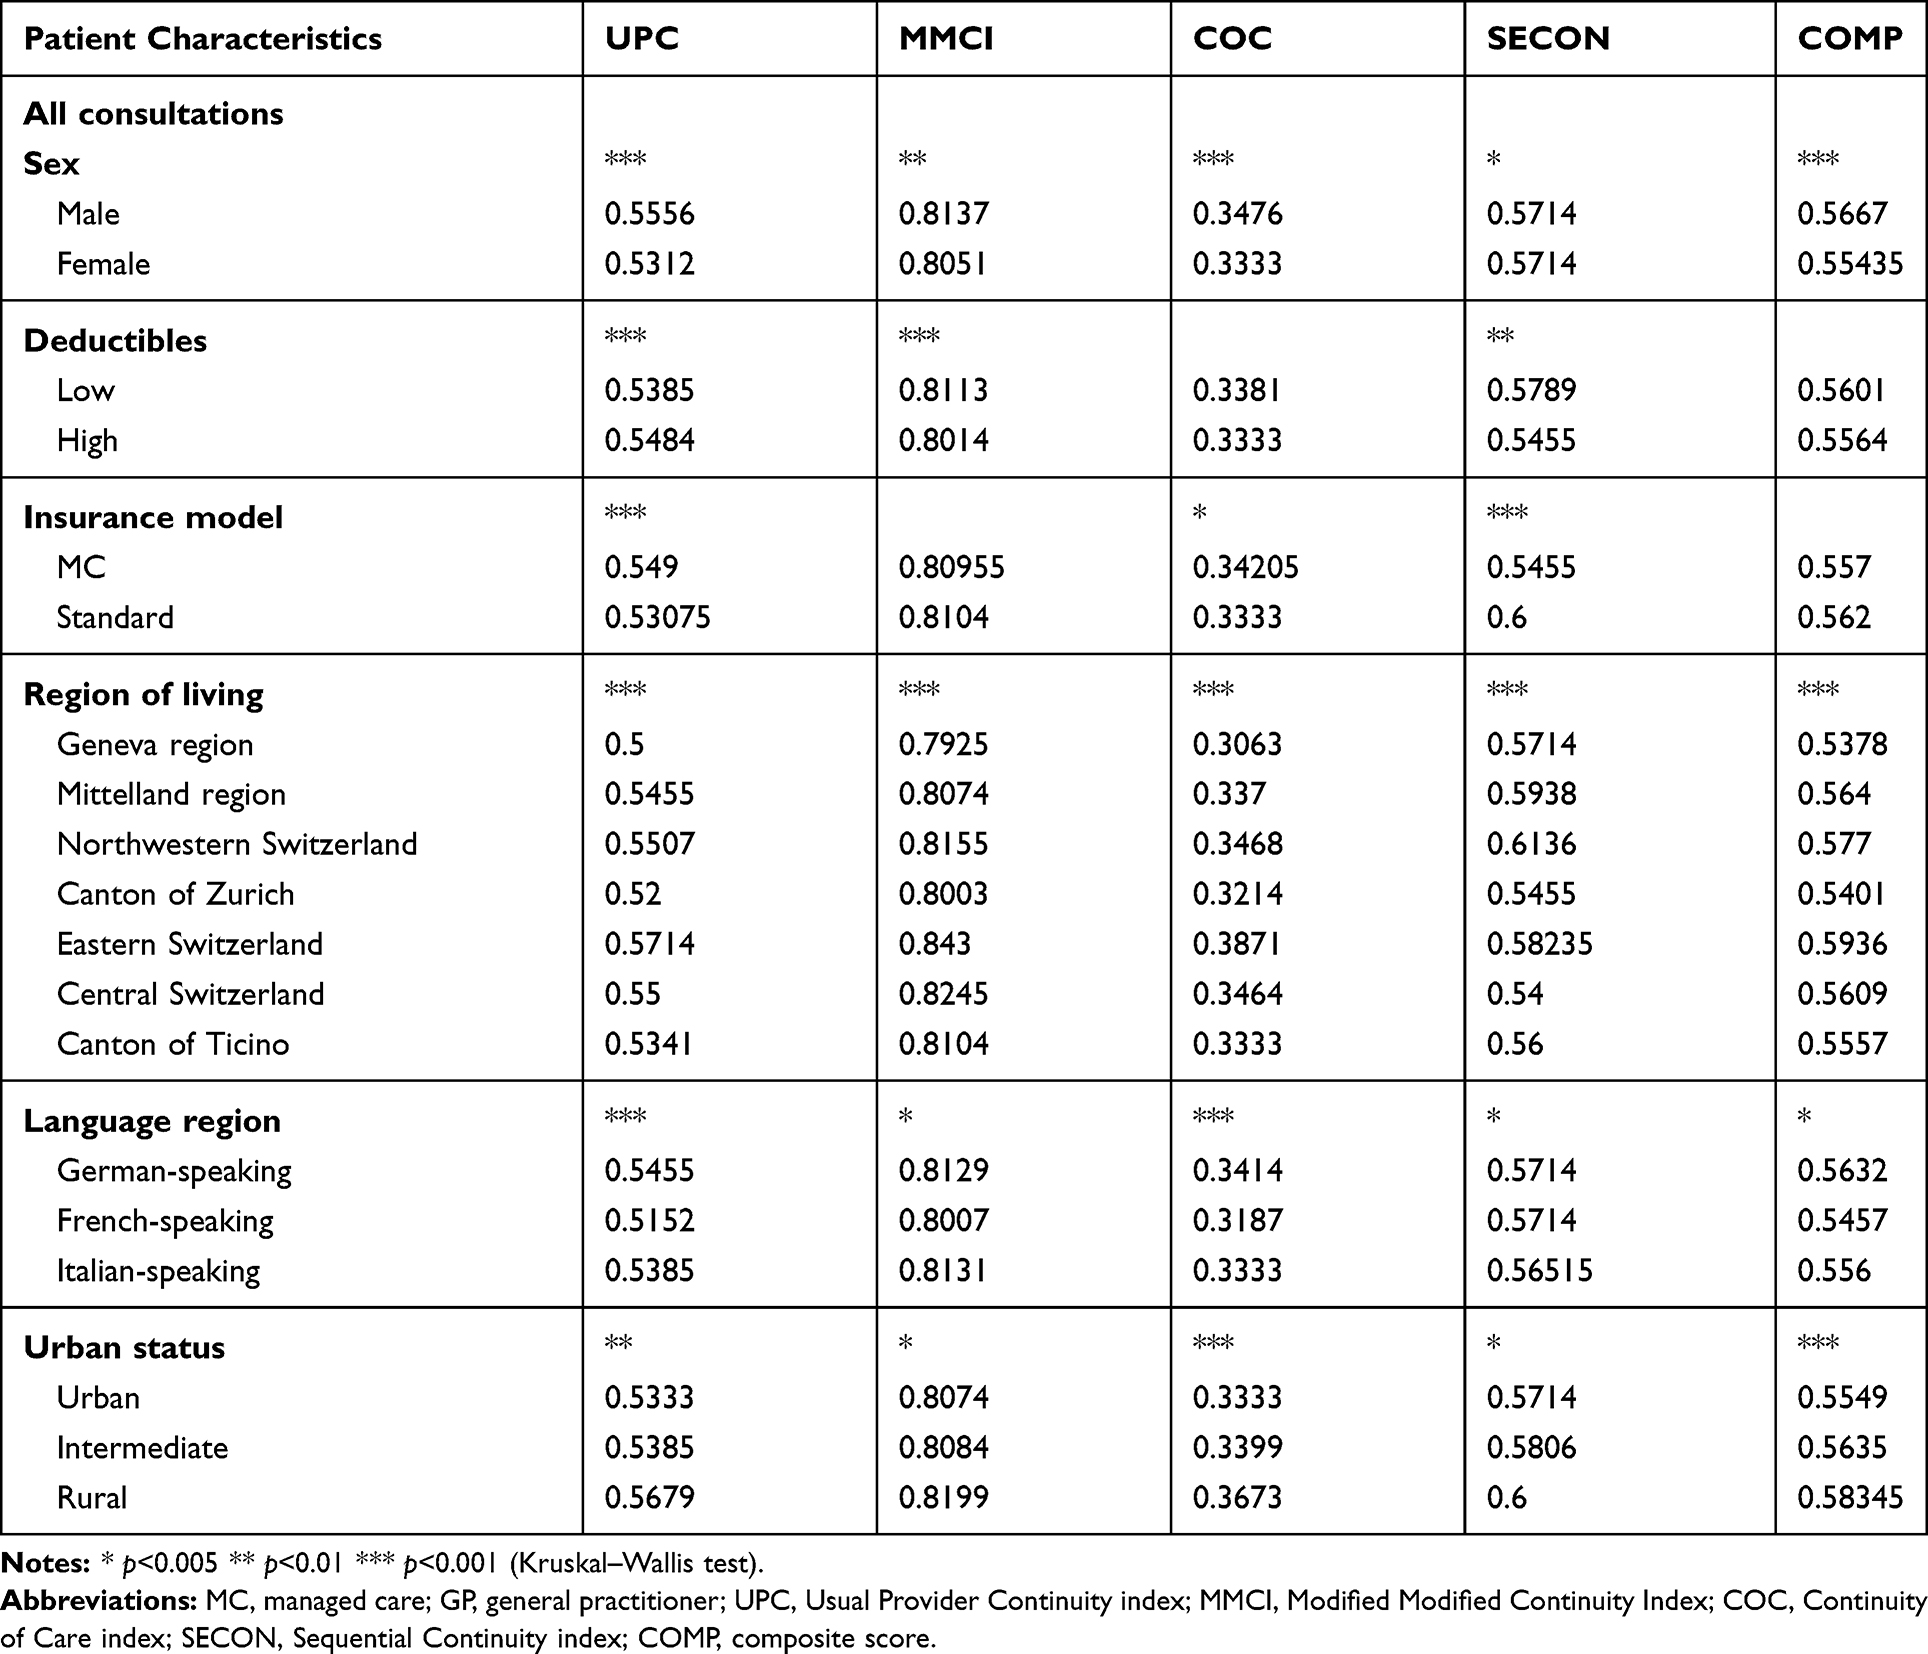 |
Table 3 Median Score Values Calculated in the Basis of Consultations with All Groups of Service Providers by Dichotomous Patient Characteristics |
Table 4 depicts the correlation of health service utilization parameters and score values. The number of consultations with specialists was consistently negatively associated with continuity of care. There was also a consistent negative correlation between the total number of different healthcare providers and continuity of care. The picture was not consistent for consultations with GPs and consultations with ambulatory hospital wards.
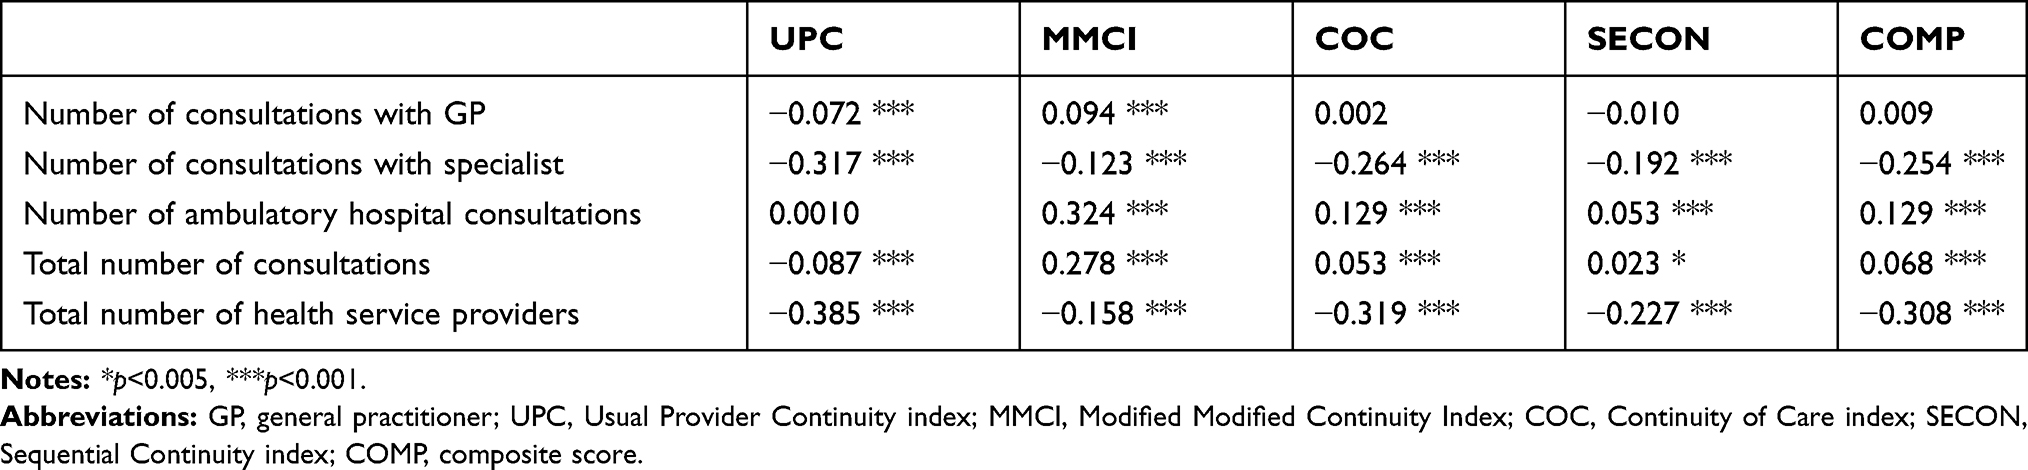 |
Table 4 Correlation Between Health Service Utilization Parameters and Continuity Scores |
Association Between Scores and Outcomes
Multivariate regression analyses revealed that the association between outcomes and continuity scores depended on the type of healthcare provider (Table 5). There was a consistent pattern of beneficial effects of continuity related to GP consultations across the different scales of continuity with respect to costs, death and hospitalization with the effect estimates for costs and death being statistically significant. There was an inconsistent pattern across the different scales of continuity with respect to effect estimates and statistical significance for consultations with specialists with effect estimates both in the negative and positive direction. For ambulatory hospital wards, high levels of continuity of UPC, MMCI, and SECON were associated with reduced costs and increased risk of death and hospitalization. When the type of healthcare provider was not differentiated, high continuity score values were associated with unwarranted outcomes (higher costs, higher risk of death and hospitalization) (details of regression models are available upon request).
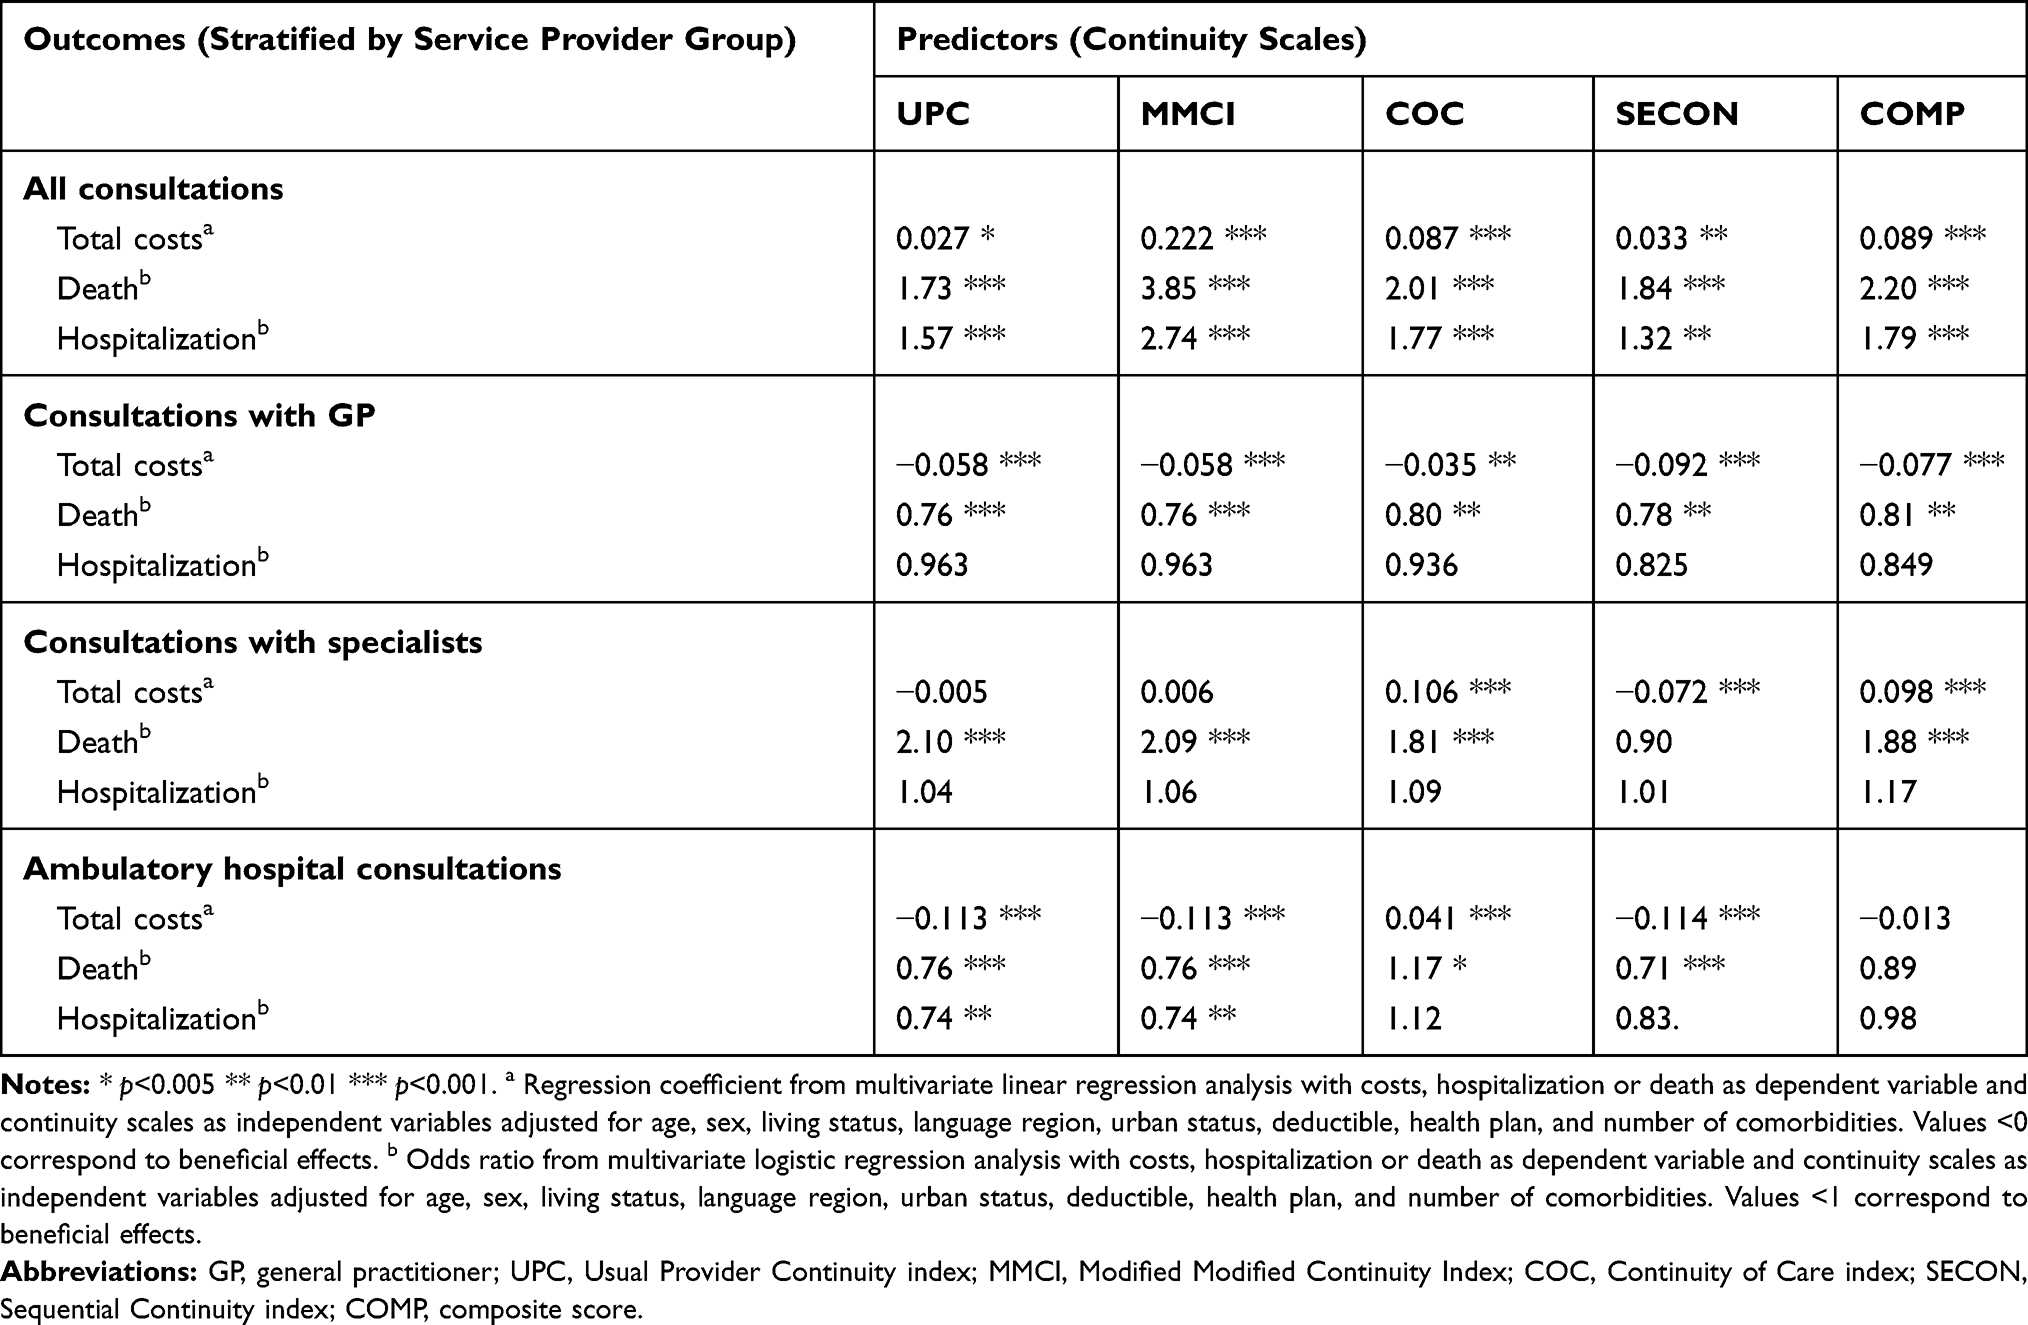 |
Table 5 Effect Estimates of 60 Different Multivariate Regression Analyses Evaluating the Association Between Four Different Score Values (Months 6–18) and Three Different Outcomes (Months 19–30) |
Discussion
This is the first study giving insight into continuity of care in Swiss cancer patients. It indicates that continuity with general practitioners is beneficial in terms of survival, hospitalization and costs. The present study shows that a certain dimension of continuity of care is measurable using data from basic mandatory health insurance. It explores the level of continuity of care in Swiss cancer patients and reveals that continuity of care is generally high. However, continuity of care seems to depend on sociodemographic and regional factors which may indicate unwarranted variation.
The present study contributes to the methods of measuring continuity of care. As this study used claims data from Swiss basic mandatory health insurance, it was possible to distinguish between consultations with GPs, with specialists and with ambulatory hospital wards. Our study reveals that this distinction is crucial. Multivariate analyses clearly indicate that undifferentiated score values mask beneficial effects and distort the pattern of consultations. To our knowledge, previous studies evaluating continuity of care based on claims data did not consider this differentiation. Based on our results, we clearly recommend stratifying score calculation by healthcare provider.
There are different limitations that need to be considered. First, the present study investigates the general population of cancer patients in Switzerland from the system perspective of basic mandatory health insurance. Therefore, it does not include costs of other parties such as supplementary private insurance, private households, and cantons. However, information relating to consultations and hospitalization is very likely to be complete as it is unlikely that patients did not send in invoices of services that are included in the reimbursement package of mandatory insurance. Secondly, due to the structure of health insurance claims data, we were not able to discriminate between different levels of severity, stage, or therapeutic regimen. Thirdly, the present study does not assess the appropriateness of care on the individual level. For example, care might be measured to be continuous when in fact it would be better that the patient saw several physicians. In contrast, continuity scales might indicate non-continuous care when in fact this was the most appropriate care for the individual patient. In addition, data from a single health insurance were used. However, this insurance covers 1.2 million Swiss residents (about one-sixth of the total Swiss population) and includes persons from all sociodemographic and clinical subgroups, so that we assume the data are largely representative for Switzerland. The results, however, cannot be transferred to other healthcare settings without caution.
This study clearly shows that scores differently respond to patient-level characteristics that are closely linked with cultural or regional factors such as density of healthcare providers, proximity to central hospitals, or different practices of healthcare providers. This has important implications for the use of continuity scores. They may be helpful for monitoring trends over time in specific settings, health plans or patient populations or they may help to detect regional variation. However, for interpretations of differences in continuity of care levels across settings or regions’ differences in health system and patient behavior and preferences should be taken into account.
The results of our study have implications for future research. Future studies are needed to investigate the role of hospitalizations for continuity of care, and should explore, if and how hospitalizations should be considered in score calculation. Moreover, additional aspects of validity and reliability of the scales should be investigated. Additionally, it would be relevant to explore the role of cultural and supply factors for continuity of care. Moreover, it is likely that patient subgroups differ in terms of their level and need for continuity. Therefore, future studies should evaluate these scores in other patient populations.
Conclusions
Continuity of care in cancer patients is measurable using health insurance claims data. The existing measurement instruments need to be refined, but they provide a high potential for comparison of cancer care of different patient subgroups, of care settings, of care models, and regions. They may be especially helpful for evaluation and monitoring of quality improvement measures and for evaluation of the impact of health policy decisions on the quality of care in cancer patients.
Abbreviations
CHF, Swiss Francs; UPC, Usual Provider Continuity; COC, Continuity of Care index; SECON, Sequential Continuity Index; GP, general practitioner; SD, standard deviation.
Data Sharing Statement
The dataset analyzed during the current study is not publicly available because it is part of the confidential Helsana health insurance claims database. Additional information not included in the paper is available from the corresponding author on reasonable request.
Ethics Approval and Informed Consent
The present study is based on pre-existing, de-identified and anonymized data. According to Swiss law, it is therefore exempted from ethical approval and informed consent.
Acknowledgments
This study was funded by a grant of the Swiss Cancer Research Foundation (grant number HSR-4083-11-2016). Preliminary results of this study were presented at the European Health Economics Association (EuHEA) conference, in July 2018 at Maastricht, the Netherlands.
Author Contributions
EB and MS drafted the first study concept. MN had the lead in analyzing the data. EB drafted the first version of the paper. All authors made substantial contributions to conception and design, acquisition of data, or analysis and interpretation of data; took part in drafting the article or revising it critically for important intellectual content; agreed to submit to the current journal; gave final approval of the version to be published; and agree to be accountable for all aspects of the work.
Disclosure
Eva Blozik, Caroline Bähler, and Markus Näpflin are employees of Helsana Group. Dr Eva Blozik reports grants from Swiss Cancer Research Foundation, during the conduct of the study; grants from Novartis Pharma, Amgen Switzerland, MSD Switzerland, Vifor Pharma, and Swiss Cancer Research Foundation, outside the submitted work. Mr Markus Näpflin reports grants from Novartis Pharma Switzerland, MSD, Amgen, and Vifor, outside the submitted work. The authors report no other conflicts of interest in this work.
References
1. Topalbertadoctors.org (2017). Evidence-summary: the benefits of relational continuity in primary care. Available from: http://www.topalbertadoctors.org/file/top–evidence-summary–value-of-continuity.pdf.
2. DuGoff EH, Bandeen-Roche K, Anderson GF. Relationship between continuity of care and adverse outcomes varies by number of chronic conditions among older adults with diabetes. J Comorbidity. 2016;6(2):65–72.
3. Spinks T, Albright HW, Feeley TW, et al. Ensuring quality cancer care: a follow-up review of the Institute of Medicine’s 10 recommendations for improving the quality of cancer care in America. Cancer. 2012;118(10):2571–2582. doi:10.1002/cncr.26536
4. Ludt S, Urban E, Eckardt J, et al. Evaluating the quality of colorectal cancer care across the interface of healthcare sectors. PLoS One. 2013;8(5):e60947. doi:10.1371/journal.pone.0060947
5. Coleman EA, Berenson RA. Lost in transition: challenges and opportunities for improving the quality of transitional care. Ann Intern Med. 2004;141(7):533–536. doi:10.7326/0003-4819-141-7-200410050-00009
6. Earle CC. Failing to plan is planning to fail: improving the quality of care with survivorship care plans. J Clin Oncol. 2006;24(32):5112–5116. doi:10.1200/JCO.2006.06.5284
7. Nekhlyudov L, Wenger N. Institute of medicine recommendations for improving the quality of cancer care: what do they mean for the general internist? J General Int Med. 2014;29(10):1404–1409.
8. Jee SH, Cabana MD. Indices for continuity of care: a systematic review of the literature. Med Care Res Rev. 2006;63(2):158–188. doi:10.1177/1077558705285294
9. Bentler SE, Morgan RO, Virnig BA, Wolinsky FD. Do claims-based continuity of care measures reflect the patient perspective? Med Care Res Rev. 2014;71(2):156–173.
10. Saultz JW. Defining and measuring interpersonal continuity of care. Ann Fam Med. 2003;1(3):134–143. doi:10.1370/afm.23
11. Rodriguez HP, Marshall RE, Rogers WH, Safran DG. Primary care physician visit continuity: a comparison of patient-reported and administratively derived measures. J Gen Intern Med. 2008;23(9):1499–14502. doi:10.1007/s11606-008-0692-z
12. Swiss Federal Office of Public Health. 2019. Health insurance. Available from: https://www.bag.admin.ch/bag/en/home/versicherungen/krankenversicherung.html
13. Swiss Federal Statistical Office (2019). Räumliche Gliederung. Available from: https://www.bfs.admin.ch/bfs/de/home/statistiken/querschnittsthemen/raeumliche-analysen/raeumliche-gliederungen/raeumliche-typologien.html.
14. Tousignant P, Diop M, Fournier M, et al. Validation of 2 new measures of continuity of care based on year-to-year follow-up with known providers of health care. Ann Fam Med. 2014;12(6):559–567. doi:10.1370/afm.1692
15. Dreiher J, Comaneshter DS, Rosenbluth Y, Battat E, Bitterman H, Cohen AD. The association between continuity of care in the community and health outcomes: a population-based study. Isr J Health Policy Res. 2012;1(1):21. doi:10.1186/2045-4015-1-21
16. Salisbury C, Sampson F, Ridd M, Montgomery AA. How should continuity of care in primary health care be assessed? Br J General Pract. 2009;59(561):e134–41.
17. Barker I, Steventon A, Deeny SR. Association between continuity of care in general practice and hospital admissions for ambulatory care sensitive conditions: cross sectional study of routinely collected, person level data. Br Med J. 2017;356:j84. doi:10.1136/bmj.j84
18. Magill MK, Senf J. A new method for measuring continuity of care in family practice residencies. J Fam Pract. 1987;24(2):165–168.
19. Cabana MD, Jee SH. Does continuity of care improve patient outcomes? J Fam Pract. 2004;53(12):974–980.
20. Bice TW, Boxerman SB. A quantitative measure of continuity of care. Med Care. 1977;15(4):347–349. doi:10.1097/00005650-197704000-00010
 © 2020 The Author(s). This work is published and licensed by Dove Medical Press Limited. The
full terms of this license are available at https://www.dovepress.com/terms
and incorporate the Creative Commons Attribution
- Non Commercial (unported, 3.0) License.
By accessing the work you hereby accept the Terms. Non-commercial uses of the work are permitted
without any further permission from Dove Medical Press Limited, provided the work is properly
attributed. For permission for commercial use of this work, please see paragraphs 4.2 and 5 of our Terms.
© 2020 The Author(s). This work is published and licensed by Dove Medical Press Limited. The
full terms of this license are available at https://www.dovepress.com/terms
and incorporate the Creative Commons Attribution
- Non Commercial (unported, 3.0) License.
By accessing the work you hereby accept the Terms. Non-commercial uses of the work are permitted
without any further permission from Dove Medical Press Limited, provided the work is properly
attributed. For permission for commercial use of this work, please see paragraphs 4.2 and 5 of our Terms.