Back to Journals » Risk Management and Healthcare Policy » Volume 14
Consumption of Calcium and Knowledge About Calcium Sources and Nutrition Labels Among Lower Secondary School Students in Thailand
Authors Jaisaard R, Kanjanarach T ![]() , Chanaboon S, Ban B
, Chanaboon S, Ban B ![]()
Received 5 May 2021
Accepted for publication 20 August 2021
Published 14 September 2021 Volume 2021:14 Pages 3829—3840
DOI https://doi.org/10.2147/RMHP.S312264
Checked for plagiarism Yes
Review by Single anonymous peer review
Peer reviewer comments 3
Editor who approved publication: Prof. Dr. Mihajlo Jakovljevic
Raksaworn Jaisaard,1 Tipaporn Kanjanarach,2 Sutin Chanaboon,3 Borey Ban4
1Pharmacy and Health System Graduate Program, Faculty of Pharmaceutical Sciences, Khon Kaen University, Khon Kaen, 40002, Thailand; 2Department of Social and Administrative Pharmacy and Center for Research and Development of Herbal Health Product, Faculty of Pharmaceutical Sciences, Khon Kaen University, Khon Kaen, 40002, Thailand; 3Department of Community Health, Sirindhorn College of Public Health Khon Kaen, Khon Kaen, 40000, Thailand; 4Technical School for Medical Care, University of Health Sciences, Phnom Penh, Cambodia
Correspondence: Tipaporn Kanjanarach
Department of Social and Administrative Pharmacy and Center for Research and Development of Herbal Health Product, Faculty of Pharmaceutical Sciences, Khon Kaen University, 123 Moo 16, Mittraphap Road, Nai Mueang Subdistrict, Mueang District, Khon Kaen, 40002, Thailand
Tel +66 81 739 2822
Fax +66 043 202 379
Email [email protected]
Borey Ban
Technical School for Medical Care, University of Health Sciences, Phnom Penh, Cambodia
Tel +855 17 436 496
Email [email protected]
Objective: A three study research program was conducted to identify high calcium products available in the market (study I), identify high calcium products that were known or consumed by lower secondary school students in the last three months (study II), and identify the amount and sources of calcium that students had consumed in the prior 24 hours, their knowledge about sources of high calcium and how to interpret calcium information on nutrition labels of food packages (study III).
Methods: In study I, a cross-sectional market survey was employed. In studies II and III, a school-based cross-sectional survey was employed. The survey population was students enrolled in grades 7– 9 (11– 14 years old) in a medium-sized lower secondary school in semi-urban Khon Kaen, Thailand. A total of 309 students were invited, with 168 and 209 students participating in studies II and III, respectively. Data were collected with self-administered questionnaires.
Results: Ninety-three high calcium products were identified. Only 49 were known or consumed by students in the last three months. The median amount of calcium consumed in the previous 24 hours was 410 mg (IQR: 160, 983). Only 31.1% of students (65/209) consumed more than the Thai recommended daily intake (TRDI) of calcium (800mg) in the previous 24 hours. Their main source of calcium was milk. Other high calcium items that were consumed were malt drink, minnow, canned fish, calcium fortified soy milk and Chinese kale. The overall average knowledge score was 6.5± 2.4 out of a maximum of 17. The average knowledge scores for high calcium food sources and for interpreting the calcium information on a sample nutrition label were 4.6+1.8 (out of 12), and 1.9± 1.2 (out of 5), respectively.
Discussion: Students should be introduced to high calcium products in their community such as hard tofu, minnow, and small freshwater shrimp. Educational programs on nutrition label interpretation are needed.
Keywords: calcium intake, adolescent, calcium-rich food, calcium knowledge, source of calcium, nutrition fact
Introduction
Adequate calcium intake is required for bone strengthening and osteoporosis prevention.1–4 The body needs sufficient calcium at all ages, but particularly in early adolescence5,6 as calcium intake plays a significant role in bone mineral accretion during rapid bone development at this age. Achieving optimal peak bone mass, ie maximum calcium deposition, in early adulthood then helps delay bone loss later in life.5,6 Nevertheless, research findings show that calcium deficiency in early adolescents is one of the most commonly reported micronutrient deficiencies worldwide,7–11 including Thailand.12 The ages 10 through 14 years are often referred to as early adolescence.13 In the Thai schooling system, students in lower secondary school (grades 7–9) fall into this age range.14 One of the major changes when students move up from primary school (grades 1–6) to lower secondary school is that they are no longer provided with free school lunch and free milk. They and their family need to plan their own meals to obtain sufficient amounts of nutrients including calcium.
The Thai recommended daily intake (TRDI) of calcium is 800 mg.15 Previous studies conducted over a 17-year time period found that lower secondary school students consume approximately one third of the TRDI of calcium16–18 indicating that insufficient consumption of calcium has long been a problem in this population group. In addition, it was learned from those previous studies that promotion of dietary calcium was focused on dairy products, particularly milk, as the calcium source even though calcium is found in several other food sources such as boned animals and dark green vegetables. Four studies that explored other dietary sources of calcium suggested that lower secondary school students would be unlikely to achieve the TRDI of calcium if they do not include high calcium products in their meal plan.16–19
High calcium products are defined as having ≥15% of the TRDI per 100 ml for liquid or ≥ 30% of the TRDI per 100 g for solid products.15 Although there are several high calcium foods available in Thai markets, it is not known whether lower secondary school students know about or consume these products. Estimation of the quantity of micronutrients, including calcium, contained in food requires knowledge and skill. For foods which do not provide micronutrient information, consumers must memorize the amount of calcium per serve and the quantity per serve of each food. For foods having micronutrient information on the packages, consumers can plan their calcium consumption based on this information provided they can interpret the information correctly.
Thailand introduced the Nutrition Information Panel (NIP) for food in 1998. The presentation of the information box is similar to the US nutrition label. According to the food nutrition labelling regulations in Thailand, the full format nutrition label must show the calories per serve, quantity and percent TRDI for seven macronutrients and sodium, and percent TRDI for five micronutrients. However, items that are present in small amounts are allowed to be omitted on the label.15 The TRDI designates 2,000 kcal of total energy daily. The five micronutrients listed on the nutrition label of the food package are vitamin A, vitamin B1, vitamin B2, iron and calcium. The TRDIs of the micronutrients were adopted from the Codex Nutrient Reference Values (NRV) and adjusted to be suitable for healthy Thai people above 6 years old (Thai FDA). It should be noted that the actual amounts of the micronutrients are not required to be shown on the nutrition label. It is widely known that a lack of knowledge about nutritional information limits healthy dietary behaviour. An intensive literature review failed to uncover any reports about whether lower secondary school students know which foods are sources of high calcium, or whether they are able to interpret calcium information on nutrition labels.
Objectives
There were three studies in the research program. The objective of study I was to identify high calcium products available in the market. The objective of study II was to identify high calcium products that were known or consumed by lower secondary school students in the last three months. The objectives of study III were to identify the total amount and the sources of calcium that the lower secondary school students had consumed in the prior 24 hours and ascertain their knowledge about sources of high calcium and how to interpret calcium information on nutrition labels of food packages.
Methods
Khon Kaen province was selected as a study area because it is one of the largest provinces in the northeastern region of Thailand. It is a center of business and education in this region. It is also considered a multicultural city as the population of this province combines local northeasterners and those who moved from other areas to work and study. The lower secondary school selected for this research project was located in a semi-urban area in Khon Kaen province.
The research protocol was approved by the Ethics Committee in Human Research of Khon Kaen University based on the Declaration of Helsinki and the ICH Good Clinical Practice Guidelines (HE 612266). Signed consent was obtained from the participants guardians. In studies II and III, permission to conduct the research was granted by the school principal.
Prior to conducting studies II and III, a pilot test was conducted to identify the parameters needed for sample size estimation and to validate the data collection instruments (questionnaires). Subjects were 30 students enrolled in another lower secondary school in a semi-urban area in Khon Kaen province. Permission to conduct the pilot study was obtained from the school principal.
Throughout this study, “high calcium food” is defined as food containing at least 160 mg calcium per serve. This was based on the amount of calcium per serve in UHT milk, which was the most common source of calcium in previous studies.18 A serve was defined as the quantity of the product for one serve listed on the nutrition label for food in sealed packages with nutrition labels. For fresh food, one serve was 100 grams.
Study I
Design
A cross-sectional market survey was employed to identify high calcium products available in Khon Kaen province. The survey was conducted in September 2018.
Setting and Survey Site Recruitment Procedure
The survey was conducted in markets in Khon Kaen province. Online markets were not included in this survey because lower secondary school students are not eligible to buy products online. Food outlets were classified into four groups according to the type of products they carried: supermarket, franchise convenience store, local grocery store, and fresh market. This was to ensure that the survey captured as many calcium products available in Khon Kaen province as possible. Although supermarkets carried a wide range of products, they did not stock indigenous vegetables and local meat products. These products were found in fresh markets. Some products found in franchise convenience stores were also found in supermarkets however franchise convenience stores also carried their own brand products. Products made of local ingredients or farmers’ products were found in local grocery stores.
In Khon Kaen, there were five brands of supermarkets, four brands of franchise convenience stores, and several local grocery stores and fresh markets. The list of local grocery stores and fresh markets was obtained from the Khon Kaen Municipality. An expert panel was employed to select the food outlets. All three experts were nutritionists who lived in Khon Kaen and shopped in all four types of food outlets. The criteria to select the outlets were the location of the food outlets (near to or within the surveyed school in studies II and III) and the range of products available in each type of food outlet. Based on the panel discussion, the following ten outlets were selected: three brands of supermarkets, two brands of franchise convenience stores, three fresh food markets (one big size, one medium size and one small size), and two local grocery stores.
Instrument and Data Collection Procedure
A record form and a checklist of high calcium fresh products were used to identify high calcium products available in the surveyed food outlets. The record form and the checklist were assessed by the same three experts who selected the surveyed food outlets.
The record form was used to identify high calcium products that were in seal packages with nutrition labels. The record form consisted of (1) the name of the packaged food product, (2) a photo of the package front and back sides, (3) the ingredients listed on the package that were the source of calcium and (4) the percent TRDI of calcium per serve, which was shown on the nutrition label on the food package.
A list of high calcium products was extracted from three references20–22 and used to identify high calcium fresh food in Khon Kaen markets. Information extracted from these three references were the name of the product and the amount of calcium in milligrams per serve (100 grams). For products in which the amount of calcium differed among the references, the average was used.
The researchers visited the selected food outlets and checked every product item. For the sealed products with nutritional labels, the information was written onto the record form if they met the definition of “high calcium food”. For fresh food, the name of the product was checked whether or not it appeared in the high calcium fresh product checklist. Samples of all products that met the definition of high calcium for this study were purchased from the surveyed food outlets. All selected outlets were surveyed two times, one week apart.
Data Management and Analysis
The amount of calcium per serve in the food items that were purchased were independently calculated by two researchers. For packaged food, the amount of calcium was determined from the nutrition labels. For fresh food, or food without nutrition labels, the amount of calcium was estimated from the reference amounts.20–22
The high calcium product items were categorized into five groups: meat and meat products; vegetables; dairy and dairy products; legumes, nuts, and seed products; and calcium supplement tablets.
Study II
Study Design and Setting
A school-based cross-sectional survey was conducted. The selected school was a medium-sized secondary school located in a semi-urban area in Khon Kaen province in the northeastern part of Thailand. This school was purposively selected because its characteristics represented lower secondary schools in semi-urban areas in Khon Kaen Province. The study was conducted in December 2018.
Population, Sample Size and Sampling Technique
The survey population was lower secondary students enrolled in grades 7, 8, and 9. The age range of this population group was 11 to 14 years old. The total number of students was 309. The formula to estimate the proportion in a single finite population22 was used to determine the sample size with the following assumptions: p (proportion of students who knew the high calcium products available in Khon Kaen market was assumed to be 70%, based on the pilot study), d (margin of error = 5%), Zα/2 (standard normal distribution value for 95% confidence level = 1.96) based on this formula, the minimum sample size was 159.
Since the estimated response rate was not known, all 309 students were invited to participate. The first author met with students to explain the research objectives and asked them to pass the permission to participate form (informed consent) to their guardians. Students were asked to return the permission form on the appointment dates for data collection. In total, signed consent was obtained from the guardians of 168 students.
Instrument and Data Collection Procedure
A self-developed questionnaire was used to collect data. The first part was demographic information; sex, current grade enrolled, weight in kilograms, height in centimeters, age in years, and allowance per day in Thai baht (32 Thai baht [THB] is approximately 1 US$). The second part was a checklist of high calcium products known or consumed by the students. Pictures of the 93 high calcium products contained in the checklist were those identified in the high calcium product survey (study I). For each picture, students were asked to identify whether they “don’t know this product”, “know this product”, or “had eaten this product in the last three months”. The quantity consumed was not asked. Prior to administering the questionnaire, the clarity of the language and the pictures of the foods were assessed by five experts who were academics with an educational background in pharmacy or public health. The questionnaire was then pretested in 30 lower secondary school students in another school, which was similar to the surveyed school.
On the appointment dates for data collection, the students whose parents gave permission to participate in the research study were called into the school auditorium. A researcher distributed the self-administered questionnaires to the students, explained how to fill out the questionnaire and asked them to return the questionnaire to the box at the back of the auditorium after completion. All answers in the questionnaire were self-reported.
Data Analysis
Descriptive statistics are used to describe the demographic information of the studied students. Body mass index (BMI) was calculated by dividing the student’s weight in kilograms by the height in meters squared. The BMI values were categorized into four categories: less than 18.5 (underweight), 18.5–22.9 (normal weight), 23.0–24.9 (at risk), and 25.0 or higher (obese).24 For each high calcium item, the responses of “know this product”, or “had eaten this product in the last three months” were summed. The high calcium products that were known or had been consumed by at least 50% of the respondents (84 students) were used in the questionnaire of study III.
Study III
Study Design and Setting
A school-based cross-sectional survey was employed. Study III was conducted in the same school and the same cohort as that of study II. Study III was conducted one month after the completion of study II (January 2019).
Population, Sample Size and Sampling Technique
The survey population was 309 lower secondary students enrolled in grades 7, 8, and 9. The formula to calculate the sample size for a population mean estimation23 was used to determine the number of subjects with the following assumptions:  (the mean amount of calcium consumption in milligrams in 24 hours, which was assumed to be 575 mg, based on the pilot study), SD (standard deviation of the amount of calcium consumption in milligrams in 24 hours, which was 370), d (margin of error = 5% of the mean amount of calcium consumption in milligrams in 24 hours), Zα/2 (standard normal distribution value for 95% confidence level = 1.96). Based on this formula, the minimum sample size was 209.
All 309 students were asked to pass the informed consent to their guardians. Signed consent was obtained from the guardians of 257 students. Simple random sampling technique was used to select 209 of the 257 students.
Instrument and Data Collection Procedure
A self-developed questionnaire was used to collect data. The first part was demographic information II, the second part was about sources of calcium and calcium consumption, and the third part was about calcium knowledge. In the second part, the self-developed high calcium food frequency questionnaire (HCFFQ) was used to collect the sources and total amount of calcium consumed in the previous 24 hours. The HCFFQ was composed of illustrations of high calcium foods that were known or consumed by the respondents in study II. Subjects were asked to tick the foods and fill in the total quantity they had consumed in the previous 24 hours (bottle, pack, piece, or spoonful). In the third part, there were 17 knowledge questions. Twelve questions were about sources of high calcium: four dairy products (milk, malt drink, yogurt, cheese), four meat products (freshwater shrimp, minnow, red tilapia fish, golden apple snail), two vegetables (pak waan leaves, Chinese kale) and two legumes (hard tofu, tofu drink). Of these 12 food items, two items were not high calcium products, ie, red tilapia fish and tofu drink. The 10 high calcium items in this knowledge test were selected from the high calcium items identified in the second survey by an expert panel as suitable for early adolescents. The three experts were all nutritionists. Students were asked to identify which of these items were high calcium products. The remaining five questions were about how to interpret calcium information from nutrition labels on the food packages. A sample nutrition label that read “calcium 30%” was used for this knowledge section. The response options were “Yes”, “No” and ‘Don’t know’. The last option was provided to minimize information bias due to students’ guessing answers. The questionnaire was assessed for the clarity of the language by the same five experts who assessed the questionnaire of study II and was pretested in the same group of 30 lower secondary school students who pretested the questionnaire of study II.
The data collection procedure employed in study III was the same as that in study II.
Data Analysis
Descriptive statistics are used to describe the demographic information of the studied students. The amount of calcium consumption per day was calculated by multiplying the number of serves of calcium-rich food that the students had consumed in the previous 24 hours with the quantity of calcium in the food.20–22 The total amount of calcium consumed is presented as the median, minimum and maximum, and interquartile range. Distribution of the sources of calcium is presented with frequency and percent. Mean and standard deviation (SD) are used to present the calcium knowledge scores. To calculate calcium knowledge scores, each correct answer was given one point with the total maximum score 17.
Results
Characteristics of the Studied Population
In the school-based cross-sectional studies (studies II and III), 168 and 209 lower secondary school students responded to the surveys, respectively. The characteristics of the respondents were consistent among study II and study III and to the whole 309 students of the lower secondary school. The average allowance per day found in study II was slightly lower than that found in study III (49.4 vs 67.7 Thai baht). However, this difference is small and is not considered practically significant. Approximately half of the respondents were underweight (BMI less than 18.5). It should be noted that some of the respondents in study II also participated in study III. The demographic characteristics of the participants in both studies are shown in Table 1.
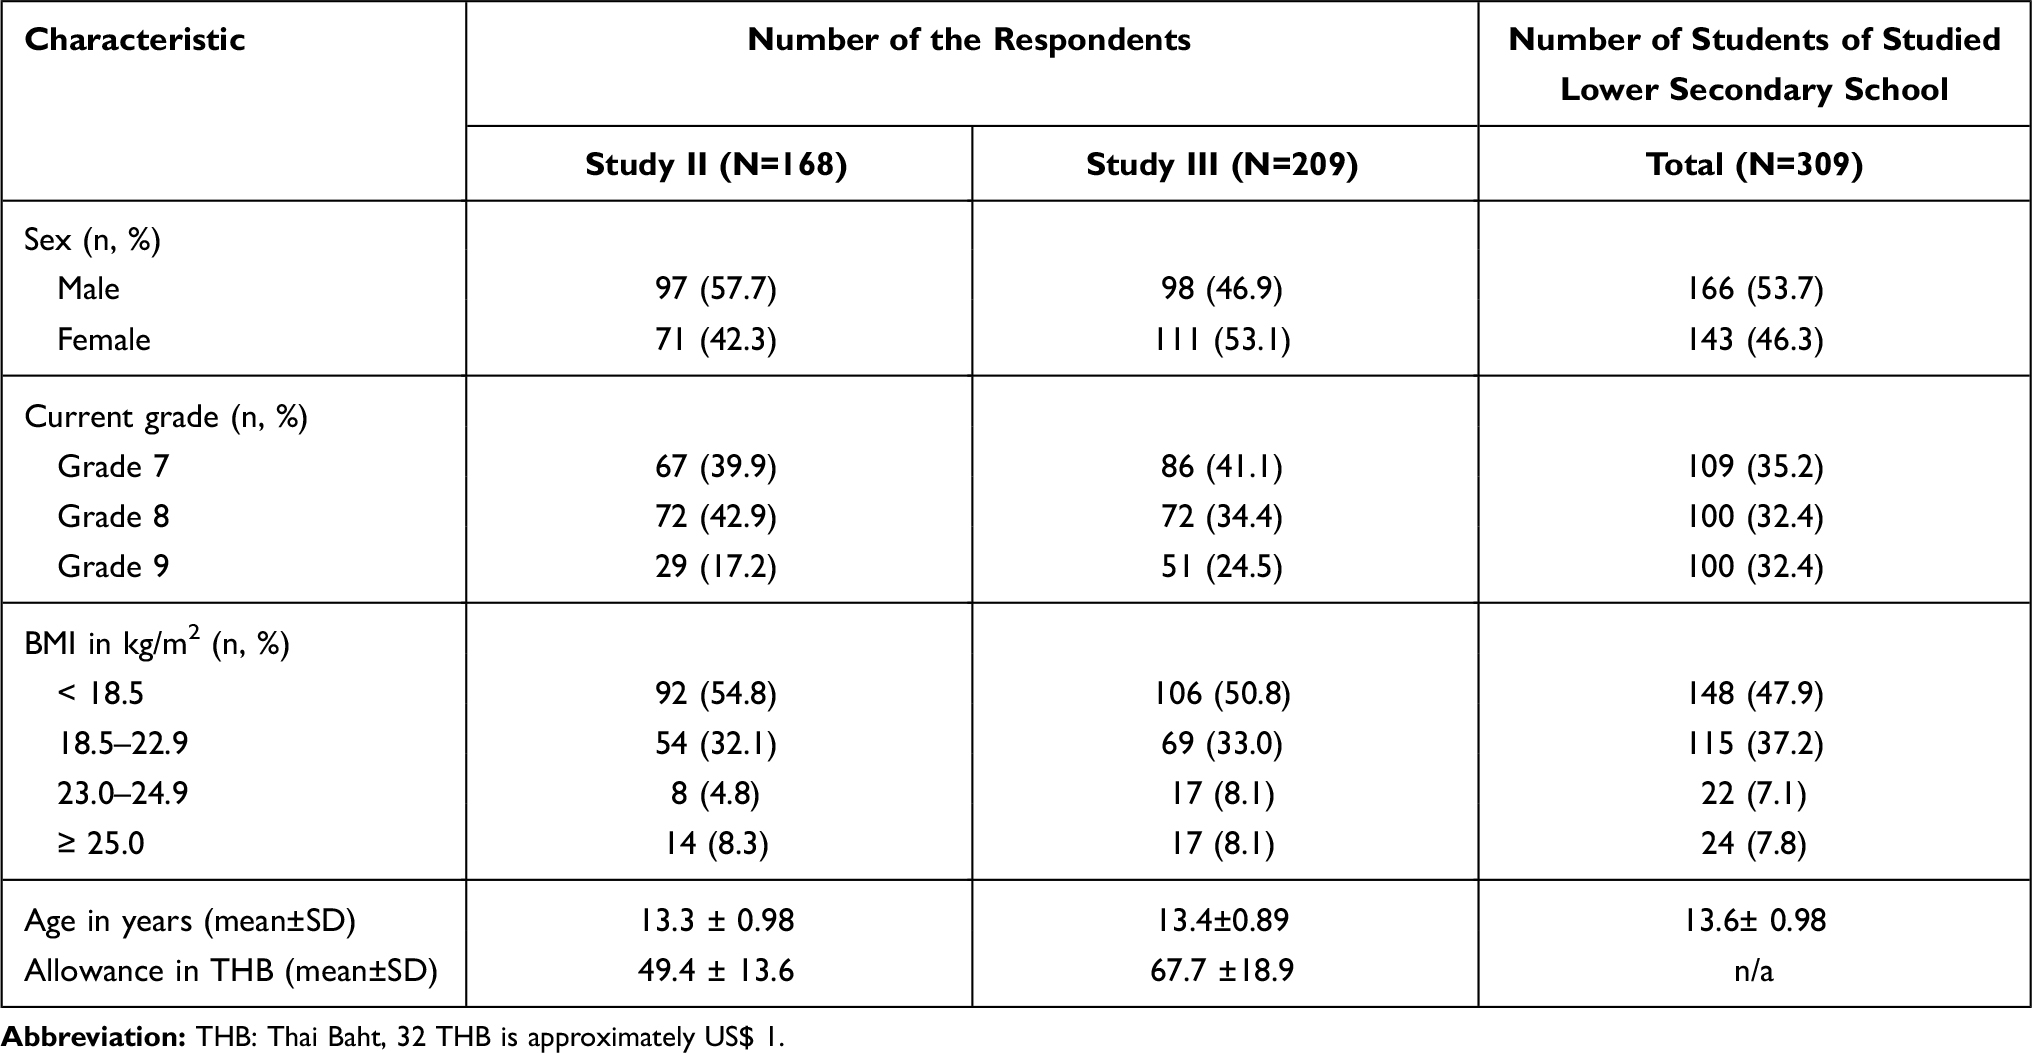 |
Table 1 Characteristics of the Respondents and Students of Studied Lower Secondary School |
High Calcium Products in Khon Kaen Province
In study I, 93 available high calcium foods were identified (Table 2). The majority of the available high calcium products were meat and meat products (including processed foods, foods made from fresh ingredients, and ready to eat foods). In the dairy product group, UHT milk of various brands was found in all surveyed outlets. Lactose free milk, high protein milk, yogurt and cheese were found only in supermarkets and franchise convenience stores.
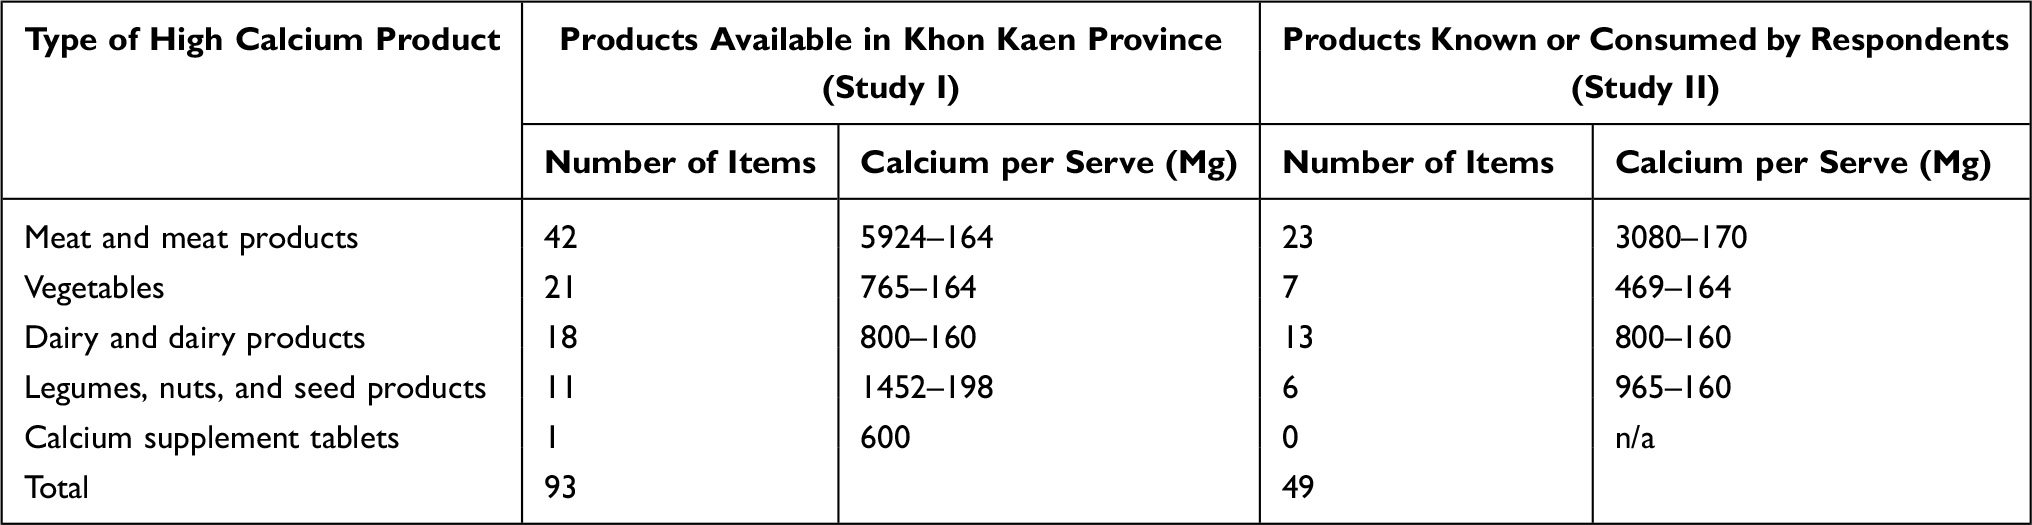 |
Table 2 Sources of Calcium Available to and Known by Respondents |
High Calcium Products Known or Consumed by Lower Secondary School Students
Of the 93 products found in the market survey (study I), 49 were known or consumed by the students who responded to the survey in study II (Table 2). Examples of dairy products having high calcium per serve that were known but had not been consumed by the respondents during the past three months were high calcium milk for pregnant women (quadruple high-calcium milk: 800 mg of calcium in 125 ml), UHT high-calcium milk (480 mg of calcium in 180 ml), lactose free milk, cheeses, and imported yogurt. Examples of dairy products that had been consumed by most respondents during the past three months were UHT milk, pasteurized milk, yogurt, and malt drink. These products contained between 160 and 240 mg of calcium per serve. Examples of meat or meat products having high calcium per 100 g serve that were known but had not been consumed by the respondents during the last three months were ground lizard (3,808 mg),22 frog (3,565 mg)22 and pond snail (1,053),22 Examples of meat or meat products that had been consumed by some respondents during the last three month were edible minnow (3,496 mg),22 small-size freshwater shrimp (806 mg),22 canned fish with soft bone (160–1,040 mg).22 It should be noted that high calcium products contained in a pack such as fried shrimp legs or small crabs were not known and had not been consumed by any respondents. Example of legumes, nuts, seeds and their products having high calcium per serve that were known by the respondents were giant red beans (965 mg per 100 g),22 hard tofu (830 mg per 100 g),22 and calcium fortified UHT soymilk (400 mg of calcium per 300 ml carton). Only the latter two items were reported to be consumed by respondents during the last three months. Among the group of vegetables having high calcium (at least 160 mg of calcium per 100 g of serve) that were known and had been consumed by the respondents were turkey berry (182 mg),22 cork wood flowers (395 mg),22 pak waan (Scientific name: Melientha suavis) (252 mg),22 and Chinese kale (164 mg).22 These vegetables are commonly cooked by blanching or stir-frying and are found in curry or soup. Chinese kale was reported to be consumed by all respondents. The remaining three vegetables that were not known and had not been consumed by the respondents were either not in season (Tangerine leaves: 182 mg),22 had an unpleasant taste (Noni leaves: 469 mg)22 or had pungent smell (Dill: 203 mg).22
Amount of Calcium Consumed and Sources of Calcium
Of the 209 lower secondary school students that responded to the third survey (study III), 62 (29.7%) had consumed an adequate amount of calcium according to the TRDI (≥ 800 mg) in the previous 24 hours. The median calcium intake over the previous 24 hours was 410 mg for the whole group, 1,229 mg for students that consumed an adequate amount of calcium, and 254 mg for students that consumed an inadequate amount of calcium (< 800 mg). The main sources of calcium consumed by students in the previous 24 hours were dairy products and meat products (Table 3). The mean amount of calcium consumed from dairy was much higher for the group that consumed an adequate amount of calcium than for the group that consumed an inadequate amount of calcium (840 mg vs 160 mg). The difference was due to the quantity of milk they consumed. The difference in mean amount of calcium consumed from meat between the two groups was also due to the quantity consumed.
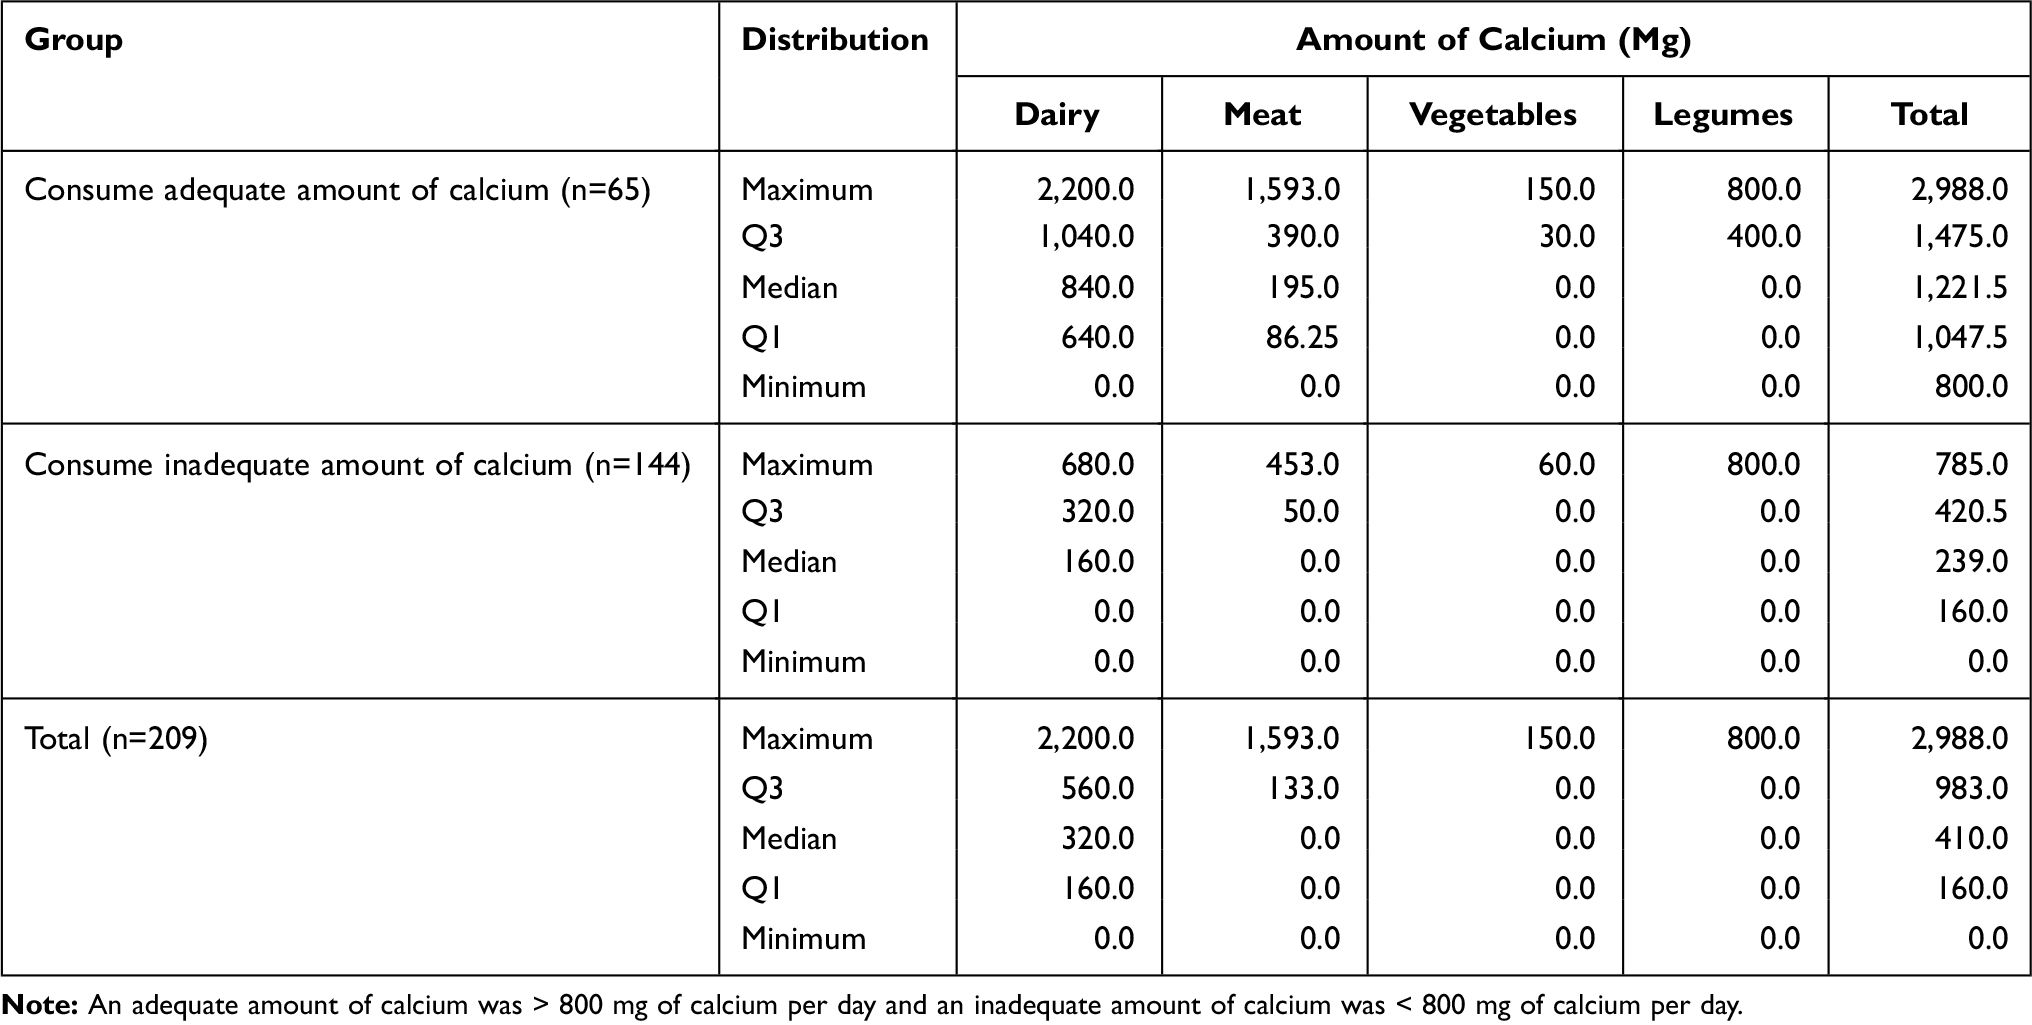 |
Table 3 Amount of Calcium Consumed by the Respondents in Previous 24 Hours (n=209) |
The sources of calcium and the pattern of food consumption in both groups (adequate vs inadequate calcium intake) were similar (Table 4). One hundred and sixty-six respondents reported consumption of dairy products. The top two dairy products reported to be consumed by respondents were UHT milk and malt drink. Less than 20% of the students that consumed dairy products consumed yogurt during the previous 24 hours (29 out of 166). None of the respondents had consumed cheese in the past 24 hours. Ninety-eight respondents reported consumption of high calcium meat and meat products. Canned fish (sardines in tomato sauce) and minnow were reported to be consumed by a majority of respondents (n= 62). Forty-three respondents reported consumption of high calcium vegetables listed in the questionnaire. Almost all of them (n = 39) reported consuming Chinese kale. A few reported consuming turkey berry and pak waan leaves. Thirty-seven respondents reported consumption of products in the legume group. Only calcium fortified UHT soymilk was reported to be consumed in the previous 24 hours.
 |
Table 4 Sources of Calcium Consumed by the Respondents in Previous 24 Hours (n=209) |
Knowledge About Sources of High Calcium and How to Interpret Calcium Information on Nutrition Labels
The overall average knowledge score among 209 respondents (study III) was 6.5±2.4 out of a maximum of 17. The average knowledge scores for food sources that are high in calcium and for interpreting the calcium information on a sample nutrition label were 4.6+1.8 (out of 12), and 1.9±1.2 (out of 5), respectively. Of the five questions about the calcium information on a nutrition label, only the question about the percentage of calcium contained in the sample food could be answered by a majority of the students (Table 5).
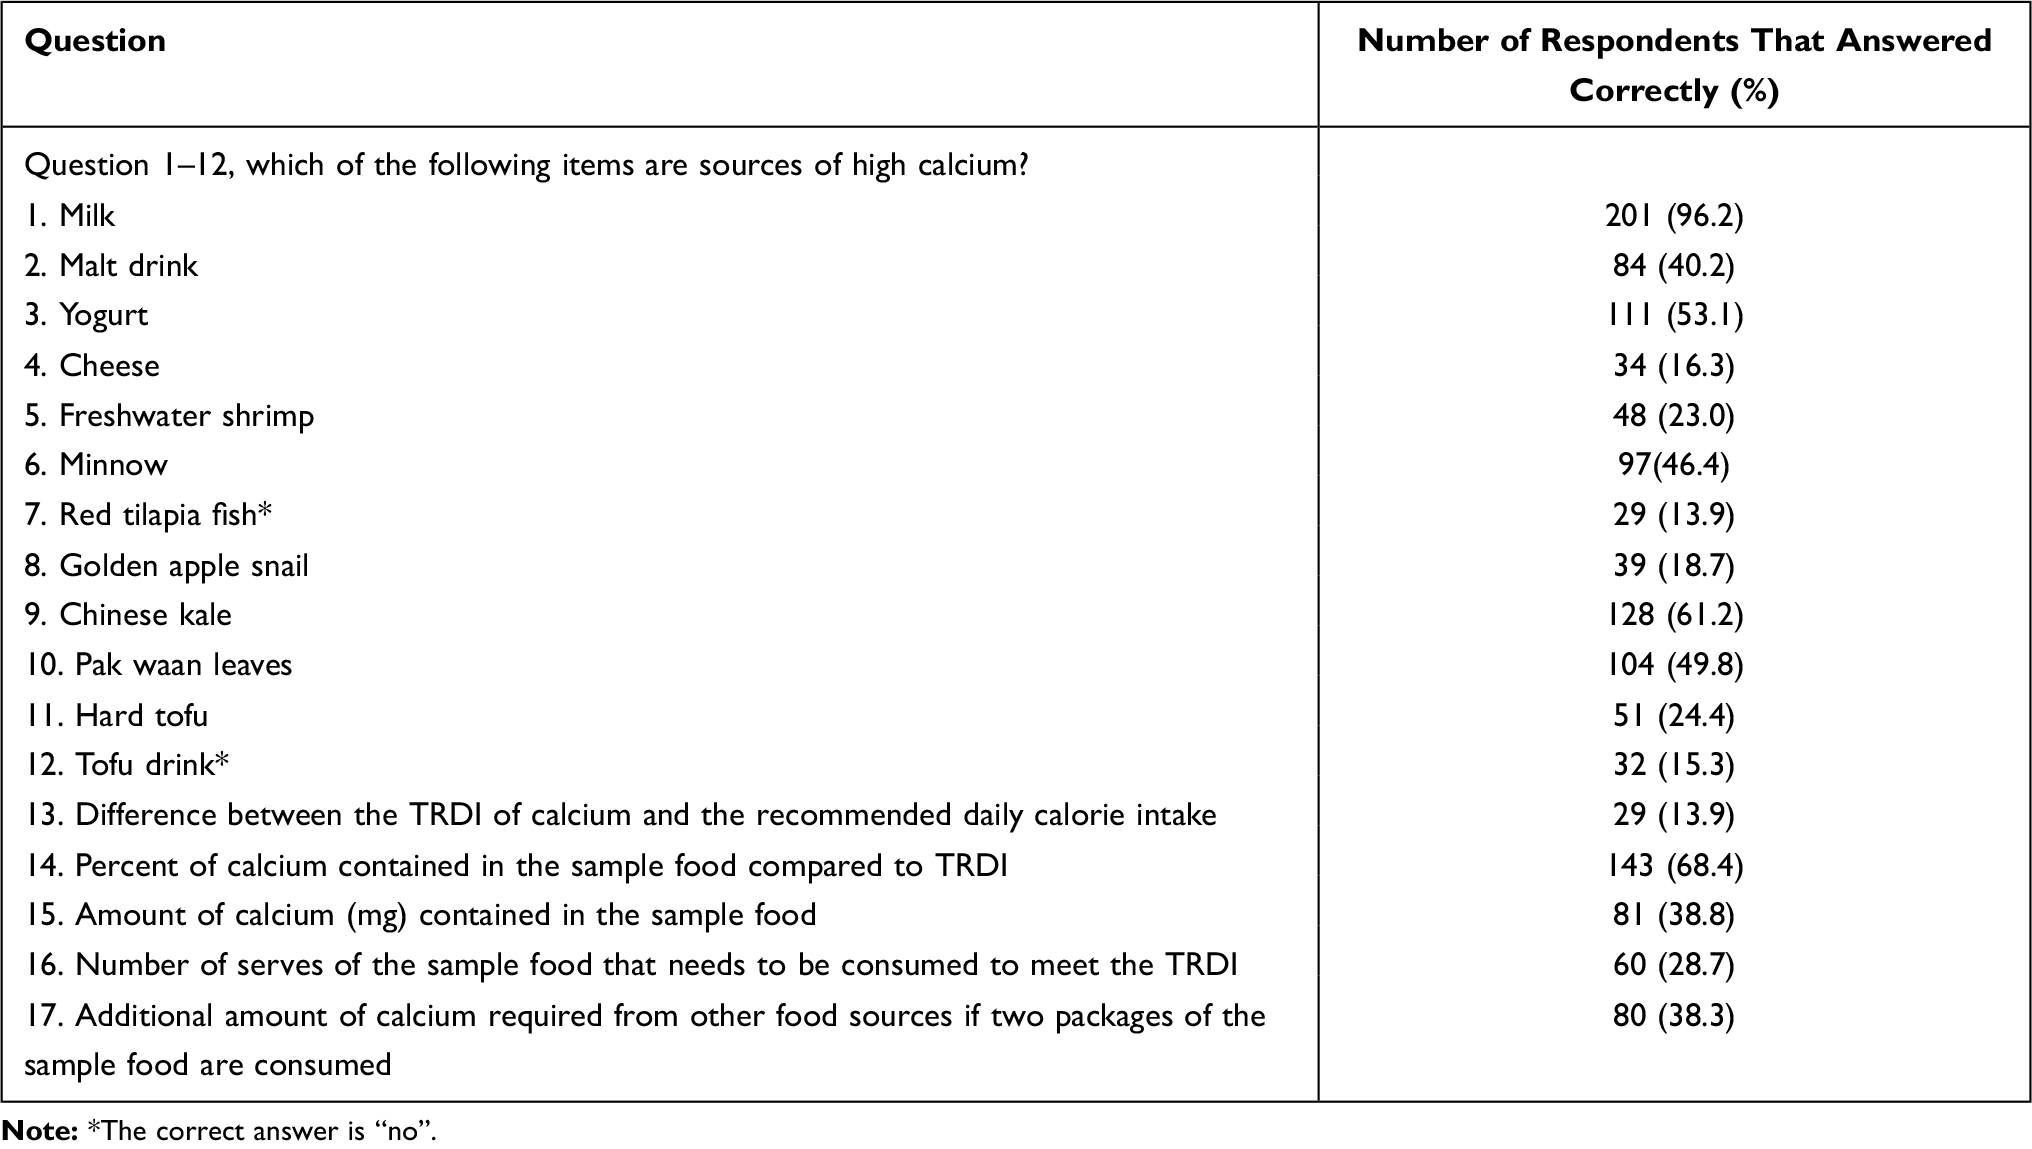 |
Table 5 The Respondents’ Knowledge About Sources of Calcium and Calcium Information on Nutrition Labels (n=209) |
Discussion
Our survey showed that there were many high calcium products available in the markets in Khon Kaen province. However, only half of those were known by the lower secondary school students surveyed in our study. The survey of food consumption over 24 hours indicated that few high calcium products were consumed by surveyed students. The average calcium intake of our lower secondary school students (median 410 mg) was similar to findings of a previous study conducted in Thailand.18 The amount of calcium consumed per day by lower secondary school students in the present study was slightly less than that of Korean, Greek, Brazilian and Mexican early adolescents.7–11 This could be due to variations in the types of common ingredients in local foods.
The main source of calcium of the surveyed lower secondary school students was UHT milk according to study III. This could be influenced by the aggressive advertisement of milk in Thailand. The key message of most milk advertisements is that milk promotes bone health. However, the quantity of milk required to be consumed each day to reach the recommended amount of calcium per day is not mentioned. The price for one carton of milk was approximately 15 THB (US$ 0.45) and to achieve the calcium TRDI each family would need to spend 30–60 THB (US$ 1–2) per child per day. This amount would be difficult for most families in rural or semi-urban areas in northeast of Thailand as the average income is only 18,294 THB per month (US$572).25 It should be noted that the price of some of the high calcium dairy products that were not known or eaten by students, for example lactose free milk and cheese, were triple the price of the UHT milk that the majority of the students in the present study consumed. Malt drink also contains high calcium (160 mg per serve) as the main ingredient is milk. Our findings from study III showed that only 40.2% of the students knew that malt drink was a high calcium product. This is likely to be due to the key message delivered by advertisements of malt drink in Thailand as a good source of energy, not as a source of calcium. Although approximately half of the surveyed lower secondary school students (53.1%) knew that yogurt was a good source of calcium, they did not consume these products. This is not surprising as yogurt is not advertised as high calcium product, but as a source of probiotics.26 Only 16% of the surveyed lower secondary school students knew that cheese was a good source of calcium. None of the surveyed lower secondary school students reported consuming cheese in either study II or study III. Again, this is not surprising as cheese is relatively expensive. It should be noted that cheese and other dairy products are not common ingredients in the Thai diet. Hence it may be impractical to suggest that students or parents incorporate dairy products into students’ meals.
Despite the fact that many meat products identified in our cross-sectional market survey (study I) contained very high amounts of calcium per serve, only a few items, such as canned fish (sardines in tomato sauce) and minnow (small fish with bones), were consumed by lower secondary school students in small quantities. As these products are relatively inexpensive and easy to find in local fresh markets, increased consumption of meat products should be promoted to increase calcium consumption. In the knowledge test about sources of high calcium (study III), only 13.9% of the surveyed students knew that red tilapia did not contain high calcium. Students should be informed that canned fish contains relatively higher calcium than large fish because canned fished includes softened bones. Students and parents need to be made aware of the high calcium products available in their communities.
Most high calcium vegetables, except turkey berry and Chinese kale, can be found only in season. Traditional and novel menus that incorporate turkey berry and/or Chinese kale should be promoted among students. Some vegetables contain oxalate, which prevents calcium from being absorbed into the body,27–29 and high oxalate foods may increase risk of getting bladder stones.30,31 Students, parents and food providers at school canteens should be informed that boiling or steaming vegetables can reduce soluble oxalate by 30–87% and 5–53%, respectively.32 However, students and parents should be informed to not rely only on vegetables to provide all of their daily calcium needs.
Most of the high calcium products in the legume, nut and seed group are relatively inexpensive and can easily be found in Thailand, including in Khon Kaen province. However only half of the products in this group were known or consumed by the respondents in the past three months in study II, and only calcium fortified UHT soymilk was reported to be consumed in the previous 24 hours in study III. Our findings showed that almost all the respondents mistakenly believed that tofu drink was a source of high calcium. Tofu drink is a common beverage for breakfast and is relatively inexpensive, but one serve of tofu drink contains only 24 mg of calcium.33 This is unlike UHT soymilk and hard tofu. Most of the soymilk sold in cartons is fortified with calcium34 and hard tofu is made by adding calcium sulphate to soybean liquid.35,36 Hence, they are good sources of calcium. Lower secondary school students should be informed about the different amounts of calcium in tofu drink, UHT soymilk and hard tofu. Since not all UHT soymilks are fortified with calcium, students should also be informed to read the nutrition label.
Respondents showed poor knowledge about sources of calcium and interpreting nutrition labels (Table 5). The low scores in the knowledge test of the calcium information provided in a sample nutrition label indicated that lower secondary school students did not know the TRDI for calcium. This is similar to the finding of a previous study conducted in adults in Khon Kaen.37 Our findings also suggested that lower secondary school students could not interpret messages about micronutrients on the nutrition label. Most of them did not know what “calcium 30%” written on the nutrition label meant. They confused the concept of daily calorie intake with TRDI for calcium, and most of them seemed unaware that the amount of calcium they need to consume each day must reach 100% of the TRDI. The findings suggested an urgent need to provide lower secondary school students with knowledge about sources of calcium and train them to read and interpret nutrition labels. The current nutrition label did not seem to be help them to plan their daily calcium intake. Recently in the US, the nutrition label was changed. The amount of each micronutrient in the product is declared in addition to the percent daily value.38 This type of change could help consumers in planning and maintaining healthy dietary practices39 in Thailand.
The main strength of this research program was to identify the high calcium products that were known or consumed by lower secondary school students prior to conducting the survey of food consumption. This process helped reduce the number of items in the list of high calcium products which helped minimize information bias and the amount of missing data that would result from a long questionnaire.40 However, since only foods that were known or had been consumed in the last three months were included in the food frequency questionnaire, it is possible that calcium consumption could have been slightly underestimated as the students may have consumed other common foods that contained low or moderate amounts of calcium such as egg, pork, banana, and rice. In addition, it is recommended that the 24-hour recalled food consumption survey should be administered multiple times to account for day-to-day variation in food consumption.41 Finally, while the researchers are confident that the characteristics of the school selected for this study accurately represent lower secondary schools in semi-urban areas in Khon Kaen province, the findings may not be generalised to include other populations.
Conclusions
Thailand is one of the world’s aging societies. If comprehensive bone health promotion is not seriously implemented, particularly among lower secondary school students at the stage of rapid bone development, the cost of osteoporosis may become one of the main burdens to the Thai health system. This research project indicated that, although there were many high calcium products available, calcium deficiency was still a health problem in lower secondary school students and that only a few high calcium items were known and consumed by them. Students exhibited poor knowledge about high calcium food sources and lacked understanding about the amount of calcium indicated on nutrition labels.
In addition to milk, the high calcium items most commonly consumed by lower secondary school students were milk, malt drink, minnow, canned fish, calcium fortified soy milk and Chinese kale. Students should be introduced to other high calcium products that are available in their community such as hard tofu, small freshwater shrimp, and golden apple snail. Educational programs on nutrition label interpretation are needed. Suitable methods and channels to disseminate this knowledge should be explored.
Acknowledgments
This study was partially funded by the Faculty of Pharmaceutical Sciences of Khon Kaen University. The authors would also like to thank Dr Glenn Borlace, Faculty of Pharmaceutical Sciences, Khon Kaen University, for editing English grammar.
Disclosure
The authors report no conflicts of interest in this work.
References
1. Mesias M, Seiquer I, Navarro MP. Calcium nutrition in adolescence. Crit Rev Food Sci Nutr. 2011;51(3):195–209. doi:10.1080/10408390903502872
2. Zhu K, Prince RL. Calcium and bone. Clin Biochem. 2012;45(12):936–942. doi:10.1016/j.clinbiochem.2012.05.006
3. Rizzoli R. Nutritional aspects of bone health. Best Pract Res Clin Endocrinol Metab. 2014;28(6):795–808. doi:10.1016/j.beem.2014.08.003
4. Weaver CM, Heany RP. Calcium. In: Ross AC, Caballero B, Cousins RJ, Tucker KL, Ziegler TR, editors. Modern Nutrition in Health and Disease.
5. Beta JA. The role of calcium in human aging. Clin Nutr Res. 2015;4(1):1–8.
6. Weaver CM, Gordon CM, Janz KF, et al. The National Osteoporosis Foundation’s position statement on peak bone mass development and lifestyle factors: a systematic review and implementation recommendations. Osteoporos Int. 2016;27(4):1281–1386.
7. Veiga GV, Costa RS, Araujo MC, et al. Inadequate nutrient intake in Brazilian adolescents. Rev Saude Publica. 2013;47(Suppl 1):212S–221S. doi:10.1590/S0034-89102013000700007
8. Im JG, Kim SH, Lee GY, Joung H, Park MJ. Inadequate calcium intake is highly prevalent in Korean children and adolescents: the Korea National Health and Nutrition Examination Survey (KNHANES) 2007–2010. Public Health Nutr. 2014;17(11):2489–2495. doi:10.1017/S1368980013002826
9. Manios Y, Moschonis G, Grammatikaki E, et al. Food group and micronutrient intake adequacy among children, adults and elderly women in Greece. Nutrients. 2015;7(3):1841–1858. doi:10.3390/nu7031841
10. de Assumpção D, Dias MR, de Azevedo Barros MB, Fisberg RM, de Azevedo Barros Filho A. Calcium intake by adolescents: a population-based health survey. J Pediatr (Rio J). 2016;92(3):251–259. doi:10.1016/j.jped.2015.09.004
11. Sánchez-Pimienta TG, López-Olmedo N, Rodríguez-Ramírez S, et al. High prevalence of inadequate calcium and iron intakes by Mexican population groups as assessed by 24-hour recalls. J Nutr. 2016;146(9):1874s–1880s. doi:10.3945/jn.115.227074
12. Rojroongwasinkul N, Kijboonchoo K, Wimonpeerapattana W, et al. SEANUTS: the nutritional status and dietary intakes of 0.5–12-year-old Thai children. Br J Nutr. 2013;110(Suppl 3):S36–S44. doi:10.1017/S0007114513002110
13. World Health Organization. Orientation programme on adolescent health for health-care providers; 2021. Available from: https://www.who.int/maternal_child_adolescent/documents/pdfs/9241591269_op_handout.pdf.
14. Royal Thai Government Gazette. Compulsory Education Act B.E. 2545, 2002.
15. Royal Thai Government Gazette. MOPH Notification No. 182 B.E. 2541 Re: Nutrition Labelling. 1998.
16. Puangpun W. Calcium Intake of Early Adolescent Students in Rural Aea: A Case Study of Tha-Sala-Nusorn School, Manchakiri District, Khon Kaen Province, Thailand. Khon Kaen [Dissertation]. Graduated school, Khon Kaen University; 1999. Thai.
17. Kunnawutkunakorn D, Chongsuwat R, Pundee W, Sirikunchayanon C. Awareness of the importance of calcium to the body and the calcium-containing food consumption in lower secondary school students. Thai J Health Educ. 2001;24(89):1–13. Thai.
18. Buppasiri M, Kanjanarach T, Jaisaard R. A survey of food consumption behavior and sources of calcium of secondary students in Khon Kaen province for osteoporosis prevention management. MBA-KKU J. 2016;9(1):187–202. Thai.
19. Krittaphol W, Bailey KB, Pongcharoen T, Winichagoon P, Gibson RS. Low zinc, iron, and calcium intakes of Northeast Thai school children consuming glutinous rice-based diets are not exacerbated by high phytate. Int J Food Sci Nutr. 2006;57(7–8):520–528. doi:10.1080/09637480601040989
20. Kamchan A, Puwastien P, Sirichawal P, Kongkachuichai R. In vitro calcium bioavailability of vegetables, legumes and seeds. J Food Compos Anal. 2004;17(3–4):311–320. doi:10.1016/j.jfca.2004.03.002
21. Prasertwaree R. Menu Development of High-Calcium Thai Diet [Dissertation]. Salaya: Mahidol university; 2005.
22. Judprasong K, Puwasatien P, Rojroongwasinkul N, Nitithamyong A, Sridonpai P, Somjai A. Thai Food Composition Tables. Salaya: Institute of Nutrition, Mahidol University; 2015. Thai.
23. Charan J, Biswas T. How to calculate sample size for different study designs in medical research? Indian J Psychol Med. 2013;35(2):121–126. doi:10.4103/0253-7176.116232
24. WHO/IASO/IOTF. The Asia-Pacific Perspective: Redefining Obesity and Its Treatment. Melbourne: Health Communications Australia; 2000. ISBN 0-9577082-1-1.
25. National of statistical office, Ministry of digital economy and society. The 2019 household socio-economic survey northeastern region. 2019.
26. Aryana KJ, Olson DW. A 100-year review: yogurt and other cultured dairy products. J Dairy Sci. 2017;100(12):9987–10013.
27. Weaver CM, Heaney RP, Nickel KP, Packard PI. Calcium bioavailability from high oxalate vegetables: Chinese vegetables, sweet potatoes and rhubarb. J Food Sci. 1997;62(3):524–525. doi:10.1111/j.1365-2621.1997.tb04421.x
28. Noonan SC, Savage GP. Oxalate content of foods and its effect on humans. Asia Pac J Clin Nutr. 1999;8(1):64–74. doi:10.1046/j.1440-6047.1999.00038.x
29. Holmes RP, Kennedy M. Estimation of the oxalate content of foods and daily oxalate intake. Kidney Int. 2000;57(4):1662–1667. doi:10.1046/j.1523-1755.2000.00010.x
30. Mitchell T, Kumar P, Reddy T, et al. Dietary oxalate and kidney stone formation. Am J Physiol Renal Physiol. 2019;316(3):F409–F413. doi:10.1152/ajprenal.00373.2018
31. Ferraro PM, Bargagli M, Trinchieri A, Gambaro G. Risk of kidney stones: influence of dietary factors, dietary patterns, and vegetarian-vegan diets. Nutrients. 2020;12(3):779. doi:10.3390/nu12030779
32. Chai W, Liebman M. Effect of different cooking methods on vegetable oxalate content. J Agric Food Chem. 2005;53(8):3027–3030. doi:10.1021/jf048128d
33. Judprasong K, Puwastien P, Rojroongwasinkul N, Nitithamyong A, Sridonpai P, Somjai A. Thai food composition database. 2ed. Institute of Nutrition, Mahidol University; 2015.Available from: https://inmu2.mahidol.ac.th/thaifcd/home.php.
34. Venderley AM, Campbell WW. Vegetarian diets: nutritional considerations for athletes. Sports Med. 2006;36(4):293–305. doi:10.2165/00007256-200636040-00002
35. Kao FJ, Su NW, Lee MH. Effect of calcium sulfate concentration in soymilk on the microstructure of firm tofu and the protein constitutions in tofu whey. J Agric Food Chem. 2003;51(21):6211–6216. doi:10.1021/jf0342021
36. Prabhakaran MP, Perera CO, Valiyaveettil S. Effect of different coagulants on the isoflavone levels and physical properties of prepared firm tofu. Food Chem. 2006;99(3):492–499. doi:10.1016/j.foodchem.2005.08.011
37. Sriring P, Krass I, Kanjanarach T. Calcium consumption for osteoporosis prevention: knowledge, attitudes and behavior in the northeastern region, Thailand. J Med Assoc Thai. 2014;97(2):232–240.
38. US.FDA. Changes to the nutrition facts label; 2021. Available from: https://www.fda.gov/food/food-labeling-nutrition/changes-nutrition-facts-label?utm_source=msn.
39. Miller LM, Cassady DL. The effects of nutrition knowledge on food label use. A review of the literature. Appetite. 2015;92:207–216. doi:10.1016/j.appet.2015.05.029
40. Choi BC, Pak AW. A catalog of biases in questionnaires. Prev Chronic Dis. 2005;2(1):A13.
41. Thompson FE, Subar AF. Dietary assessment methodology. In: Coulston AM, Boushey CJ, Ferruzzi MG, editors. Nutrition in the Prevention and Treatment of Disease.
 © 2021 The Author(s). This work is published and licensed by Dove Medical Press Limited. The
full terms of this license are available at https://www.dovepress.com/terms
and incorporate the Creative Commons Attribution
- Non Commercial (unported, 3.0) License.
By accessing the work you hereby accept the Terms. Non-commercial uses of the work are permitted
without any further permission from Dove Medical Press Limited, provided the work is properly
attributed. For permission for commercial use of this work, please see paragraphs 4.2 and 5 of our Terms.
© 2021 The Author(s). This work is published and licensed by Dove Medical Press Limited. The
full terms of this license are available at https://www.dovepress.com/terms
and incorporate the Creative Commons Attribution
- Non Commercial (unported, 3.0) License.
By accessing the work you hereby accept the Terms. Non-commercial uses of the work are permitted
without any further permission from Dove Medical Press Limited, provided the work is properly
attributed. For permission for commercial use of this work, please see paragraphs 4.2 and 5 of our Terms.