Back to Journals » Neuropsychiatric Disease and Treatment » Volume 16
Construction of a Risk Model Associated with Prognosis of Post-Stroke Depression Based on Magnetic Resonance Spectroscopy
Authors Qiao J, Sui R, Zhang L, Wang J
Received 11 January 2020
Accepted for publication 16 April 2020
Published 8 May 2020 Volume 2020:16 Pages 1171—1180
DOI https://doi.org/10.2147/NDT.S245129
Checked for plagiarism Yes
Review by Single anonymous peer review
Peer reviewer comments 2
Editor who approved publication: Dr Jun Chen
Video abstract of "MRS risk prediction model for post-stroke depression (PSD)" [ID 245129]
Views: 418
Jialu Qiao,1 Rubo Sui,1 Lei Zhang,2 Jiannan Wang1
1Department of Neurology, First Affiliated Hospital of Jinzhou Medical University, Jinzhou, Liaoning, People’s Republic of China; 2School of Nursing, Jinzhou Medical University, Jinzhou, Liaoning, People’s Republic of China
Correspondence: Rubo Sui
Department of Neurology, First Affiliated Hospital of Jinzhou Medical University, Jinzhou, Liaoning, People’s Republic of China
Tel +8618640605108
Email [email protected]
Purpose: This study aimed to develop a risk prediction model for post-stroke depression (PSD) based on magnetic resonance (MR) spectroscopy.
Patients and Methods: Data of 61 patients hospitalized with stroke (November 2017–March 2019) were retrospectively analyzed. After 61 patients had been admitted to hospital for routine clinical information collection, when the patients were in stable condition, proton MR spectroscopy (1H-MRS) examinations were performed to measure the ratio of choline to creatine (Cho/Cr) and N-acetylaspartate to creatine (NAA/Cr) in brain regions related to emotion. From the second month to the sixth month after the onset, these 61 patients were assessed by the Hamilton Depression Scale once a month. Based on the scores, patients were divided into PSD and post-stroke non-depression (N-PSD) groups. Twenty-two characteristics were extracted from clinical data and the 1H-MRS imaging indexes. The least absolute shrinkage and selection operator (LASSO) regression was used for optimal feature selection and the nomogram prediction model was established. The model’s predictive ability was validated by a calibration plot and the area under the curve (AUC) of the receiver operating characteristic curve.
Results: Two demographic characteristics (activities of daily living and initial National Institutes of Health Stroke Scale scores) and three 1H-MRS imaging characteristics (frontal-lobe Cho/Cr, temporal-lobe Cho/Cr, and anterior cingulated-cortex Cho/Cr) were screened out by LASSO regression. The consistency test through the calibration plot found that the predicted probability of the nomogram for PSD correlates well with the actual probability. The AUCs for internal validation and external validation were 0.8635 and 0.8851, respectively.
Conclusion: The PSD risk model based on 1H-MRS may help guide early treatment of stroke and prevent progression to PSD.
Keywords: PSD, 1H-MRS imaging, prediction model, nomogram
Introduction
Post-stroke depression (PSD) refers to self-accusation and self-guilt, lack of pleasure, and loss of interest in patients after stroke. Symptoms can last for more than 2 weeks.1 PSD significantly reduces quality of life, delays recovery of neurological function, increases cost of treatment, and increases the risk of death by 3.4 times within 10 years.2 However, the incidence of PSD is mostly concentrated from the second month to the sixth month after stroke, so how we know the patient’s condition depends on the follow-up after discharge.3,4 Untimely follow-up care, poor objectivity, and lack of awareness of the illness by patients and their families may affect the diagnosis of PSD. An objective, accurate prediction of PSD coupled with early intervention during hospitalization may be a promising approach to understand the pathogenesis of PSD and reduce its burden.
Proton magnetic resonance spectroscopy (1H-MRS) is a non-invasive imaging modality that observes metabolic changes in damaged brain regions, and is used in a variety of neurological conditions. In recent years, research on depression, schizophrenia, and other mental diseases, especially the metabolic changes in the brain areas related to PSD, has become a hot topic. MRS reflects the changes of neurobiochemical metabolites in the brain. The commonly used neurotransmitters related to depression include choline (Cho), N-acetylaspartic acid (NAA) and creatine (Cr). These neurobiochemical metabolites are closely related to the structural and functional integrity of nerve cells, membrane phospholipid metabolism, neurotransmitter metabolism, second messenger metabolism and high-energy phosphate metabolism. International5 and domestic6 studies have suggested that 1H-MRS may be used to obtain a wide range of information related to the occurrence, progression, and prognosis of PSD. 1H-MRS can predict the occurrence and guide the treatment of PSD and has the potential to be a novel imaging biomarker. However, there is a dearth of reported research on the establishment of a PSD prediction model utilizing 1H-MRS.
A nomogram prediction model is simple, intuitive, and practical. With the programming advantage of R language, it can be easily drawn with only a series of codes, no matter its subtype or continuous variable.7 This study aimed to use LASSO regression to screen relevant indicators and build a PSD risk prediction model, to explore neurological metabolic mechanisms related to the onset of PSD, and to evaluate the probability of a patient developing PSD, to allow for timely intervention for PSD patients at an early stage.
Patients and Methods
Selection and Grouping of Subjects
Individuals who presented at the Department of Neurology of the First Affiliated Hospital of Jinzhou Medical University and hospitalized within 7 days after a stroke from November 2017 to March 2019 were selected as subjects for the study. After routine clinical information collection and medical treatment, when the patients were in stable condition, proton MR spectroscopy (1H-MRS) examinations were performed to measure the ratio of choline to creatine (Cho/Cr) and N-acetylaspartate to creatine (NAA/Cr) in brain regions related to emotion. All stroke patients were evaluated using the Hamilton Depression Scale (HAMD) from the second month to the sixth month once a month after the stroke onset. According to the scores, the stroke patients were divided into a post-stroke depression (PSD) group and a post-stroke non-depression (N-PSD) group.
This study was conducted in accordance with the Declaration of Helsinki and was approved by the Ethics Committee of the First Hospital of Jinzhou Medical University. All subjects signed the medical informed consent documents.
Inclusion Criteria
Diagnosis
At onset, patients were diagnosed with first-time ischemic stroke confined by the head computed tomography (CT) in accordance with the diagnostic criteria of stroke of the Fourth National Conference on Cerebrovascular Diseases.8
Evaluation of Depression
Depression was evaluated from the second month to the sixth month once a month after onset by the HAMD scale in accordance with the diagnostic criteria of the third edition of the Chinese Diagnostic and Classification Standard of Mental Disorders.9
Exclusion Criteria
The exclusion criteria were individuals older than 80 years of age; left-handed patients; history of cerebrovascular disease (cerebral infarction or cerebral hemorrhage), head trauma, or brain organic disease; intellectual disability, severe visual acuity, hearing impairment, aphasia, or inability to complete the dementia scale; a personal or family history of depression and anxiety or other mental disorders; suspected history of alcohol or drug abuse; history of taking psychoactive drugs; use of steroid drugs during treatment.
Collection of Clinical Data
At the time of the first visit, age, sex, level of education, family income, and basic medical history regarded as the risk of stroke (hypertension, diabetes, hyperlipidemia, and heart disease) for the subjects were recorded. Computed tomography (CT), electrocardiography, echocardiography, carotid artery ultrasonography, and transcranial Doppler were performed.
Evaluation Standards
PSD Diagnosis
Patients were evaluated with the HAMD17, which was scored independently by two evaluators; the average of 4-month values was calculated (non-depression, <7 points; depression, ≥7 points).
Family Care Function Assessment
The Family APGAR (“Adaptability,” “Partnership,” “Growth,” “Affection,” and “Resolve”) index was used (good family function, 7–10 points; family dysfunction, <7 points).
Personality
The Eysenck Personality Questionnaire was used to evaluate patient personality as extroverted or introverted.
Activities of Daily Living (ADL) Scale
The ADL scale was adopted to evaluate capacity for normal independent function. A score of 100 points denotes that the patients are capable of self-care; ≥60 points signify the capacity for basic self-care; 60–40 points signify that the patient requires assistance; 40–20 points signify that the patient requires considerable assistance; and <20 points denote the patient is completely dependent.
National Institutes of Health Stroke Scale (NIHSS)
The NIHSS was used to evaluate the degree of neurological impairment at stroke onset and the 14th day after onset. The scores ranged from 0 to 42 points. The higher the score, the more severe the neurological impairment.
MR Scanning and Analysis
When the patients were in stable condition, mostly on the 14th day after onset, they were scanned using MRI.
Morphological Information Collection by Cerebral MRI
Morphological brain information was collected with a Siemens Magentom Verio 3.0T scanner. The scanning parameters were axis T1 weighted imaging (T1WI) DRIVE: TR=2000 ms, TE=20 ms, IR=800 ms, thickness=6 mm, gap=1 mm, NSA=1, matrix=400×351, TSE Factor=7; T2 weighted imaging (T2WI) DRIVE: TR=3000 ms, TE=80 ms, NSA=1, matrix=484×377, thickness=6 mm, gap=1 mm, TSE Factor=15.
Proton Magnetic Resonance Spectroscopy (1H-MRS)
Multivoxel spectral scanning was performed, and the left frontal lobe, left temporal lobe, left anterior cingulate gyrus, left posterior cingulate gyrus, left precuneus, and the contralateral middle cerebellar peduncles of stroke lesion10 were selected as regions of interest from conventional MRI T1WI or T2WI images.11–13 The voxel size was 1.0 cm x 1.0 cm x 1.5 cm. The structures of the skull, fat, air cavity, and cerebrospinal fluid should be avoided to prevent affecting the examination results. The scanning parameters were TR=1500 ms and TE=35 ms and the average scanning time for each part was 4min12s. The transmitting and receiving adjustment magnetic field and anhydrous suppression scanning were completed automatically, and the full width at half height of the water peak was less than 3–5 Hz.
Changes in metabolites were observed.1H-MRS of normal brain tissues showed different types of metabolites at different echo times (TE). In this study, the metabolites detected at long TE were N-acetylaspartic acid (NAA), choline (Cho), and creatine (Cr) and their chemical shifts were 2.02, 3.22, and 3.02 ppm, respectively. The relative concentrations of NAA and Cho were recorded, and NAA/Cr and Cho/Cr were calculated (Figures 1 and 2).
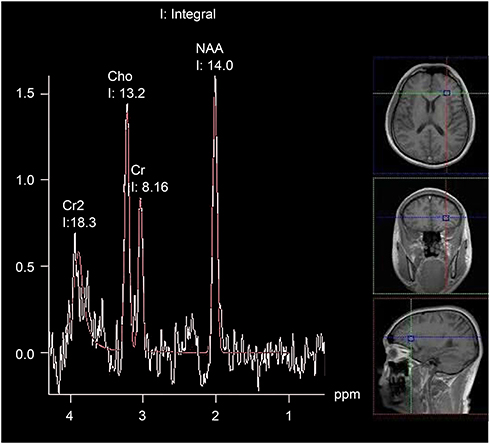 |
Figure 1 MR spectroscopic images of the post-stroke group. The MR spectroscopy image is shown on the left side. The right indicates the location of the left prefrontal lobe on MR images. Abbreviations: MR, magnetic resonance; NAA, N-acetylaspartic acid; Cr, creatine; Cho, choline; ppm, parts per million. |
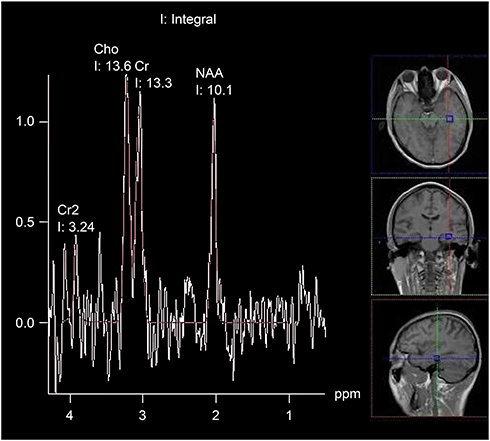 |
Figure 2 MR spectroscopic images of the post-stroke depression group. The MR spectroscopy image is shown on the left side. The right indicates the location of the left temporal lobe on MR images. Abbreviations: MR, magnetic resonance; NAA, N-acetylaspartic acid; Cr, creatine; Cho, choline; ppm, parts per million. |
Statistical Calculation
Screening of Predictors
In this study, whether patients suffered from PSD during follow-up was a binary classification problem. The risk factors related to PSD were screened by LASSO (least absolute shrinkage and selection operator) regression through R Programming Language (version 3.6.1, package “glmnet”). For an excellent model fit, a 10-fold cross validation method was used and we finally selected the parameters with modeling ability.
Drawing of the Forest Plots
Stata (Version: 13.1) was used to analyze the selected factors, and the odds ratio (OR) of each risk factor for PSD was calculated, which was expressed as 95% confidence interval (95% CI). An intuitive and easy to understand forest plot was drawn.
Establishment and Evaluation of the Nomogram Risk Model
Based on the final multivariate analysis results, the R Programming Language (package “rms”) was used to establish the risk prediction model for PSD.
In this study, Bootstrap method was used for repeated sampling for further internal verification. In order to better verify the accuracy of the model, we promoted the established risk prediction model to other neurology departments of various hospitals in Liaoning Province and asked the local neurologists to help collecting the relevant medical data of stroke patients to facilitate our external validation. Finally, we performed external validation to the model on 382 stroke patients (133 PSD and 249 N-PSD) who were hospitalized from September 2019 to January 2020. (The patients who participated the external validation set were 148 from Shengjing Hospital of China Medical University, 110 from the First Affiliated Hospital of Dalian Medical University, 27 from People’s Hospital of Dalian Lyshunkou District, 59 from the First Affiliated Hospital of Jinzhou Medical University and 38 from the Third Affiliated Hospital of Jinzhou Medical University.)
The performance of nomogram can be evaluated by a calibration plot. The calibration plot compares predicted probability and actual occurrence rate by drawing a scatter plot. Each scatter represents the deviation of the predicted probability from the actual occurrence rate. The scatter points of the ideal nomogram prediction model should all fall near the 45° diagonal line. The area under the curve (AUC) of the receiver operating characteristic (ROC) can be used to evaluate the prediction accuracy of the model. The AUC value ranges from 0.5 to 1.0 and a larger value indicates a stronger discrimination ability. In this study, the calibration plot and ROC curve were drawn using the R statistical programming language (packages “rms” and “ROCR”).
Results
Analyses of Data Based on Clinical and 1H-MRS Imaging Metabolic Indexes
Sixty-one subjects were included in this study (PSD: n=30; N-PSD: n=31;). The average age, education level, monthly income, APGAR score, ADL score, initial NIHSS score, NIHSS score 14 days after admission, HAMD score (average of 5 months), Cho/Cr, and NAA/Cr of the two groups are shown in Table 1.
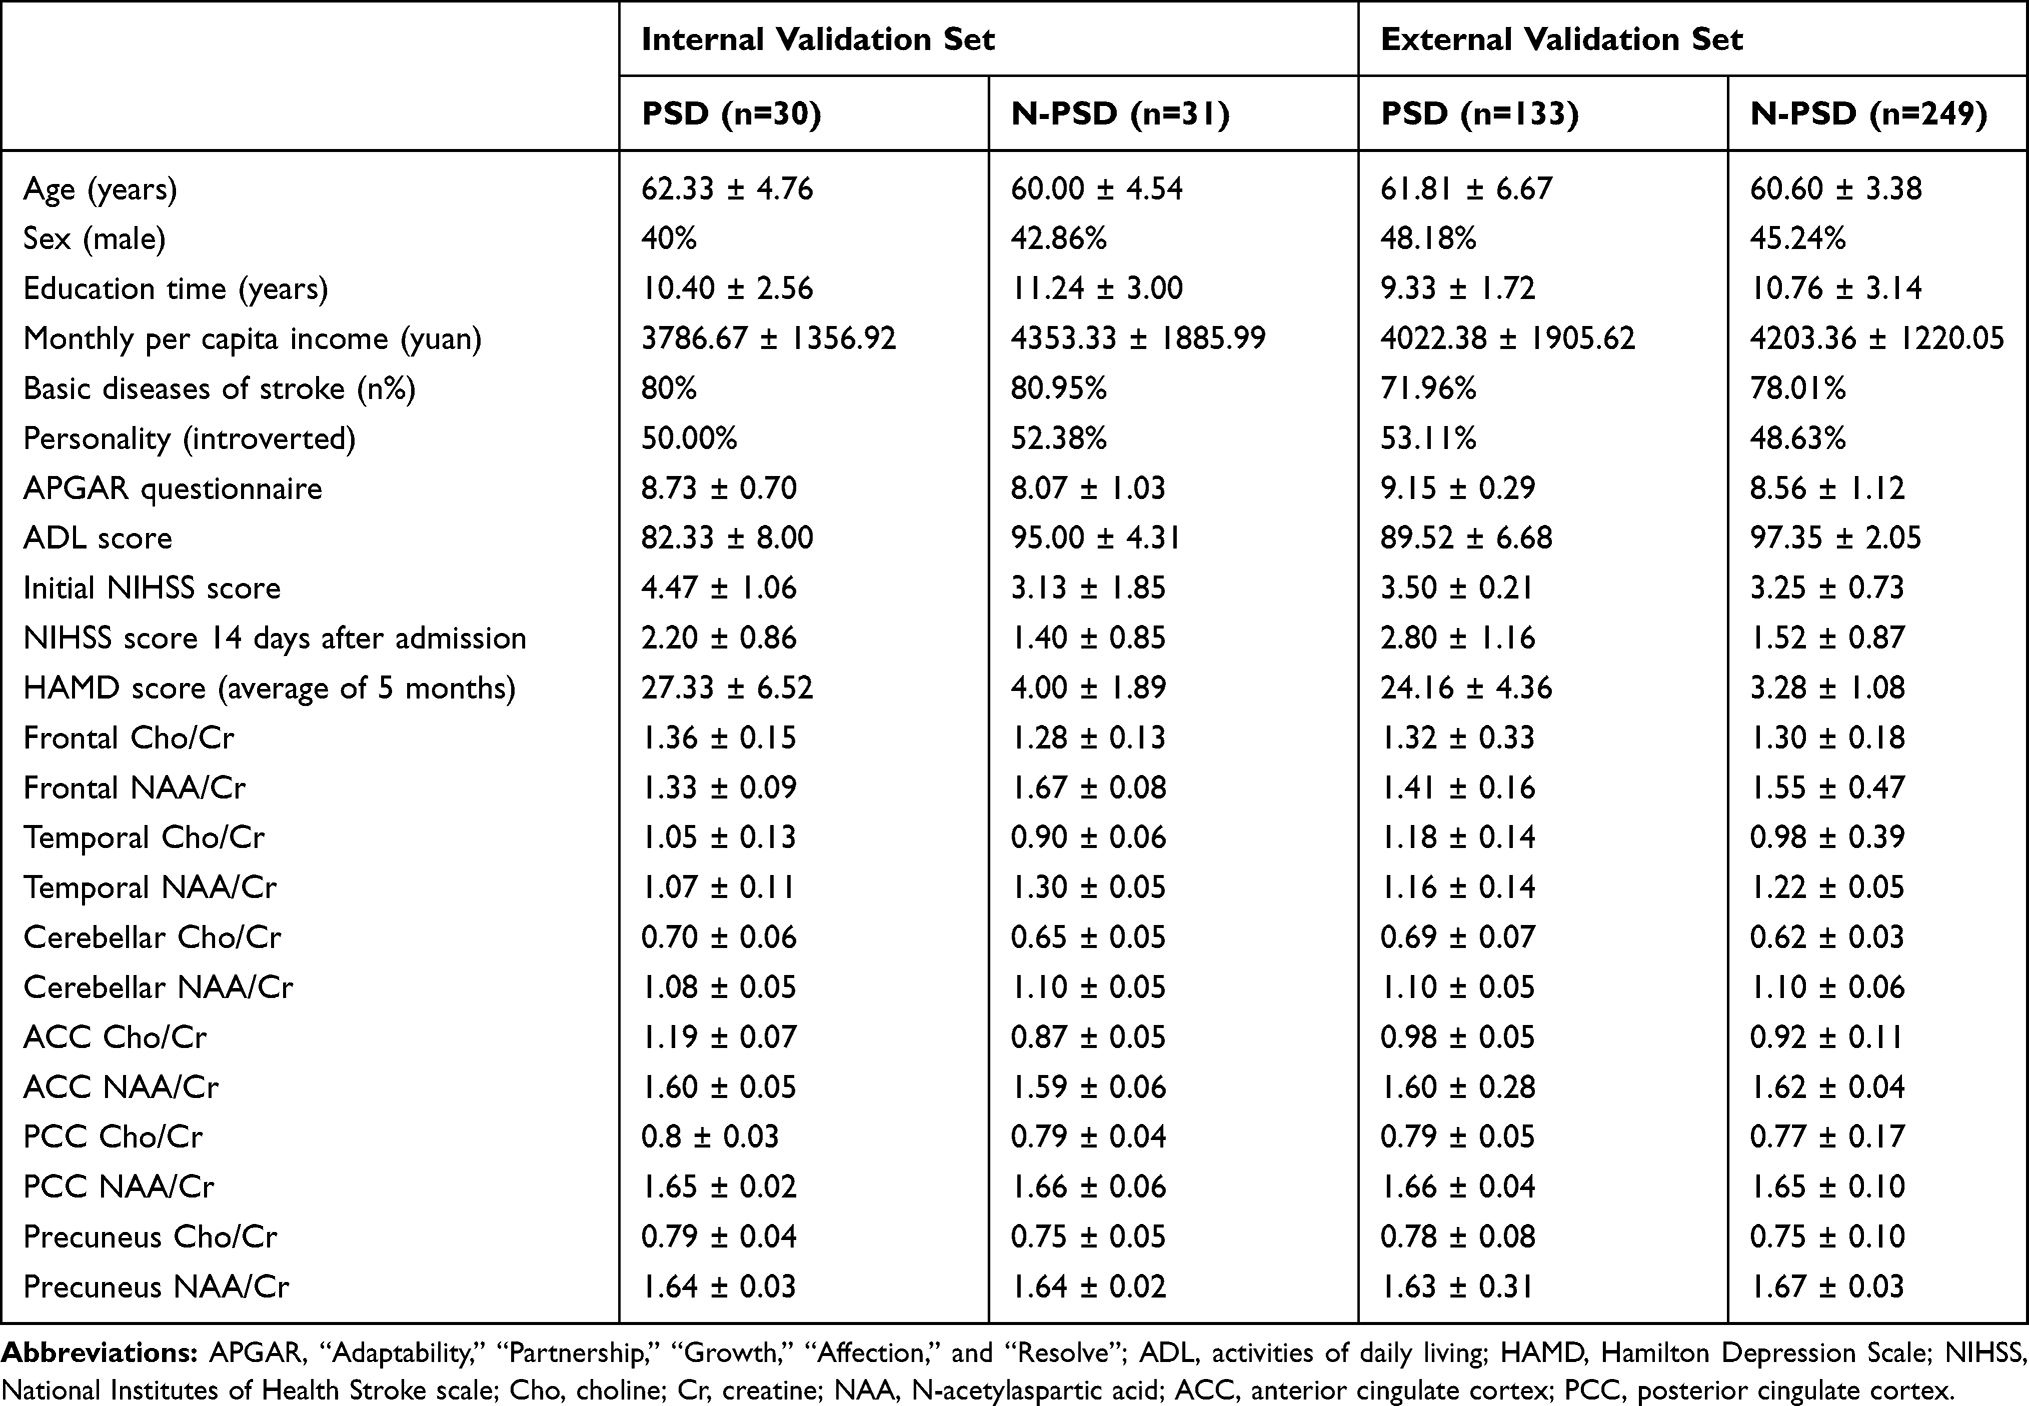 |
Table 1 Clinical Data and MRS Characteristics of the Internal and External Validation Sets |
LASSO for Characteristic Parameter Selection
In order to determine the risk factors related to PSD, we used LASSO regression to screen variables from high-dimensional clinical statistics and 1H-MRS imaging metabolic indexes. As shown in Figure 3, after the 10-fold cross validation, when λ took the minimum value, five factors (ADL score, initial NIHSS score, frontal-lobe Cho/Cr, temporal-lobe Cho/Cr, and anterior cingulate-gyrus Cho/Cr) were finally screened to be related to PSD. Figure 4 shows the regression coefficient plot of 22 factors by LASSO. Figure 5 shows the forest plot after analyzing the selected factors by Stata. ADL score (OR = 0.83; 0.73~0.92), initial NIHSS score (OR = 3.87; 2.24~8.64), frontal lobe Cho/Cr (OR = 1.00; 0.65~1.54), temporal lobe Cho/Cr (OR = 4.12; 2.22~7.64), anterior cingulate gyrus Cho/Cr (OR = 2.23; 1.83~5.97) were independent risk factors for PSD (Figure 5). The ADL score was on the left side of the invalid line, which indicates that it is negatively correlated with PSD. The initial NIHSS score, temporal lobe Cho/Cr, anterior cingulate gyrus Cho/Cr were positively correlated with PSD.
 |
Figure 3 Elucidation of LASSO coefficient profiles for selected factors. After the 10-fold cross validation, when λ took the minimum value, five factors were finally screened to be related to PSD. Abbreviation: LASSO, the least absolute shrinkage and selection operator. |
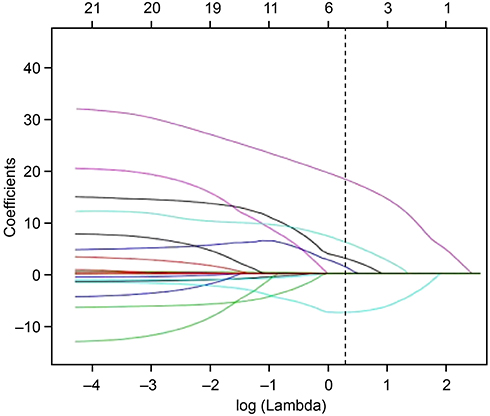 |
Figure 4 Parameter selection was performed through LASSO regression. The figure shows the regression coefficient plot with 22 factors by LASSO, with five factors screened (ADL score, initial NIHSS score, frontal-lobe Cho/Cr, temporal-lobe Cho/Cr, and anterior cingulate-gyrus Cho/Cr). Abbreviation: LASSO, the least absolute shrinkage and selection operator. |
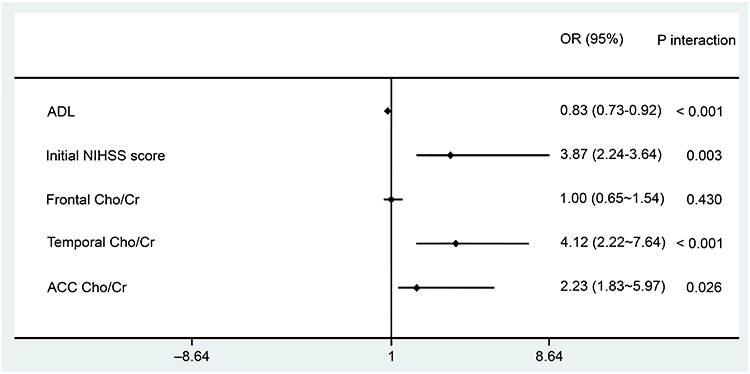 |
Figure 5 The forest plot of the odds ratios (ORs) and 95% confidence intervals (CIs) obtained from Stata’s analysis of the five independent risk factors. The ADL score is on the left side of the invalid line, which indicates a negative correlation with PSD. The initial NIHSS score, temporal lobe Cho/Cr, anterior cingulate gyrus Cho/Cr are positively correlated with PSD. |
Establishment of Nomogram
A nomogram was established in combination with the above independent prediction factors (Figure 6). According to the value of each independent risk factor corresponding to the upper scale (0–100), we could determine the corresponding score of this risk factor. The total score was obtained by adding the scores of each factor. Projecting downward from the total score, the corresponding PSD risk prediction probability value could be obtained.
 |
Figure 6 Post-stroke depression (PSD) risk prediction nomogram. According to the value of each independent risk factor corresponding to the upper scale (0–100), we could get the corresponding score of this risk factor. The total score was obtained by adding the scores of each factor. Projecting downward from the total score, the corresponding PSD risk prediction probability value could be obtained. Abbreviations: ACC, anterior cingulate cortex; ADL, activities of daily living; Cho, choline; Cr, creatine; NIHSS, National Institutes of Health Stroke Scale; PSD, post-stroke depression. |
Validation of the Prediction Model
The consistency test between the predicted value and the actual value through the calibration plot found that the predicted probability of the nomogram for PSD correlates well with the actual occurrence rate. The AUC values for internal and external validation were 0.8635 (95% CI 0.823 to 0.910) and 0.8851 (95% CI 0.831 to 0.908), respectively, indicating that the model had a better ability to identify and predict the risk of PSD (Figures 7–10).
 |
Figure 7 Scatter diagram of the calibration plot for internal verification of the nomogram. Bootstrap method was used for repeated sampling and internal verification. X axis: predicted prevalence of PSD; Y axis: the actually diagnosed PSD; diagonal dotted line: the perfect prediction of an ideal model; solid line: the performance of the line diagram. The closer the scatter points to the diagonal dashed line, the better the prediction efficiency of the nomogram. Abbreviation: PSD, post-stroke depression. |
 |
Figure 8 Scatter diagram of the calibration plot for external verification of the nomogram. Three hundred and eighty-two stroke patients (133PSD, 249N-PSD) admitted to the Department of Neurology from September 2019 to January 2020 in Liaoning province were analyzed for external verification. |
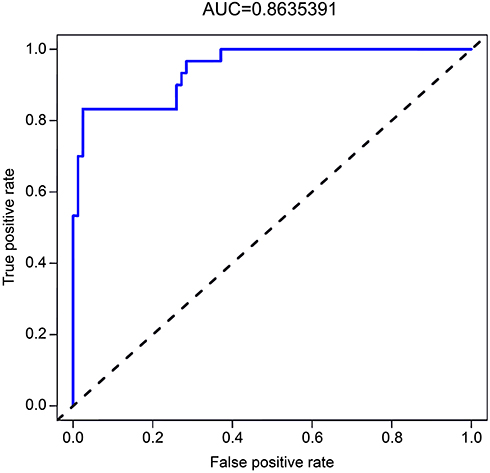 |
Figure 9 The ROC curve for internal validation of the prediction model. The AUC was 0.8635 (n=61). Abbreviations: AUC, area under the ROC curve; PSD, post-stroke depression; ROC, receiver operating characteristic. |
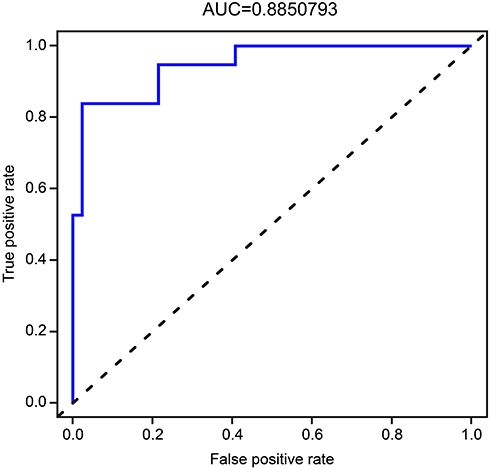 |
Figure 10 The ROC curve for external validation of the prediction model. The AUC was 0.8851 (n=382). Abbreviations: AUC, area under the ROC curve; PSD, post-stroke depression; ROC, receiver operating characteristic. |
Discussion
The incidence of PSD varies from 18% to 79%14 and is attributed to the lack of attention to PSD onset during hospitalization, untimely follow-up after discharge, and different diagnostic criteria of PSD. In this study, 1H-MRS technology was used to detect the metabolic indexes of emotion-related brain areas. Utilizing the advantages of nomogram such as simple operation, easy understanding, and high accuracy, we hoped to carry out clinical intervention in the early stage of PSD.
Clinical Data Factors
The results of the clinical data in this study showed that the ADL score and the initial NIHSS score were the strongest predictors of PSD and had high clinical relevance in improving the quality of life of stroke patients. It has been well documented that the degree of neurological impairment and the ability to perform ADL at the early stages of stroke are significantly correlated with the occurrence of PSD.15,16 Specifically, the more severe the degree of neurological impairment and the lower the ADL ability, the greater the risk of PSD. Therefore, for patients with cerebrovascular diseases, we should actively promote the recovery of limb function, help patients carry out systematic functional training early on, improve the ability of ADL, and encourage the rehabilitation of physical and psychological health, which may additionally help to avoid secondary PSD and to improve the prognostic quality of life for patients.17
MRS Imaging Factors
With regard to the study of 1H-MRS imaging, major factors affecting the PSD model were the involvement of the left frontal lobe and left temporal lobe Cho/Cr, which were considered to be significantly associated with the occurrence of PSD in previous studies. Most scholars have agreed that depression is accompanied by regional Cho abnormalities in the brain,18 and research has reported Cho increase in depressed patients, suggesting that Cho complexes may have a depressive effect on the central nervous system. Cho, reflecting the total choline compounds reserve in the brain, is the precursor of acetylcholine, a neurotransmitter closely related to emotion and cognition, previously confirmed to be a pathophysiological foundation of affective disorder. In this study, the ratio of Cho/Cr in the brain of PSD patients was significantly higher than that in the brains of patients without PSD. These results suggested that the left prefrontal lobe and temporal hippocampus may show accelerated phospholipid metabolism and abnormal choline changes at the early stage of stroke, which also confirmed the predictive validity of this model. Another key indicator of 1H-MRS, the NAA/Cr of the frontal lobe and hippocampus, has been previously reported to be reduced in the brain of PSD patients5 revealing that NAA decrease may be involved in the occurrence of PSD. NAA is mainly distributed in neurons and their axons, is produced by the neuronal mitochondria, and is considered to be a crucial metabolic marker of neuronal integrity. Nevertheless, in this study, the NAA/Cr index of affective brain regions was not selected as a risk factor by the LASSO regression, probably because various nervous system diseases might lead to NAA/Cr decrease. That is, NAA/Cr is not as specific as Cho/Cr as a risk factor for PSD.
Besides the results of our study that the frontal-lobe and temporal-lobe (hippocampal) Cho/Cr can be used as predictors of PSD, it is worth mentioning that in this study, the Cho/Cr of the anterior cingulate gyrus, another structure closely related to emotion, was also entered in the LASSO regression as a risk factor. Unfortunately, 1H-MRS study on limbic system components such as the anterior cingulate gyrus and PSD has been rarely reported. Most scholars have supported that the gray matter volume of the anterior cingulate gyrus is decreased in patients with depression.19 It is also well reported that among the 1H-MRS imaging indexes of the anterior cingulate gyrus, the change in Glu/Cr is significantly correlated with a decrease in the HAMD score in patients with depression.20 From the perspective of anatomy, the cingulate gyrus is the main brain area for behavioral adjustment and adaptation to the environment, which is the common boundary between cognition and emotion. James Papez21 claimed that emotional regulation was concentrated in the deep structures of our brain and that emotional experience was determined by the close functional relationship between the limbic system, such as the cingulate gyrus, and brain regions such as the frontal lobe, amygdala, and temporal lobe. Based on the LASSO regression and correlation results, this prediction model selected the anterior cingulate-gyrus Cho/Cr as a risk factor of PSD, indicating that the anterior cingulate gyrus played a crucial role in the occurrence and development of neurological dysfunction, such as PSD, and also reflected the rigorous reliability of the model in screening for related factors.
Verification of PSD Prediction Model
The evaluation indexes of clinical prediction model mainly include model calibration and model discrimination.
Calibration focuses on the accuracy of the risk prediction value of the model, that is, the consistency between the probability of the event predicted by the model and the actual occurrence rate of the event. The consistency test between the predicted value and the actual value through the calibration plot found that the predicted probability of the nomogram for PSD correlates well with the actual occurrence rate.
The discrimination focuses on the model’s differential ability, which refers to the ability of the model to distinguish the objects with or without terminal events. As a well-differentiated prediction model, the risk score of the objects with terminal events and the risk score of the non-terminal-event objects will be as scattered as possible, but the model with low differentiation does not have such ability. AUC is one of the most commonly used statistical methods to measure discrimination. The AUC values for internal and external validation were 0.8635 and 0.8851, respectively, indicating that the model had good calibration and identification capabilities.
This study has a few limitations such as the small number of patients included, therefore, a larger sample size is required for further study. This study has not yet been terminated, and we will include more research objects that meet the criterion to strengthen the external verification of this risk prediction model. Furthermore, we will also use DTI, rfMRI and other multimodality MRI indicators to establish PSD risk prediction model. We will compare and improve the prediction models of multimodality MRI from the perspectives of convenience, accuracy and price.
Preventive intervention for PSD is a novel concept. The establishment of a PSD prediction model may be conducive to more effective early treatment of PSD, halting its progression and benefiting stroke patients.
Conclusion
The PSD prediction model based on the ADL score, initial NIHSS score, frontal-lobe Cho/Cr, temporal-lobe Cho/Cr, and anterior cingulate-gyrus Cho/Cr has clinical predictive value.
Acknowledgments
The study was financially supported by the National Natural Science Foundation of China (Grant No 81371461), Science-Technology Foundation of Education Bureau of Liaoning Province, China (Grant No JYTJCZR201903) and Youth Foundation of Education Bureau of Liaoning Province, China (Grant No JYTQN201707). The funding source had no other involvement. We would also like to thank Editage for English language editing.
Disclosure
The authors report no conflicts of interest in this work.
References
1. Köhler S, Hackett ML, O’Brien JT, Mead GE. Neuropsychiatric outcomes after stroke–authors’ reply. Lancet Neurol. 2014;13:1168–1169. doi:10.1016/S1474-4422(14)70226-1
2. Cai W, Mueller C, Li YJ, Shen WD, Stewart R. Post stroke depression and risk of stroke recurrence and mortality: a systematic review and meta-analysis. Ageing Res Rev. 2019;50:102–109. doi:10.1016/j.arr.2019.01.013
3. Stein LA, Goldmann E, Zamzam A, et al. Association between anxiety, depression, and post-traumatic stress disorder and outcomes after ischemic stroke. Front Neurol. 2018;9:890. doi:10.3389/fneur.2018.00890
4. Das J, Rajanikant GK. Post stroke depression: the sequelae of cerebral stroke. Neurosci Biobehav Rev. 2018;90:104–114. doi:10.1016/j.neubiorev.2018.04.005
5. Glodzik-Sobanska L, Slowik A, McHugh P, et al. Single voxel proton magnetic resonance spectroscopy in post-stroke depression. Psychiatr Res. 2006;148:111–120. doi:10.1016/j.pscychresns.2006.08.004
6. YuMei Z, Ning Z, Yun Z. Metabolism changes in internal brain of patients with stroke observed with magnetic resonance spectroscopy. Chin J Clin Rehabil. 2005;9(33):111–113.
7. Wang H, Zhang L, Liu Z, et al. Predicting medication nonadherence risk in a Chinese inflammatory rheumatic disease population: development and assessment of a new predictive nomogram. Patient Prefer Adherence. 2018;12:1757–1765. doi:10.2147/PPA.S159293
8. Wang X. Diagnostic of various cerebral vascular diseases. Chin J Neurol. 1996;029(006):379–380.
9. Chinese Medical Association. Chinese diagnostic and classification standard of mental disorders. Chin J Psychiatry. 2001;034(003):184–188.
10. Zhao M, Sui R, Ma H, et al. Clinical study on the changes of cerebellar magnetic resonance spectroscopy in patients with post-stroke depression. J Med People’s Liberation Army. 2016;41:484–491.
11. Wang Y, Jia YB, Ling XY, Liu SR, Huang L. A proton magnetic resonance spectroscopy imaging study on prefrontal lobe and hippocampus in patients with first-episode positive symptoms of schizophrenia. Chin J Psychiatry. 2011;44(03):135–139.
12. Qiao BB, Li JM, Kang ZM. Analysis of cerebral metabolisms by magnetic resonance spectroscopy in patients with post-stroke depression. Ner Injury Func Reconstion. 2017;3:228–230.
13. Daoyou Z, Yanting Z, Haifang Y, et al. Clinical studies on emotional disorder in patients after acute stroke. J Guangzhou Univ Tradit Chin Med. 2005;022(002):109–113.
14. Chukhlovina ML, Chukhlovin AA. Assessment of clinical manifestations and treatment of post-stroke depression in young patients with ischemic stroke. Vserossiiskoe Obshchestvo Psikhiatrov. 2018;118(3):52–55.
15. Chemerinski E, Robinson RG, Kosier JT. Improved recovery in activities of daily living associated with remission of poststroke depression. Stroke. 2001;32:113–117. doi:10.1161/01.STR.32.1.113
16. Wei H, Cheng Y. Research progress on the pathogenesis of post-stroke depression. Nerv Injury Func Rehabil. 2014;9:335–336.
17. Kim ES, Kim JW, Kang HJ, et al. Longitudinal impact of depression on quality of life in stroke patients. Psychiatry Investig. 2018;15(2):141–146. doi:10.30773/pi.2017.10.11
18. Shuming Z, Shunkai L. A 1H magnetic resonance spectroscopy imaging study on the working memory and brain biochemical metabolism in untreated obsessive-compulsive disorder patients comorbid with and without major depressive disorder. Chin J Psychiatry. 2018;51(5):316–321.
19. Tang Y, Kong L, Wu F, Xie G. Anterior cingulate and amygdala volume changes in first-episode, medication naive females with major depressive disorder: a voxel-based morphometric MRI study. Chin J Behavl Med Brain Sci. 2011;20:525–527.
20. Auer DP, Pütz B, Kraft E, Lipinski B, Schill J, Holsboer F. Reduced glutamate in the anterior cingulate cortex in depression: an in vivo proton magnetic resonance spectroscopy study. Biol Psychiatry. 2000;47:305–313. doi:10.1016/S0006-3223(99)00159-6
21. Houston JR, Hughes ML, Lien MC. An electrophysiological study of cognitive and emotion processing in Type I chiari malformation. Cerebellum. 2018;17(4):404–418.
 © 2020 The Author(s). This work is published and licensed by Dove Medical Press Limited. The
full terms of this license are available at https://www.dovepress.com/terms
and incorporate the Creative Commons Attribution
- Non Commercial (unported, 3.0) License.
By accessing the work you hereby accept the Terms. Non-commercial uses of the work are permitted
without any further permission from Dove Medical Press Limited, provided the work is properly
attributed. For permission for commercial use of this work, please see paragraphs 4.2 and 5 of our Terms.
© 2020 The Author(s). This work is published and licensed by Dove Medical Press Limited. The
full terms of this license are available at https://www.dovepress.com/terms
and incorporate the Creative Commons Attribution
- Non Commercial (unported, 3.0) License.
By accessing the work you hereby accept the Terms. Non-commercial uses of the work are permitted
without any further permission from Dove Medical Press Limited, provided the work is properly
attributed. For permission for commercial use of this work, please see paragraphs 4.2 and 5 of our Terms.