Back to Journals » Cancer Management and Research » Volume 11
Construction of a GLUT-1 and HIF-1α gene knockout cell model in HEp-2 cells using the CRISPR/Cas9 technique
Authors Lu ZJ, Yu Q, Zhou SH ![]() , Fan J, Shen LF, Bao YY, Wu TT, Zhou ML, Huang YP
, Fan J, Shen LF, Bao YY, Wu TT, Zhou ML, Huang YP ![]()
Received 14 August 2018
Accepted for publication 15 January 2019
Published 8 March 2019 Volume 2019:11 Pages 2087—2096
DOI https://doi.org/10.2147/CMAR.S183859
Checked for plagiarism Yes
Review by Single anonymous peer review
Peer reviewer comments 2
Editor who approved publication: Dr Antonella D'Anneo
Zhong-Jie Lu,1 Qi Yu,2 Shui-Hong Zhou,2 Jun Fan,3 Li-Fang Shen,2 Yang-Yang Bao,2 Ting-Ting Wu,2 Min-Li Zhou,2 Ya-Ping Huang3
1Department of Radiotherapy, 2Department of Otolaryngology, 3State Key Laboratory for Diagnosis and Treatment of Infectious Diseases, The First Affiliated Hospital, College of Medicine, Zhejiang University, Hangzhou, Zhejiang 310003, P.R. China
Background: Glucose transporter (GLUT)-mediated glucose uptake is an important process in the development of laryngeal carcinoma, one of the most common malignancies of the head and neck. GLUT-1, together with HIF-1α, is also an indicator of hypoxia. Both proteins play a critical role in glucose uptake and glycolysis in laryngeal carcinoma cells under hypoxic stress. A double gene knockout model in which HIF-1α and GLUT-1 are no longer expressed can provide important information about carcinogenesis in laryngeal carcinoma.
Purpose: In this study we used the CRISPR/Cas 9 system to induce HIF-1α and GLUT-1 double gene knockout in HEp-2 cells and then used the knocked-out cells to study the role of these markers in laryngeal carcinoma, including in chemo-radioresistance.
Methods: High-grade small-guide RNAs (sgRNAs) of HIF-1α and GLUT-1 were designed using an online tool and inserted into the pUC57-T7-gRNA vector. The recombinant plasmids were transfected into HEp-2 cells and positive cells were screened using the dilution method. Gene mutation and expression were determined by sequence analysis and immunoblotting.
Results: In HIF-1α and GLUT-1 double gene knockout HEp-2 cells, a 171-bp deletion in the HIF-1α genomic sequence was detected, whereas multiple base insertions resulted in frameshift mutations in the GLUT-1 gene. Neither HIF-1α nor GLUT-1 protein was expressed in positive cells. The proliferation, migration, and invasion of HEp-2 cells were significantly decreased afterward. The possible mechanism may be that the inhibition PI3K/AKT/mTOR pathway by HIF-1α and GLUT-1 double gene knockout using CRISPR/Cas9 technique lead to reduction of glucose uptake and lactic acid generation.
Conclusion: Our HIF-1α and GLUT-1 double gene knockout HEp-2 cell model, obtained using a CRISPR/Cas9-based system, may facilitate studies of the pathogenesis of laryngeal carcinoma.
Keywords: CRISPR, Cas9 system, glucose transporter-1, HEp-2 cells, hypoxia-inducible factor-1α, PI3K, AKT, mTOR pathway, laryngeal carcinoma
Introduction
Glucose transporter-1 (GLUT-1) and hypoxia-inducible factor-1α (HIF-1α) are common markers of cell hypoxia, and their high-level expression has been related to the biological behaviors of several types of cancer. In a previous study, we described the overexpression of HIF-1α and GLUT-1 in laryngeal carcinoma1 and the positive correlation between these two markers. High-level HIF-1α and GLUT-1 expression is also related to the poor survival of patients with laryngeal carcinoma. Moreover, the abnormal expression of HIF-1α and GLUT-1 may be a major factor in chemo-radioresistance, which implies that the inhibition of HIF-1α and GLUT-1 contributes to chemo-radiosensitivity.2–5
In experiments using traditional methods such as antisense oligodeoxynucleotides or siRNA, the inhibition efficiency of HIF-1α or GLUT-1 is not significant, perhaps because neither technique alters the DNA sequence of the target gene but instead results only in a knockdown effect. The recently developed genome editing system CRISPR (clustered regularly interspaced short palindromic repeat)/Cas (CRISPR-associated proteins) has been rapidly adopted and currently consists of three systems (CRISPR I–III) specific for different organisms. Of these, the type II CRISPR–Cas 9 system offers the most efficient gene-targeting technology. Its advantage includes multigene knockout of homologous and paralogous genes, thus yielding stable mutant cell lines or experimental animals or plants with permanently knocked-out genes.6
In this study, we used the CRISPR/Cas 9 system to induce HIF-1α and GLUT-1 double gene knockout in HEp-2 cells and then used the knocked-out cells to study the role of these markers in laryngeal carcinoma, including proliferation, migration, invasion, and change of energy supply.
Materials and methods
Ethics statement
The Institutional Review Board of The First Affiliated Hospital, College of Medicine, Zhejiang University (Hangzhou, Zhejiang, P.R. China), approved the study.
Construction of small-guide RNA (sgRNA)
A pair of HIF-1α and GLUT-1 oligo-DNAs consisting of ~20 nucleotide-specific target sequences was designed based on the target DNA using the online tool http://crispr.mit.edu/ (CRISPR Design of Massachusetts Institute of Technology) and http://www.e-crisp.org/E-CRISP/index.html (E-Crisp of Cancer center of Germany). The sgRNAs included Glut-1-sgRNA-L, Glut-1-sgRNA-R, HIF-1α-sgRNA-L, and HIF-1α-sgRNA-R (Table 1). The pUC57-T7-gRNA vector was digested using BasI, after which each of the above sgRNAs was inserted into the pUC57-T7-gRNA plasmid. Construction of the pUC57-HIF-1α-gRNA and pUC57-Glut-1-gRNA plasmids with two gRNA target DNA sequences against HIF-1α or Glut-1 was confirmed by sequencing. The plasmids were then used to transform HEp-2 cells, and single clones were selected, sequenced, and identified. The purified plasmids were stored at −20°C.
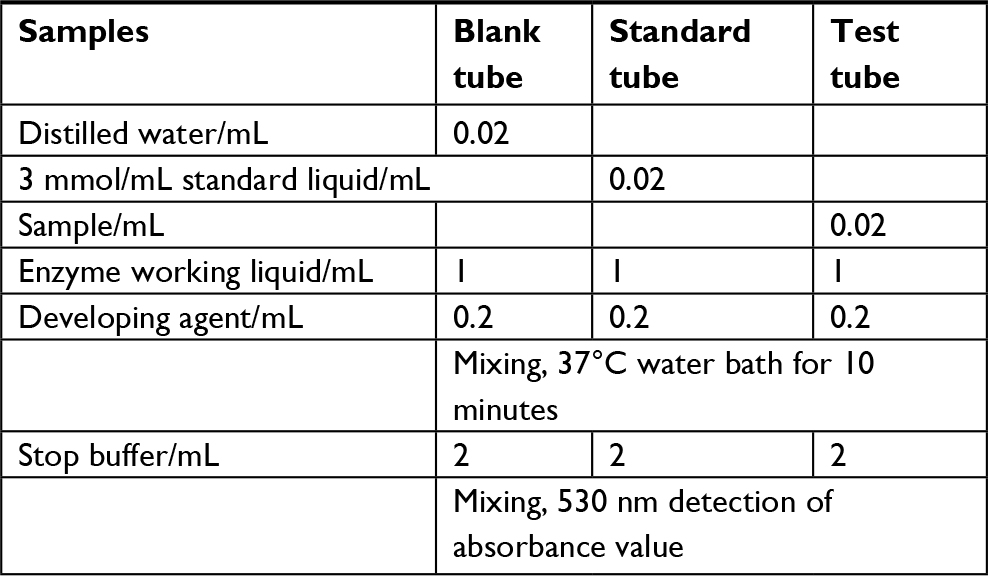
 | Table 1 Added samples of glucose detection Notes: The samples were mixed well and reacted at room temperature for 15 minutes. The absorbency of each tube was measured at 340nm. |
Cell transfection and cell line construction
HEp-2 cells were purchased from the American Type Culture Collection and cultured in RPMI1640 medium containing 10% fetal calf serum. The following plasmids were cotransfected in the indicated amounts into 3×10⁵ cells in 6-well plates using 8 µL Lip2000 (Invitrogen): 4 µg Glut-1-sgRNA-L, 4 µg Glut-1-sgRNA-R, 4 µg HIF-1α-sgRNA-L, 4 µg HIF-1α-sgRNA-R, and 4 µg Cas9 nickase expression plasmid. After 24 hours, the transfected cells were trypsinized, harvested, and resuspended to a concentration of 10 cells/mL. A 100 µL aliquot of the cell suspension was used to seed a 96-well plate with 1 cell/well.
Positive cells were screened by labeling the single cells in the 96-well plate. The cells were then either digested in the primary well or transferred to a larger culture plate (96-well plate → 24-well plate → 6-well plate → 6 cm culture dish → 10 cm culture dish) where they formed a sphere. The cells were used in genome/protein extraction and in the determination of knockout efficiency.
Whole-cell genome extraction
Positive cells were collected and washed twice with PBS. After centrifugation, the supernatant was discarded and 400 µL of lysis buffer (10 mM Tris–HCl pH 8.0, 150 mM NaCl, 10 mM EDTA, 4 g SD/L, 100 mg proteinase K/L) was added to the resuspended cell pellet. After incubation for 12–24 hours at 37°C, the lysed cells were treated with 450 µL of phenol. The samples were then centrifuged for 10 minutes at 12,000 rpm; the upper phase was transferred into a new centrifuge tube and 450 µL of chloroform:isoamyl alcohol (24:1) was added. After centrifugation of the mixtures at 12,000 rpm for 10 minutes, the upper (aqueous) phase was discarded. The precipitate in the lower phase was resuspended in 3 M sodium acetate (1:10 v:v, pH 5.2) and absolute ethyl alcohol (2.5 volumes), mixed gently, and allowed to stand at 20°C for 1 hour. After a final centrifugation at 12,000 rpm for 10 minutes, the purified DNA was washed with 70% ethyl alcohol, resuspended in 50 µL of sterilized water, and stored at 20°C.
PCR amplification and sequencing
PCR amplification was performed using the primers listed in Table 2 to detect GLUT-1 and HIF-1α sequences in positive cells. The amplification conditions were as follows: 94°C for 5 minutes, 35 cycles of 94°C for 30 seconds, 60°C for 30 seconds, 72°C for 45 seconds, and then 72°C for 5 minutes. The amplification products were further identified by TA cloning and sequencing.
 | Table 2 Added samples of lactic acid detection Note: Content of lactic acid = (testing OD–blank OD)/(standard OD–blank OD) × concentration of standard substance. |
Western blots
The collected cells were washed twice with PBS and then lysed with lysis buffer at 4°C (on ice). After centrifugation at 12,000 rpm for 30 minutes, total cell protein was quantified and the lysates were stored at −80°C. For sample analysis, 30 µg of protein was mixed in 4× SDS loading buffer, boiled for 5–10 minutes, centrifuged for 1 minute, and loaded into the wells of an 8% polyacrylamide gel. Prestained markers were loaded in parallel. The gel was placed in a Tanon VE-180 vertical electrophoresis tank and run at 80 V for 30 minutes and 120 V for 70 minutes. After electrophoresis, the proteins were transferred to a PVDF membrane using transfer buffer and the membrane was then immersed in methyl alcohol. Transfer was performed in a Tanon VE-180 vertical electrophoresis tank (220 mA for 90 minutes). Thereafter, the PVDF membrane was placed in blocking buffer for 1 hour, after which it was washed three times with PBST before being incubated in primary antibody against GLUT-1 (1:1,000) and HIF-1α (1:1,000) for 24 hours at 4°C. β-Actin served as the internal control. The blots were washed three times with PBST, incubated in secondary antibody (1:5,000) for 2 hours at room temperature, and washed again with phosphate buffered saline Tween-20 (PBST). Band signals were determined using the electrochemiluminescence (ECL) substrate and chemiluminescence.
Groups
Control group: HEp-2 cell.
Experiment group: HEp-2 cell with HIF-1α and GLUT-1 double gene knockout.
Cell proliferation assays using CCK-8 method
Briefly, cells in each group were cultured in 96-well plates for 0, 24, 48, and 72 hours in a humidified atmosphere containing 5% CO2 at 37°C. Subsequently, cell counting kit (CCK) reaction solution (10 µL) was added and the cells were maintained in the dark for 2 hours. The absorption of each well was measured at 450 nm using a Spectra Plus microplate reader (Molecular Devices Co., Sunnyvale, CA, USA). The relative cell inhibition rate (%) was calculated as follows: 100% − (sample absorption/control mean absorption) ×100%.
Transwell assays for cell migration or invasion experiment
Briefly, Matrigel (CoStar Inc.) was melted at 4°C overnight and diluted to 50 mg/L with serum-free medium at 4°C. Subsequently, 50 µL of the diluted Matrigel was added to the center of a Transwell chamber (CoStar Inc.) and incubated at 37°C for 4 hours. A cell suspension was prepared as follows: the cells were initially digested and centrifuged (800 rpm, 5 minutes); the medium was discarded; the cells were washed twice with 1× PBS; the resuspended cells were cultured in serum-free medium; and the cell density was adjusted to 1×10⁶/mL. Subsequently, 200 µL of the cell suspension was added to the upper chamber and incubated for 24 hours. The chamber was removed and 600 µL of 4% polyoxymethylene was added; the cells were fixed at room temperature for 30 minutes. The chamber was removed, washed twice with 1× PBS, placed in 100% methyl alcohol, and the cells were fixed at room temperature for 30 minutes. The chamber was placed into a well containing 800 µL of Giemsa or 2% crystal violet staining solution at room temperature for 20 minutes. The chamber was washed with 1× PBS and the upper cells were wiped with a wet swab. The cells were counted and photographs were captured using an inverted microscope.
Glucose detection
One hundred microliters of culture medium were collected before or after 24-hour cell culture. The samples were added according to Table 1.
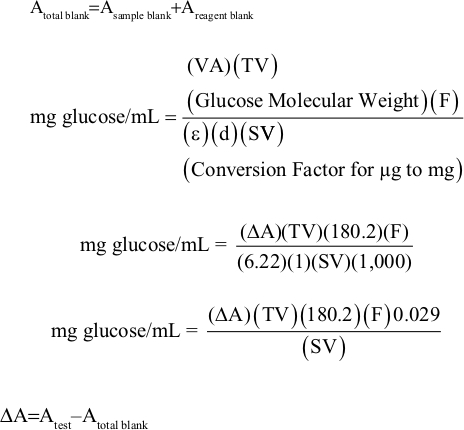 |
TV, total assay volume (ml); SV, sample volume (ml); glucose MW, 180.2 g/mole or equivalently 180.2 µg/µmoles; F, dilution factor from sample preparation; ε, millimolar extinction coefficient for NADH at 340 nm; millimolar-1 cm-1 or equivalently (ml/µmole)(1/cm); d, light path (cm) = 1 cm; 1,000, conversion factor for µg to mg.
Detection of lactic acid
One hundred microliters of culture medium were collected before or after 24-hour cell culture. The samples were added according to Table 2.
Western blots
The methods were same as the above-described Western blot method.
Results
Positive HEp-2 cell clone screening of HIF-1α and GLUT-1 double gene knockout
Two pairs of sgRNAs against HIF-1α and GLUT-1 genes were designed using an online tool. As shown in Figure 1, two fragments, consisting of sgRNAs in exon 3 of the GLUT-1 gene and exon 2 of the HIF-1α gene, were screened. The sgRNA sequences are presented in Table 3. Following the insertion of these sgRNAs into the pUC57-T7 vector, the recombinant plasmids pUC57-HIF-1α-gRNA and pUC57-Glut-1-gRNA were transfected into HEp-2 cells. The whole genome of positive cell clones, obtained by the dilution method, was used to sequence HIF-1α and GLUT-1 genes by PCR amplification and TA cloning.
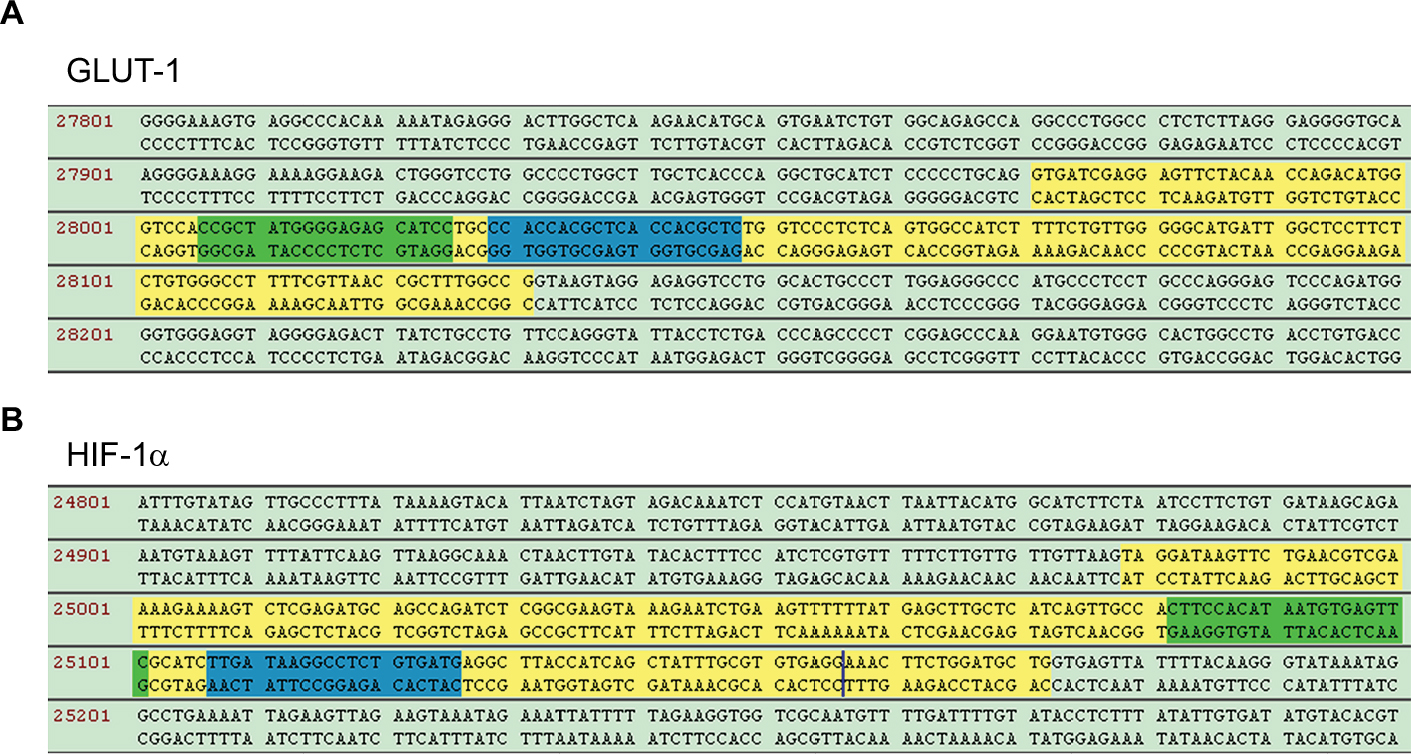 | Figure 1 sgRNAs design of HIF-1α and GLUT-1 genomic region. Notes: (A) GLUT-1 sgRNAs were designed to specially identify exon 3 of the GLUT-1 genomic region. Yellow: exon 3; green: sgRNA-L; blue: sgRNA-R. (B) HIF-1α sgRNAs were designed to specially identify exon 2 of the HIF-1α genomic region. Yellow: exon 2; green: sgRNA-L; blue: sgRNA-R. Abbreviations: GLUT, glucose transporter; HIF-1α, hypoxia-inducible factor-1α; sgRNAs, small-guide RNAs. |
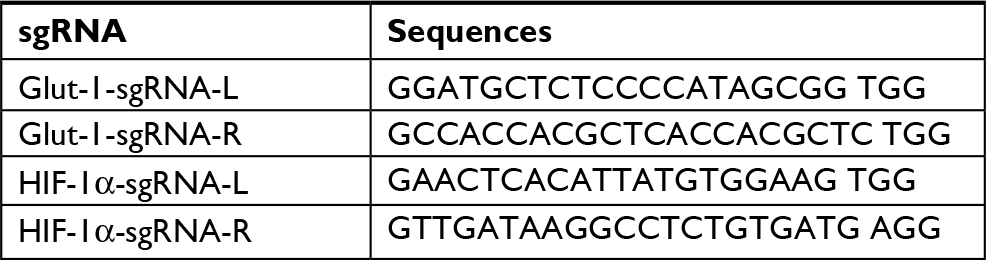 | Table 3 sgRNA sequences of GLUT-1 and HIF-1α Abbreviations: GLUT, glucose transporter; HIF-1α, hypoxia-inducible factor-1α; sgRNAs, small-guide RNAs. |
PCR and whole-genome sequencing in HIF-1α and GLUT-1 double gene knockout HEp-2 cells
Genomic DNA PCR products from each cell mass were cloned into a plasmid to analyze the genomic region of the targeted HIF-1α and GLUT-1 genes. The PCR primers are listed in Table 4. Only the HIF-1α and GLUT-1 genomic region was amplified because the PCR primers spanned the respective targeted regions, which were unique to HIF-1α, GLUT-1, and their pseudogenes. Amplicon sequence analyses indicated that the GLUT-1 gene harbored frameshift mutations mediated by the insertion of 7, 74, 96, and 106 bp (Figure 2), while 171 bp deletions in the targeted genomic region, including an 82 bp deletion in exon 2, were detected in the HIF-1α gene. All analyzed sequences from the transfected cell clones exhibited the same deletions in the HIF-1α genomic region (Figure 3). These results confirmed the establishment of double gene knockout HEp-2 cells, carrying missense mutations of HIF-1α and frameshift mutations of GLUT-1, using CRISPR/Cas9 technology.
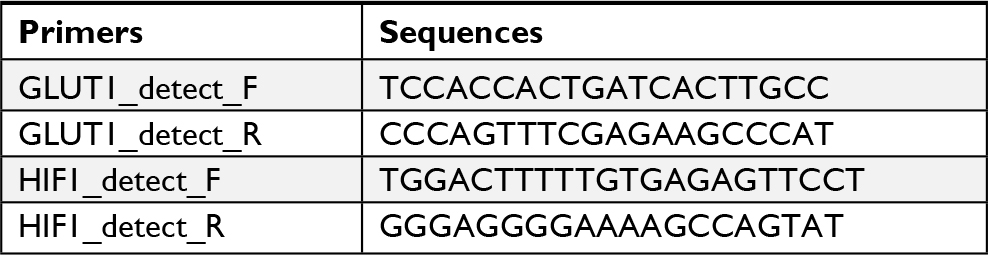 | Table 4 Primers of Glut-1 and HIF-1α Abbreviations: GLUT, glucose transporter; HIF-1α, hypoxia-inducible factor-1α. |
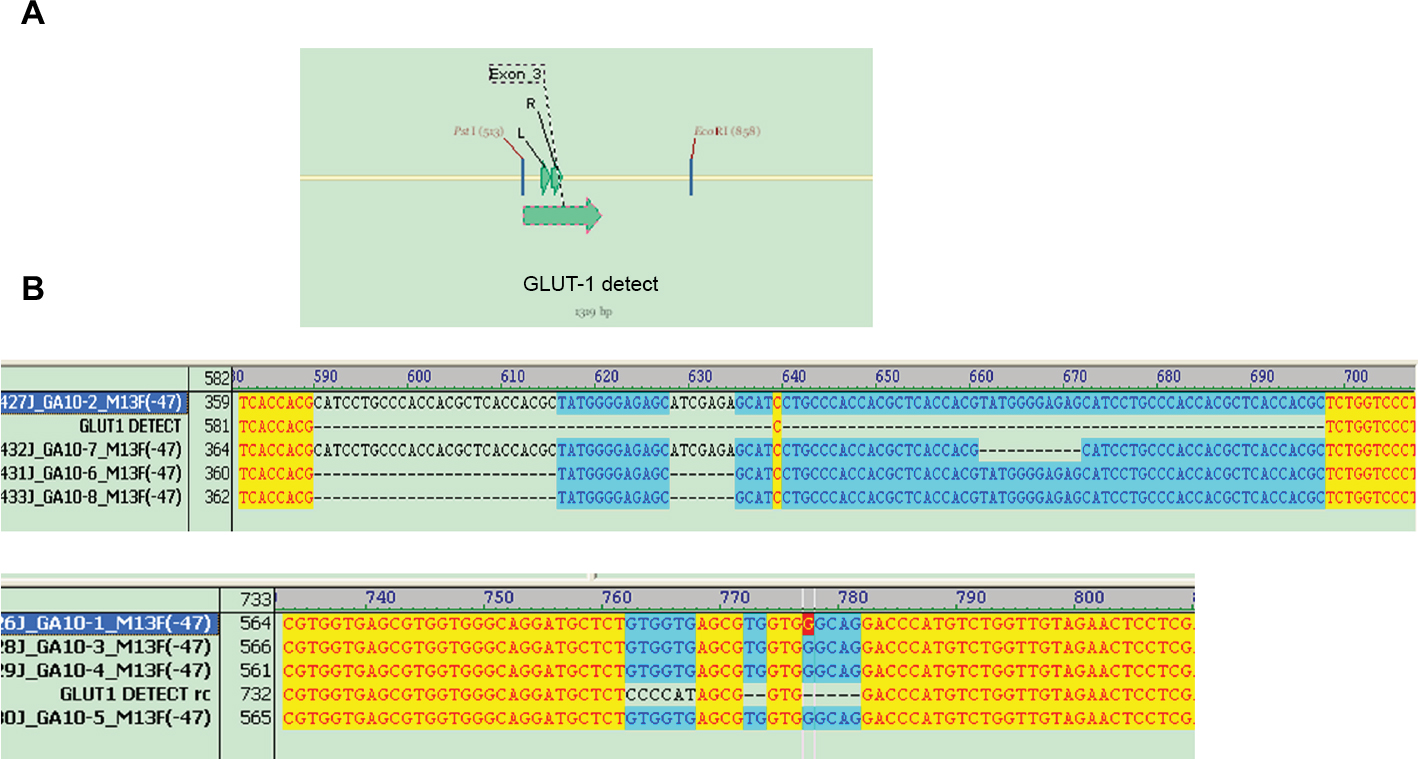 | Figure 2 Mutation sequence of GLUT-1 in positive cells. Notes: (A) Schematic diagram of the GLUT-1 sgRNAs generated via the CRISPR/Cas9 system. (B) TA clone sequence of the PCR amplification products from the GLUT-1 genomic region. Abbreviations: GLUT, glucose transporter; sgRNAs, small-guide RNAs. |
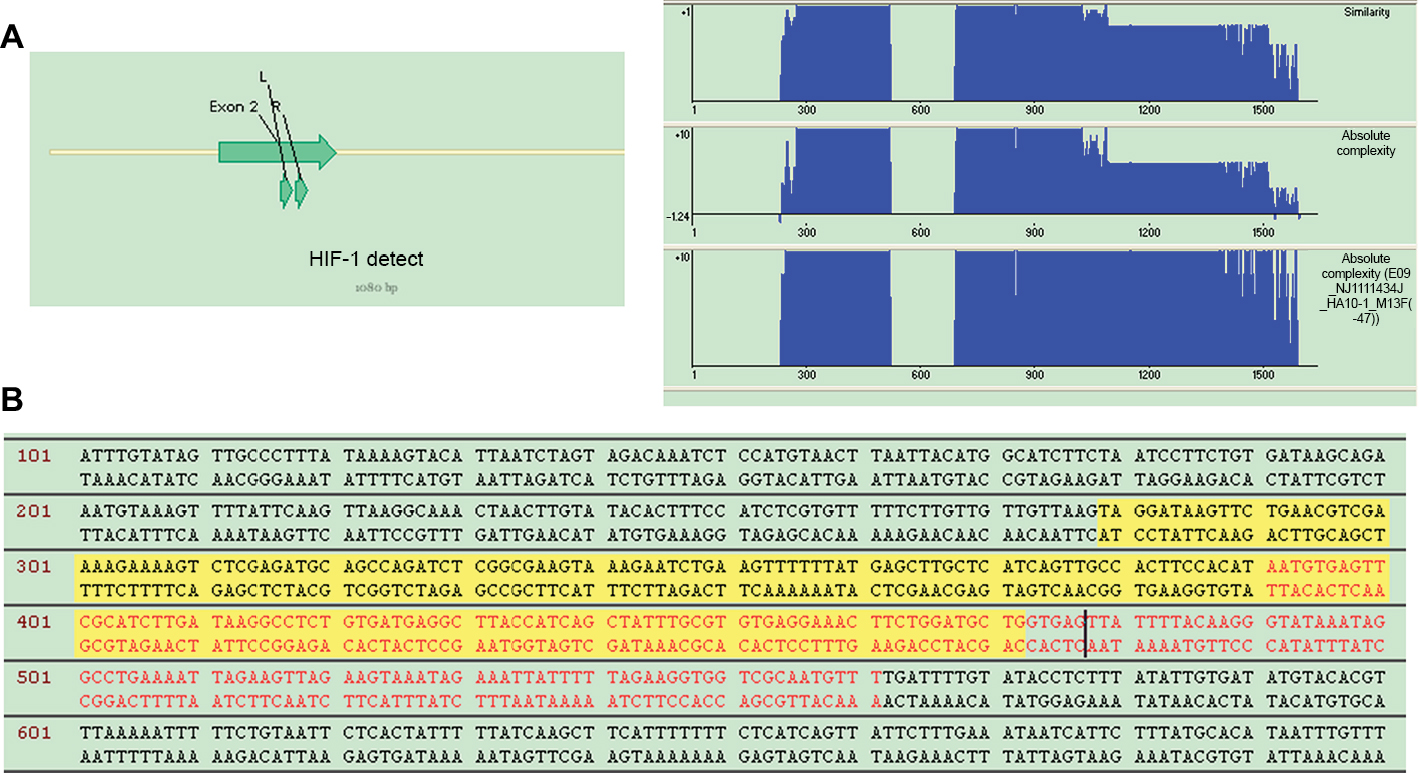 | Figure 3 Mutation sequence of HIF-1α in positive cells. Notes: (A) Schematic diagram of the HIF-1α sgRNAs generated via the CRISPR/Cas9 system. (B) TA clone sequence of the PCR amplification products from the HIF-1α genomic region. Abbreviations: HIF-1α, hypoxia-inducible factor-1α; sgRNAs, small-guide RNAs. |
Knockout efficiency determination by immunoblotting of HIF-1α and GLUT-1 double gene knockout cells
To further evaluate the knockout efficiency obtained with the CRISPR/Cas9 system, the protein levels of HIF-1α and GLUT-1 in the transfected HEp-2 cells were analyzed by immunoblotting. Before HIF-1α and GLUT-1 double gene knockout, the expression levels of the HIF-1α and GLUT-1 protein in HEp-2 cells were 0.7074±0.0954 and 1.2746±0.1856, respectively. After HIF-1α and GLUT-1 double gene knockout, the expression levels of the HIF-1α and GLUT-1 protein in HEp-2 cells were 0.0155±0.0045 and 0.0307±0.00810, respectively. There was a significantly decreased HIF-1α and GLUT-1 after HIF-1α and GLUT-1 double gene knockout compared with before HIF-1α and GLUT-1 double gene knockout (P<0.001, respectively; Figure 4). The GLUT-1 and HIF-1α gene double knockout model in HEp-2 cells may contribute to functional analyses of these markers of cellular hypoxia in HEp-2 cells and in laryngeal carcinoma.
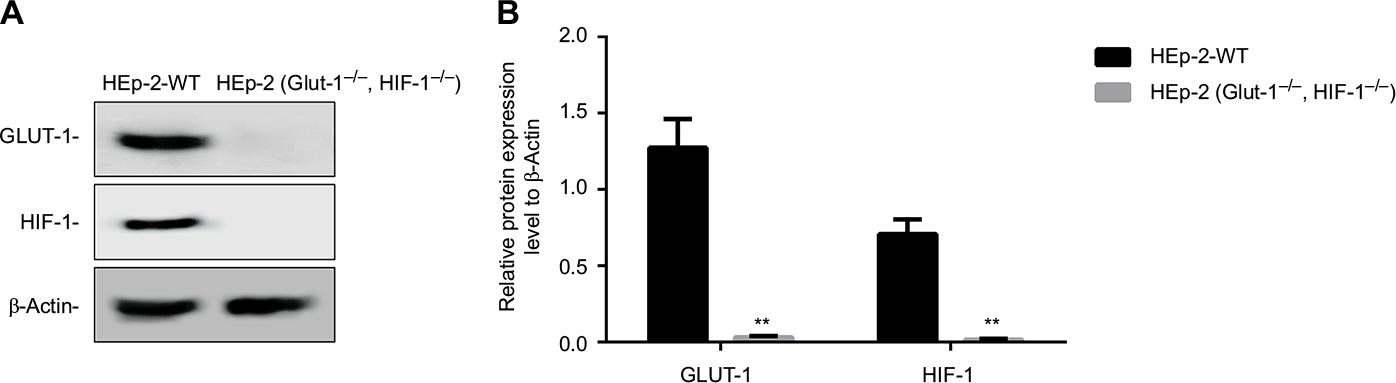 | Figure 4 Measurement of HIF-1α and GLUT-1 expression in positive cells by immunoblotting. Notes: (A) The results of Western blot. (B) There was a significantly decreased HIF-1α and GLUT-1 protein after HIF-1α and GLUT-1 double gene knockout compared with before HIF-1α and GLUT-1 double gene knockout (P<0.001, respectively). HEp-2-WT: control cells. β-Actin served as the internal control. **P<0.001. Abbreviations: GLUT, glucose transporter; HIF-1α, hypoxia-inducible factor-1α. |
Effects of HIF-1α and GLUT-1 double gene knockout on proliferation of HEp-2 cells
Before HIF-1α and GLUT-1 double gene knockout using the CRISPR/Cas9, the CCK-8 results showed proliferation rates of 0.2347±0.0091, 0.3260±0.0314, 0.4237±0.0201, and 0.5963±0.0372 after 0-, 24-, 48-, and 72-hour culture, respectively. There was no significant difference as the culture time increased. After HIF-1α and GLUT-1 double gene knockout using the CRISPR/Cas9, the CCK-8 results showed proliferation rates of 0.2387±0.0081, 0.2707±0.0135, 0.3457±0.0389, and 0.4143±0.0444 after 0-, 24-, 48-, and 72-hour culture, respectively. There was a significantly reduced proliferation rate at 24-, 48-, and 72-hour culture after HIF-1α and GLUT-1 double gene knockout compared with before HIF-1α and GLUT-1 double gene knockout (P=0.049, P=0.037, and P=0.006, respectively; Figure 5).
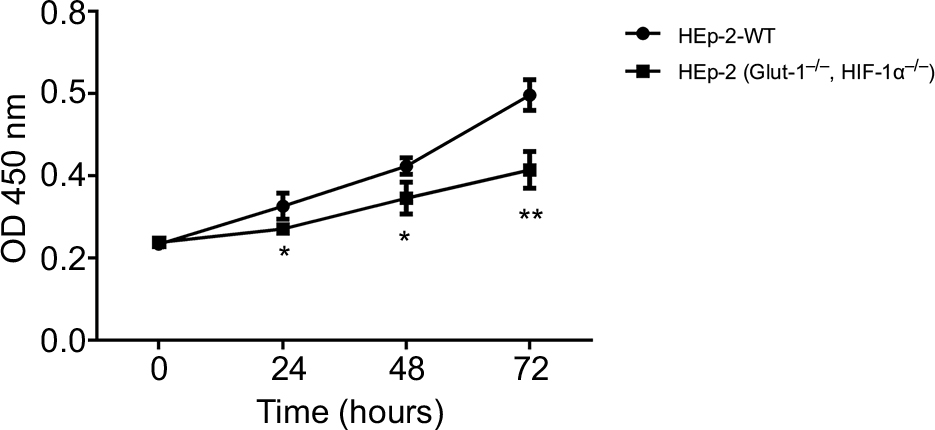 | Figure 5 Effects of HIF-1α and GLUT-1 double gene knockout on proliferation of HEp-2 cells detected by CCK-8. Note: *P<0.05, **P<0.01. Abbreviations: CCK-8, cell counting kit-8; GLUT, glucose transporter; HIF-1α, hypoxia-inducible factor-1α. |
Effects of HIF-1α and GLUT-1 double gene knockout on the migration or invasive capacity of HEp-2 cells
The migration or invasive capacity was assessed by Transwell assays. The migration or invasive capacities of cells were significantly lower after HIF-1α and GLUT-1 double gene knockout compared with before HIF-1α and GLUT-1 double gene knockout (Figure 6).
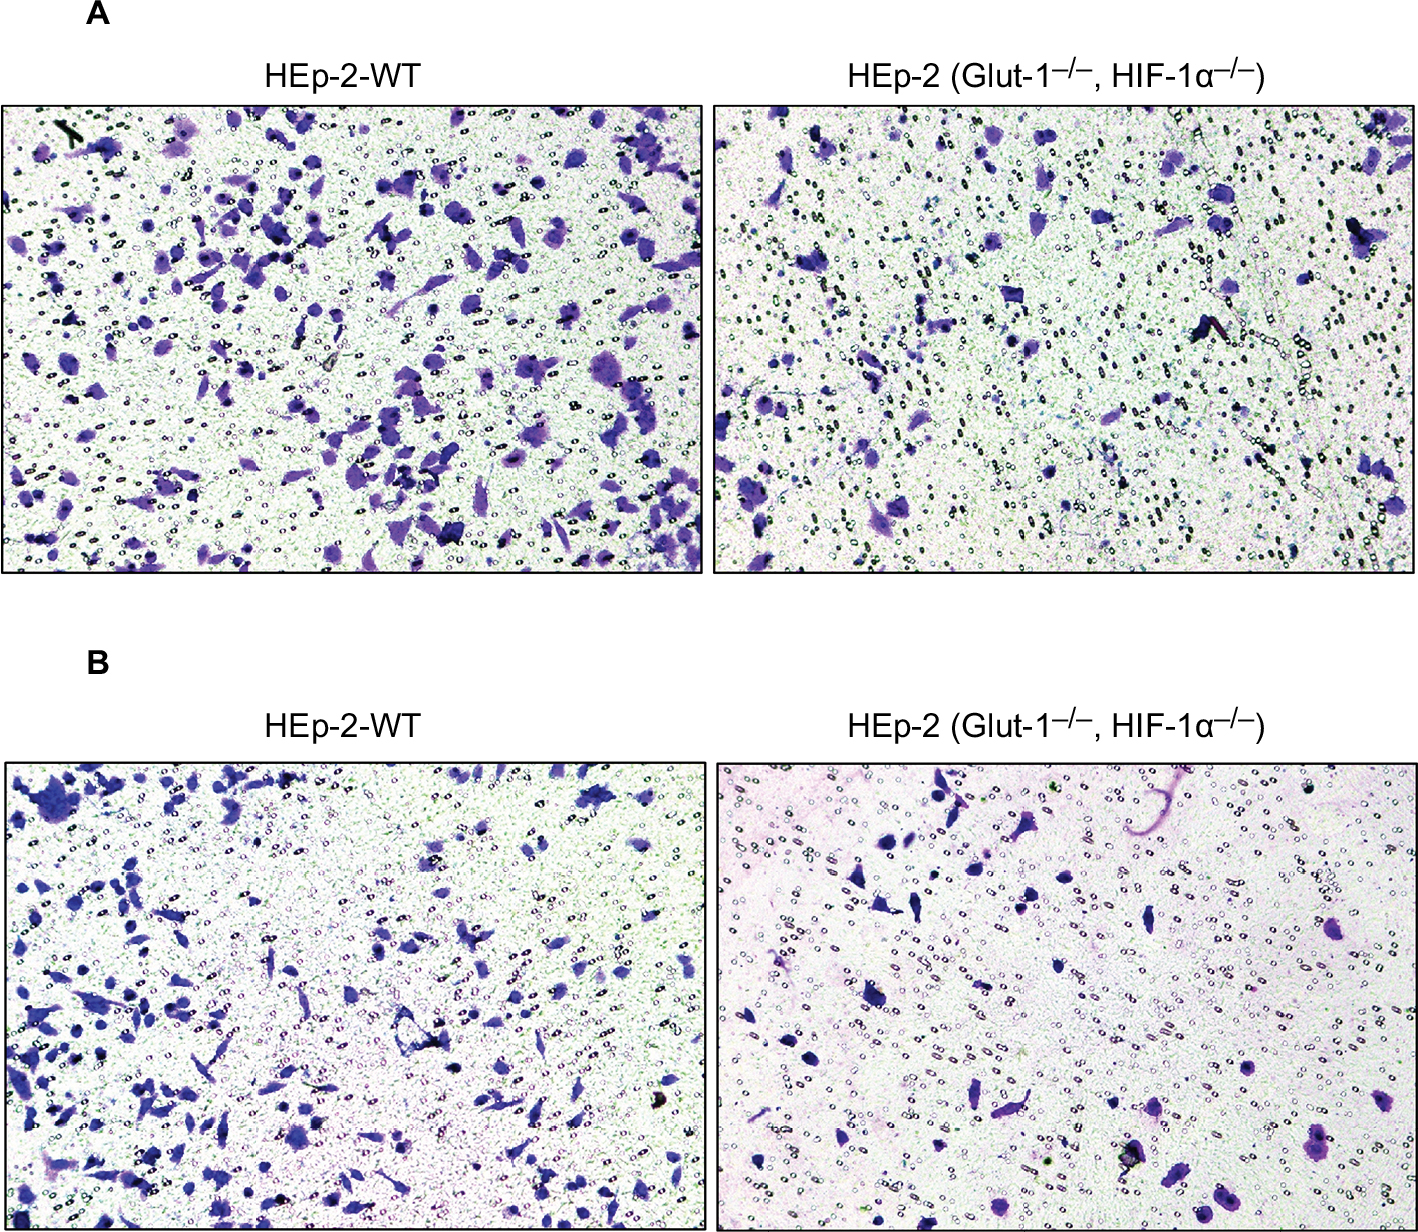 | Figure 6 Effects of HIF-1α and GLUT-1 double gene knockout on the migration or invasive capacity of HEp-2 cells assessed by Transwell assays. Notes: (A) The migration capacities of cells were significantly lower after HIF-1α and GLUT-1 double gene knockout compared with before HIF-1α and GLUT-1 double gene knockout. (B) The invasive capacities of cells were significantly lower after HIF-1α and GLUT-1 double gene knockout compared with before HIF-1α and GLUT-1 double gene knockout. Abbreviations: GLUT, glucose transporter; HIF-1α, hypoxia-inducible factor-1α. |
Effects of HIF-1α and GLUT-1 double gene knockout on glucose uptake and lactic acid generation of HEp-2 cells
Before HIF-1α and GLUT-1 double gene knockout, glucose uptake and lactic acid generation of HEp-2 cells was 2.07±0.22 and 4.65±0.94, respectively. After HIF-1α and GLUT-1 double gene knockout, glucose uptake and lactic acid generation of HEp-2 cells was 1.00±0.25 and 2.22±0.22, respectively. There was a significantly reduced glucose uptake and lactic acid generation after HIF-1α and GLUT-1 double gene knockout compared with before HIF-1α and GLUT-1 double gene knockout (P=0.005 and P=0.012, respectively; Figure 7).
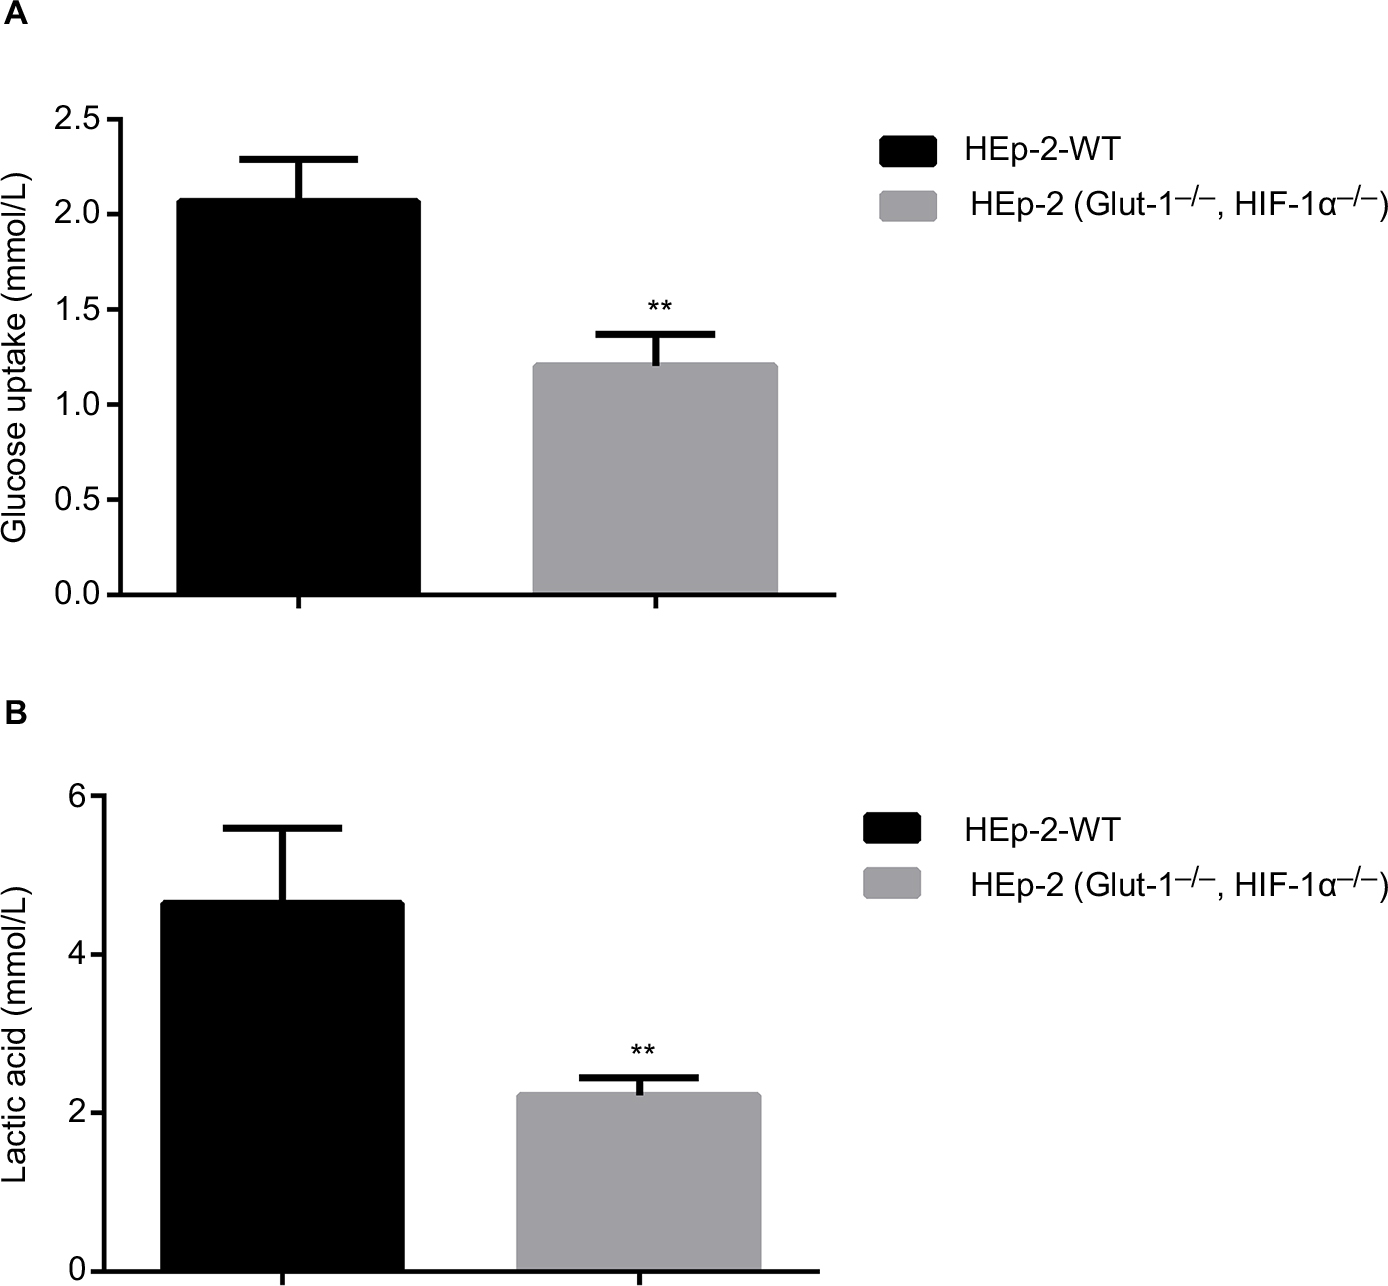 | Figure 7 Effects of HIF-1α and GLUT-1 double gene knockout on glucose uptake and lactic acid generation of HEp-2 cells. Notes: There was a significantly reduced glucose uptake (A) and lactic acid generation (B) after HIF-1α and GLUT-1 double gene knockout compared with before HIF-1α and GLUT-1 double gene knockout (P=0.005 and P=0.012, respectively). **P<0.01. Abbreviations: GLUT, glucose transporter; HIF-1α, hypoxia-inducible factor-1α. |
Effects of HIF-1α and GLUT-1 double gene knockout on PI3K/Akt/mTOR pathway
Before HIF-1α and GLUT-1 double gene knockout, the expression levels of the PTEN, p-PI3K, PI3K, p-AKT, AKT, and mTOR protein in HEp-2 cells were 0.7467±0.1250, 0.7000±0.0500, 0.8167±0.0451, 0.5033±0.0306, 0.4167±0.03511, and 0.4933±0.0586, respectively. After HIF-1α and GLUT-1 double gene knockout, the expression levels of the PTEN, p-PI3K, PI3K, p-AKT, AKT, and mTOR protein in HEp-2 cells were 1.1567±0.0076, 0.4167±0.0702, 0.6500±0.0793, 0.2300±0.0458, 0.2900±0.0557, and 0.2433±0.0603, respectively. There was a significantly increased expression of PTEN and decreased p-PI3K, PI3K, p-AKT, AKT, and mTOR protein after HIF-1α and GLUT-1 double gene knockout compared with before HIF-1α and GLUT-1 double gene knockout (P=0.008, P=0.005, P=0.03, P=0.001, P=0.029, and P=0.007, respectively; Figure 8).
 | Figure 8 Effects of HIF-1α and GLUT-1 double gene knockout on PI3K/Akt/mTOR pathway detected by Western blots. Notes: (A) The results of Western blot. (B) There was a significantly increased relative expression of PTEN and decreased p-PI3K, PI3K, p-AKT, AKT, and mTOR protein after HIF-1α and GLUT-1 double gene knockout compared with before HIF-1α and GLUT-1 double gene knockout (P=0.008, P=0.005, P=0.03, P=0.001, P=0.029, and P=0.007, respectively). |
Discussion
Genome editing of human cells can facilitate functional analyses of gene variants involved in human disease pathology.7 The recently developed CRISPR/Cas9 system has evolved into an effective tool for genome editing and gene function analysis in a great variety of diseases, especially cancer.
Malignant cancer cells are characterized by increased glucose uptake, with high fluorodeoxyglucose (FDG) uptake by the tumor indicative of a poor prognosis in patients with head and neck cancers and laryngeal carcinoma.1,8 GLUT-1 modulates the cellular influx of glucose9 and is the main glucose transporter in several types of solid carcinomas. It has thus become a frequent focus of cancer research.10 Cancer cells are under hypoxic stress, which causes them to mobilize glucose uptake to provide energy for cell proliferation.11 GLUT-1 therefore serves as an intrinsic marker of hypoxia in cancer cells.12 HIF-1α, as a hypoxia response gene, promotes GLUT-1 expression12,13 via the PI3K/AKT signaling pathway, as also demonstrated during FDG uptake.14 In most types of cancers, GLUT-1 and HIF-1α cooperate to accelerate cancer development, resulting in a poor outcome for patients.15–20 The HIF-1α-induced upregulation of GLUT-1 is significantly associated with cancer recurrence and metastasis in patients with laryngeal carcinoma. This observation suggests the use of HIF-1α/GLUT-1 as a gene signature for the diagnosis and prediction of laryngeal carcinoma1 and also as a potential therapeutic target for laryngeal carcinoma.
In our study, use of the CRISPR/Cas9 system induced frameshift and missense mutations in the HIF-1α and GLUT-1 genes, respectively, resulting in double gene knockout in HEp-2 cells. Given the key roles of these two genes in cancer development, this cell model can be used to investigate their involvement in glucose uptake, glycolysis, and other metabolic processes that contribute to laryngeal carcinoma and the hypoxic conditions of cancer cells. In this study, we first found that the expression of HIF-1α and GLUT-1 double gene knockout using CRISPR/Cas9 technique significantly decreased the proliferation, migration, and invasion of HEp-2 cells. We also demonstrated that glucose uptake and lactic acid of HEp-2 cells were significantly decreased after HIF-1α and GLUT-1 double gene knockout compared with before HIF-1α and GLUT-1 double gene knockout. Next, we found that the expression of PTEN increased, and the expression of PI3K, AKT, and mTOR decreased, and the phosphorylation level of PI3K, AKT, and mTOR decreased after HIF-1α and GLUT-1 double gene knockout. It is speculated that after the knockout of HIF-1α and GLUT-1 double gene, PI3K/AKT/mTOR pathway is inhibited, thereby affecting the glucose metabolism, proliferation, migration, and invasion vitality of HEp-2 cells.
Conclusion
This study indicated that the proliferation, migration, and invasion of HEp-2 cells were caused by the suppressed energy supply (glucose, lactic acid, etc) of HEp-2 cells. The possible mechanism may be that the inhibition of PI3K/AKT/mTOR pathway by HIF-1α and GLUT-1 double gene knockout using CRISPR/Cas9 technique leads to reduction of glucose uptake and lactic acid generation.
Acknowledgment
This work was supported by the Science and Technology Department of Zhejiang Province, P.R. China (No. 2016C33144).
Author contributions
All authors contributed to data analysis, drafting and revising the article, gave final approval of the version to be published, and agree to be accountable for all aspects of the work.
Disclosure
The authors report no conflicts of interest in this work.
References
Wu XH, Chen SP, Mao JY, Ji XX, Yao HT, Zhou SH. Expression and significance of hypoxia-inducible factor-1α and glucose transporter-1 in laryngeal carcinoma. Oncol Lett. 2013;5(1):261–266. | ||
Luo XM, Xu B, Zhou ML, et al. Co-inhibition of GLUT-1 expression and the PI3K/Akt signaling pathway to enhance the radiosensitivity of laryngeal carcinoma xenografts in vivo. PLoS One. 2015;10(11):e0143306. | ||
Bao YY, Zhou SH, Lu ZJ, Fan J, Huang YP. Inhibiting GLUT-1 expression and PI3K/Akt signaling using apigenin improves the radiosensitivity of laryngeal carcinoma in vivo. Oncol Rep. 2015;34(4):1805–1814. | ||
Xu YY, Wu TT, Zhou SH, et al. Apigenin suppresses GLUT-1 and p-AKT expression to enhance the chemosensitivity to cisplatin of laryngeal carcinoma HEp-2 cells: an in vitro study. Int J Clin Exp Pathol. 2014;7(7):3938–3947. | ||
Yan SX, Luo XM, Zhou SH, et al. Effect of antisense oligodeoxynucleotides glucose transporter-1 on enhancement of radiosensitivity of laryngeal carcinoma. Int J Med Sci. 2013;10(10):1375–1386. | ||
Endo M, Mikami M, Toki S. Multigene knockout utilizing off-target mutations of the CRISPR/Cas9 system in rice. Plant Cell Physiol. 2015;56(1):41–47. | ||
Chu HW, Rios C, Huang C, et al. CRISPR-Cas9-mediated gene knockout in primary human airway epithelial cells reveals a proinflammatory role for MUC18. Gene Ther. 2015;22(10):822–829. | ||
Zhao K, Yang SY, Zhou SH, Dong MJ, Bao YY, Yao HT. Fluorodeoxyglucose uptake in laryngeal carcinoma is associated with the expression of glucose transporter-1 and hypoxia-inducible-factor-1α and the phosphoinositide 3-kinase/protein kinase B pathway. Oncol Lett. 2014;7(4):984–990. | ||
Gu J, Yamamoto H, Fukunaga H, et al. Correlation of GLUT-1 overexpression, tumor size, and depth of invasion with 18F-2-fluoro-2-deoxy-D-glucose uptake by positron emission tomography in colorectal cancer. Dig Dis Sci. 2006;51(12):2198–2205. | ||
Luo XM, Zhou SH, Fan J. Glucose transporter-1 as a new therapeutic target in laryngeal carcinoma. J Int Med Res. 2010;38(6):1885–1892. | ||
Mao ZP, Zhao LJ, Zhou SH, Liu MQ, Tan WF, Yao HT. Expression and significance of glucose transporter-1, P-glycoprotein, multidrug resistance-associated protein and glutathione S-transferase-π in laryngeal carcinoma. Oncol Lett. 2015;9(2):806–810. | ||
Yasuda M, Miyazawa M, Fujita M, et al. Expression of hypoxia inducible factor-1alpha (HIF-1alpha) and glucose transporter-1 (GLUT-1) in ovarian adenocarcinomas: difference in hypoxic status depending on histological character. Oncol Rep. 2008;19(1):111–116. | ||
Pez F, Dayan F, Durivault J, et al. The HIF-1-inducible lysyl oxidase activates HIF-1 via the Akt pathway in a positive regulation loop and synergizes with HIF-1 in promoting tumor cell growth. Cancer Res. 2011;71(5):1647–1657. | ||
Shen WQ, Cheng KJ, Bao YY, Zhou SH, Yao HT. Expression of GLUT-1, HIF-1α, PI3K and p-Akt in a case of ceruminous adenoma. Head Neck Oncol. 2012;4:18. | ||
Eckert AW, Lautner MH, Schütze A, Taubert H, Schubert J, Bilkenroth U. Coexpression of hypoxia-inducible factor-1α and glucose transporter-1 is associated with poor prognosis in oral squamous cell carcinoma patients. Histopathology. 2011;58(7):1136–1147. | ||
Palit V, Phillips RM, Puri R, Shah T, Bibby MC. Expression of HIF-1alpha and GLUT-1 in human bladder cancer. Oncol Rep. 2005;14(4):909–913. | ||
Iida T, Yasuda M, Miyazawa M, et al. Hypoxic status in ovarian serous and mucinous tumors: relationship between histological characteristics and HIF-1alpha/GLUT-1 expression. Arch Gynecol Obstet. 2008;277(6):539–546. | ||
Lidgren A, Bergh A, Grankvist K, Rasmuson T, Ljungberg B. Glucose transporter-1 expression in renal cell carcinoma and its correlation with hypoxia inducible factor-1 alpha. BJU Int. 2008;101(4):480–484. | ||
Sulkowska M, Wincewicz A, Sulkowski S, Koda M, Kanczuga-Koda L. Relations of TGF-β1 with HIF-1α, GLUT-1 and longer survival of colorectal cancer patients. Pathology. 2009;41(3):254–260. | ||
Ogane N, Yasuda M, Shimizu M, et al. Clinicopathological implications of expressions of hypoxia-related molecules in esophageal superficial squamous cell carcinoma. Ann Diagn Pathol. 2010;14(1):23–29. |
 © 2019 The Author(s). This work is published and licensed by Dove Medical Press Limited. The
full terms of this license are available at https://www.dovepress.com/terms
and incorporate the Creative Commons Attribution
- Non Commercial (unported, 3.0) License.
By accessing the work you hereby accept the Terms. Non-commercial uses of the work are permitted
without any further permission from Dove Medical Press Limited, provided the work is properly
attributed. For permission for commercial use of this work, please see paragraphs 4.2 and 5 of our Terms.
© 2019 The Author(s). This work is published and licensed by Dove Medical Press Limited. The
full terms of this license are available at https://www.dovepress.com/terms
and incorporate the Creative Commons Attribution
- Non Commercial (unported, 3.0) License.
By accessing the work you hereby accept the Terms. Non-commercial uses of the work are permitted
without any further permission from Dove Medical Press Limited, provided the work is properly
attributed. For permission for commercial use of this work, please see paragraphs 4.2 and 5 of our Terms.