Back to Journals » Risk Management and Healthcare Policy » Volume 14
Construct a Knowledge Graph for China Coronavirus (COVID-19) Patient Information Tracking
Authors Wu J
Received 17 March 2021
Accepted for publication 30 September 2021
Published 21 October 2021 Volume 2021:14 Pages 4321—4337
DOI https://doi.org/10.2147/RMHP.S309732
Checked for plagiarism Yes
Review by Single anonymous peer review
Peer reviewer comments 2
Editor who approved publication: Dr Jongwha Chang
Jiajing Wu1,2
1School of Information Science and Engineering, Ocean University of China, Qingdao, 265100,People’s Republic of China; 2School of Mathematics and Computer Science, Chifeng University, Chifeng City, 024000, Inner Mongolia, People’s Republic of China
Correspondence: Jiajing Wu Email [email protected]
Abstract: Since first outbreak of respiratory disease in China, the Coronavirus epidemic (COVID-19) spread on a large scale, causing huge losses to individuals, families, communities and society in the country. The conventional research on the transmission process is basically to study the law or trend of the transmission of infectious diseases from a macro perspective. For in-depth study of the critical data of the newly confirmed patients, one effective way to improve the social isolation measures requires the formation of an organized tracking knowledge system for the confirmed patients and the personnel who have been removed, and the deep data mining and application. Knowledge graph (KG) is one of the irreplaceable techniques to quickly gather patient contact information and outbreak event, which reflecting the relationship between knowledge evolution and structure of novel Coronavirus. Therefore, this paper proposes a method for the analysis of COVID-19 epidemic situation using knowledge graph combined with interactive visual analysis. Firstly, based on the key factors of novel Coronavirus disease, the entity model of the patient, the relationship type of the patient and the expression of knowledge modeling were proposed, and the knowledge graph of the action track of the COVID-19 patient was deeply explored and comparative summarized. Secondly, in the process of constructing knowledge graph, conditional random field (CRF) algorithm is used to extract entity and knowledge. Meanwhile, to better analyze the disease relationship between patients, the semantic relationship of knowledge graph was combined with the visualization of knowledge graph, and the semantic model was verified by deep learning calculation and node attribute similarity. To discover the community detection of patients in the patient knowledge graph, this paper uses PageRank combined with Label propagation algorithms to discover community propagation in the network. Finally, COVID-19 epidemic situation was analyzed from confirmed patient data and multi-view collaborative interactions, such as map distribution visualization, knowledge graph visualization, and track visualization. The results show that the construction of a knowledge graph of COVID-19 patient activity is feasible for the transmission process, analysis of key nodes and tracing of activity tracks.
Keywords: COVID-19, knowledge graph, Neo4j, CRF, tracking
Introduction
COVID-19 is a new strain of Coronavirus that has not been previously identified in humans. The COVID-19 is the cause of an outbreak of respiratory illness first detected in Wuhan, Hubei province, China.1 Coronaviruses are a large family of viruses that are known to cause illness ranging from the common cold to more severe diseases, such as Severe Acute Respiratory syndrome (SARS) and Middle East Respiratory Syndrome (MERS).2 Novel Coronavirus began to appear when a number of patients in Wuhan, Hubei Province, China associated with a large seafood and live animal market, indicating animal to human transmission. Subsequently, more patients were reported to have had no contact with animal markets, indicates that human-to-human transmission. There have been subsequent reports of human-to-human transmission outside Hubei and in countries outside China, including the United States. As in the United States, most international destinations now have sustained community transmission of the virus that causes COVID-19.3 As of May 12, 2020, the virus outbreak lead to more than four million total confirmed cases and 289,932 deaths, and the Coronavirus is affecting 212 countries and territories around the world.4
One method of controlling the communicable diseases is the use of a surveillance system to track the exposed and infected individuals, as well as contacted tracking.5–8 However, the existing trajectory tracking systems have defects in temporal and spatial resolution.9,10 At the same time, the information and action track of patients play a key role in the control of the epidemic. However, the data of infected patients are usually from countries or regions, and decision-makers are unable to obtain the key track of infection from the data in the face of the sudden increase in data, which leads to the low efficiency of social isolation and isolation measures simultaneously.11 Currently, we are in a critical period of fighting against the epidemic, but the overall cognitive ability to track the movements events and spread of patients is just simply not enough.
Knowledge graph is a knowledge representation form of structured knowledge by extracting domain entities, attributes and their interrelationships from massive text data with the help of information processing technology.12 In this paper, the knowledge graph helps track the motion trajectory of novel Coronavirus patients. By introducing a knowledge graph, you can integrate “knowledge” with information about different patients and get the information you need from travel information and its close contacts. In this way, not only can the information of all infected patients be effectively integrated, but also regional prevention and control can be carried out through the track information. In the field of novel Coronavirus infection, due to the confidentiality of emergency and personnel information in this field, it is difficult to obtain relevant data, and the inter-entity relationship is relatively complex. As a result, the accuracy of knowledge extraction based on unstructured data is limited, so it is faced with a series of difficulties to construct the knowledge graph of motion trajectory of novel Coronavirus confirmed patients.
Actually, Google first proposed the concept of knowledge graph in 2012. After bringing in the knowledge graph technology in the search engine fields, the search engine’s knowledge query efficiency has risen dramatically.13 For example, DBpedia,14 a multi-language knowledge graph based on Wikipedia data, has a large scale and covers 125 languages, and is widely used all over the world. Most of the entities owned by YAGO15 with high confidence have been evaluated with high quality and accuracy, but the richness of the entities contained is lower than that of DBpedia. Thanks to the development of knowledge graph technology, the number of participants in the vertical knowledge graph has been increasing year by year. For example, IMDB in the field of film and television, MusicBrainz in the field of music, knowledge atlas in the field of traditional Chinese medicine,16 and knowledge atlas in the field of plants,17 etc. During the construction of these vertical knowledge graph, a considerable part of the data obtained from web pages on the Internet. By summarizing the above knowledge mapping research, we can summarize that the existing structured data in the domain and the semi-structured data in the encyclopaedia are the key data sources to construct the knowledge graph. Due to the high data quality of the semi-structured knowledge, this paper constructed the knowledge graph of COVID-19 diagnosed patients, such as knowledge extraction, knowledge fusion, construction and storage of knowledge graph, and update and maintenance of knowledge graph.
The following are contributions of our article:
- In view of the key factors of novel Coronavirus disease, the entity model of the patient, the relationship type of the patient and the expression of knowledge modeling were proposed, and the knowledge graph of the action track of the COVID-19 patient was deeply explored and comparative summarized.
- In the process of constructing knowledge graph, conditional random field (CRF) algorithm is used to extract entity and knowledge. Meanwhile, to better analyze the disease relationship between patients, the semantic relationship of knowledge graph was combined with the visualization of knowledge graph, and the semantic model was verified by deep learning calculation and node attribute similarity. To ensure the accurate storage of patient relationship information, Neo4j graph database is used to store knowledge graph data.
- Patient category analysis, range of action and prevention situation analysis, cluster infection case analysis were conducted to realize patient relationship tracking, prevention and control information release of high-dimensional groups, and event regularity analysis, accurate patient prevention and control has been achieved.
Materials and Methods
Related Works
As the COVID-19 epidemic evolves, researchers are increasingly taking an interest in trying to describe different types of COVID-19-related knowledge graph, such as the virus classification graph, the COVID-19 basic information graph, the antiviral drug knowledge graph, and the literature extraction graph. For example, OpenKG, an open Chinese knowledge graph, can meet the needs of the epidemic knowledge such as question and answer, knowledge reasoning. However, these knowledge bases are difficult to describe the dynamic changes of diverse information and lack of spatial-temporal characteristics, which make it impossible to carry out a deeper analysis of the epidemic situation.
Spatial temporal knowledge graph is a type of knowledge graph in Spatial temporal science and a structured semantic web knowledge graph of spatial distribution. By describing concepts, entities, attributes or their relationships in the Spatial temporal domain, concepts and entities are interconnected to form a network knowledge structure.18 In recent years, Spatial temporal knowledge graph has been recognized by experts in related fields, and has been studied in depth mainly from the aspects of construction of Spatial temporal knowledge graph, knowledge correlation model and application of knowledge graph. The construction of Spatial temporal knowledge graph is mainly studied in terms of the extraction of geographic entities,19 the extraction of topology and azimuth relations,20 and the storage of Spatial temporal knowledge graph.21,22 As literature23 puts forward the framework of constructing Spatial temporal knowledge graph; Literature24 analyzes the key technologies of building Geographic knowledge graph in simulated spatiotemporal scope practice. Literature25 uses geographical information to reinforce the geographical entity of Open Street Map (OSM), and constructs crowd-sourced geographical knowledge graph (CrowdGeoKG). Literature26 proposes a formal representation model of spatiotemporal knowledge, aiming at the spatial, temporal and dynamic changeable characteristics of knowledge.
Entity extraction, also known as Named Entity Recognition, refers to the automatic recognition of named entities from the original corpus. Generally speaking, a specific noun, such as names of people, places and organizations. Entity is one of the most basic elements in the knowledge graph, its integrity will directly affect the integrity and consistency of the knowledge graph.Word2Vec27 is an NLP tool launched by Google in 2013. Its feature is to quantize all words and express them as a low-dimensional dense numerical vector, which is convenient for computer processing. The vectorization form of words can quantitatively measure the relationship between them and help us understand the relationship between words. LSTM represents short-term and long-term memory network.28 It is a kind of cyclic neural network, suitable for processing serialized data. LSTM is used to obtain the status value of each word, and predict which entity tag each word belongs to. A simpler alternative would be to use the Softmax function to make a multi-category forecast. In order to consider the correlation of adjacent tags, this article uses CRF (Conditional Random Fields) conditionals to make multiple categorical predictions, meanwhile, LSTM model was used to train the patient’s semantic model and classify the patient’s movement trajectory.
Relationship extraction is based on the Recognition of Named Entities to further analyze the semantic meaning between entities, so as to further understand the natural language text information. According to the degree of dependence on labeled data, relationship extraction methods can be divided into supervised learning, remote supervised learning and open extraction method. Precise, Recall and F1-score are commonly used as indicators of performance evaluation in entity relationship extraction tasks. The article published by Zeng et al29 uses the classical Convolutional Neural Networks (abbreviated as CNN) structure, which no longer requires complex natural language processing technology and part of speech marker and syntactic analysis. Zhou et al30 proposed a bidirectional long short-term memory network based on attention mechanism, which is used to capture the central semantic information in sentences. Daojian Zeng et al31 proposed a piecewise convolutional neural network. Instead of manual annotation, remote supervision is employed to automatically annotate entity relationship. Xiaotian Jiang et al32 proposed MIMLCNN model and proposed the hypothesis that the entity relationship in remote supervision comes from multiple sentences. Jun Feng et al33,34 introduced reinforcement learning for noisy remote monitoring tasks and proposed a new model of sentence level relationship classification based on noise data.
System Architecture
An architectural diagram of building a COVID-19 patient information system is shown in Figure 1. Firstly, owing to the particularity of unexpected novel Coronavirus patient knowledge graph, patient information ontology can be constructed first. Ontology is the description of the concepts and the relationship between the concepts in the domain, and it denotes the semantic of the objects by the relationship between the concepts. To improve the accuracy and coverage of patient information extraction, the patient ontology concept was determined by analyzing the classification of patient information and its relationship. In total, it is divided into following categories: event, patient, residence, travel, hospital, and vehicle information. Each entity also contains both the attributes and the inherited attributes of the class that it represents, such as the number of infectious contact people, travel time, flight number, and residents in the outbreak area. Secondly, unstructured data (such as text, image) and structured data (such as digital data) of patient massive information are obtained from the Internet, baidu encyclopedia and relevant medical websites. It’s necessary to set aside of the “noise” information in the internet and only retain information relevant to the patient information. First, the relevant conventional, neat data is stored in the server-side database. Second, in this paper, Neo4j graphics database will be used to store extracted entities and relationships information knowledge, whose purpose is built to leverage not only data but also data relationships, make users to quickly obtain and understand the information and knowledge structure of the patient event. As a typical representative of graphic NoSQL database, Neo4j can easily and stably store and manage hundreds of millions of nodes and relationships through APOC tool and CSV file loading. It has high reliability and extensibility, supports complete ACID transactions, and the ability to efficiently complete the storage, update, management and retrieval of knowledge graph. Finally, since the knowledge graph needs to be constantly updated and enriched according to new knowledge, this paper will update and revise the knowledge graph of the novel Coronavirus patient information by means of incremental updating, and intervene with partial hand work.
 |
Figure 1 China COVID-19 patient information architecture. |
The Procedure of Constructing KG
The outbreak of COVID-19 generates massive amounts of data related to patient’s movement track information. This paper aims to utilize existing public and open patient information resources to acquire the basic information of patients and the relationship between patient’s movement track, which can provide a new way of thinking and method for epidemic situation analysis. The data of patients in the knowledge graph came from the official website of the health commission of all provinces and cities in China, the official data published by WeChat and weibo, patient migration and the news data of patients. As shown in Figure 2, the construction of semantic model affects the flexibility of knowledge graph retrieval, according to the description of the COVID-19 patient, the semantic of the knowledge Graph patient was divided into the patient’s events and related relationships. Gevent is composed of a five-tuple <NWhen, NWhere, NWho, NWhat and NHow>. NWhen, NWhere, NWho, NWhat and NHow correspond to the time, place, person, event and route of the activity elements respectively, i.e, Gevent = <NWhen, NWhere, NWho, NWhat, NHow>.
 |
Figure 2 The composition of the patient relationship. |
The concept of ontology divides COVID-19 Patients into the following relationships: {N} is defined as follows: {N1(Who): Patients, N2(Where):Residence, N(How):Travel, N4(Where):Hospital, N5(What):Vehicle}. Relationship between events in patients with the five elements of integration, relationship is as follows: {R} = {R (N11, N12), R (N11, N13), (N11, N14), R (N1 and N2), R (N1, N3), R (N1, N4 interchange), R (N1, N5)}.1.R(N11, N12) represents the causal relationship between infection between two patients; 2.R(N11, N13) represents the time relationship of infection between two patients; 3.R(N11, N14) represents the sequential relationship of infection between two patients; 4.R(N11, N15) represents the contact relationship of infection between two patients; 5.R(N1, N2) represents the relationship between the patient and the residence; 6.R(N1, N3) represents the relationship between the patient and the travel place; 7.R(N1, N4) represents the confirmed relationship between the patient and the hospital; 8.R(N1, N5) represents the relationship between “travel mode” and the means of transportation taken by the patient.
Temporal and spatial information of COVID-19 patients knowledge graph belongs to domain knowledge graph and adopts the top-down construction method, that is, starting from the pattern layer. As shown in Figure 3. Schema layer construction is the most core part of the knowledge graph, and it defines the data Schema (ie, its ontology) for the knowledge graph. In the process of defining ontology, the top-level conceptual system is gradually refined to form a well-structured taxonomic hierarchy. In order to improve the integrity and accuracy of knowledge graph data, this paper adopts the ontology model construction with human participation, classification layering and concept combing.
 |
Figure 3 Knowledge graph construction method. |
For the text related to the COVID-19 patient information data obtained from Internet resources, after word segmentation, deletion of stopping word, tagging part of speech, etc., a set of sentences needing to extract the relationship was obtained, and the sentences were segmented and labeled.
In the process of extracting the information from the COVID-19 patient, it was found that according to the detailed information of the patient, the specific events of the patient’s illness could be divided into consultation event, confirmation event, travel event, contact event, gathering event, home event, fever event and shopping event. As shown in Figure 4, the relationship between events can be defined as the constituent relationship, the subordination relationship, the causal relationship and the correlation relationship. The reasoning between different events can be linked by places and participants.
 |
Figure 4 COVID-19 event relationship graph. |
For example, as shown in Figure 5: “Wang left Shandong Province on February 1 and traveled to Malaysia by plane on February 1. During the travel, He came into contact with Li who flew from Tianjin. Li arrived in Malaysia by flight KE671 on February 2, and Li returned to Wuhan Hospital in China on February 15 due to fever.” Among them, there is a causal relationship between the contact incident of “contacting with a Malaysian joint tourist on February 2” and the medical treatment incident of “Li visiting a doctor with fever symptoms on February 15”.
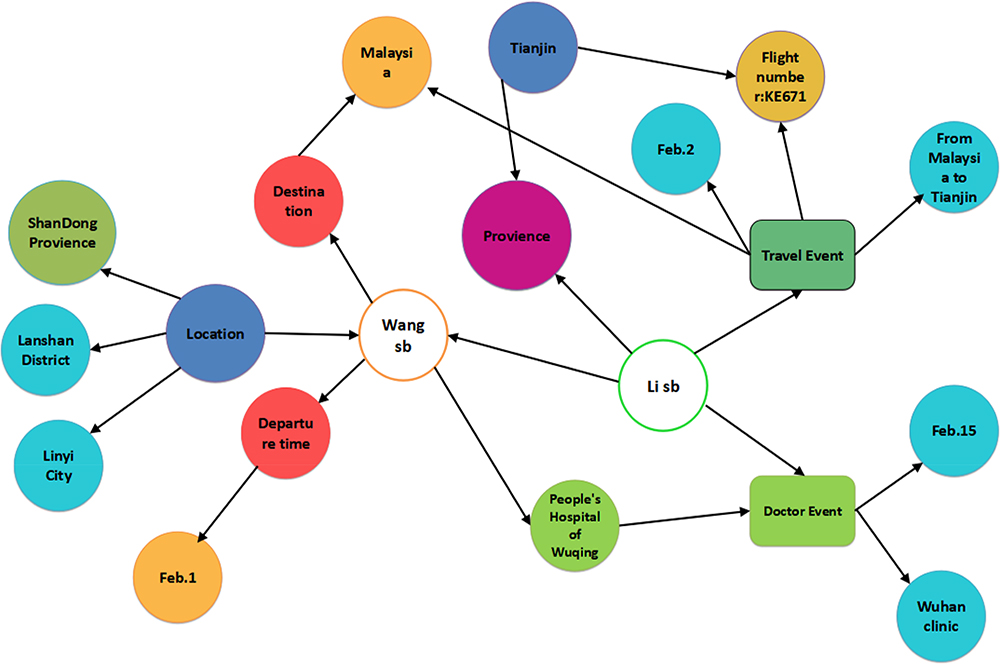 |
Figure 5 Example: COVID-19 event relationship graph. |
As mentioned above, the feature of grammatical analysis is applied to extract the event relationship between COVID-19 patients. The relationship between the occurrence of the specific patient’s disease was extracted to enrich the relationship. The above approach and efficient access to construct more accurate knowledge graph. Meanwhile, we can identify the spatial and temporal transmission pathways during the course of the disease. In addition, as patient tracking is a relatively simple and practical method in relation analysis, only part of redundant information exists in syntactic analysis, which can save laborious labor cost.
Framework Composition
Community Discovery of Patients Based on Local Similarity
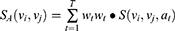
The measurement of local similarity of patient nodes consists of two parts: node link strength and node attribute similarity calculation. The importance of patient nodes in the graph is different, leading to different strength of the link relationship between patient nodes. In this paper, Pagerank algorithm is used to calculate the node of each patient based on the importance of the whole confirmed patient graph, which is calculated as follows:
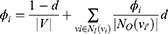
Where, d represents the probability value of a node reaching other nodes through links. The value range of D is 0 ~ 1. According to the experimental conclusion of experience, the effect is better when D = 0.85, so d is set as 0.85 in this paper. After calculating the importance of the nodes
  , recalculate the strength of the links between nodes. Similar to the calculation method of node importance, the weight of each edge of the node is expressed as
  , the link strength of nodes
  to
to  is the ratio of the edge weight of
  to the importance of the node pointed to
  . The definition is as follows:
Where, if the ratio of the edge weight of node  is higher in the importance degree of node
  , then the corresponding link strength from node
  to node
  will be greater. The link strength
  between nodes
  and
and  is calculated as follows:

To calculate the link strength between patient nodes, this paper considers the edge directivity, that is, the sum of the link strength of  to
to  and
and  to
to  .
.
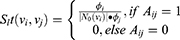
Node attribute similarity calculation: Node attribute information is another important information. This paper considers discrete node attributes. For a particular attribute  , the attribute similarity is calculated as follows:
If an attribute of two nodes corresponds to the same attribute value, the similarity of the attribute is 1, otherwise it is 0. Under the condition of  , and
, and  , the attribute similarity between nodes is:
Where, the value range of  is [0,1]. In the process of clustering, the weight of patient attributes can be adjusted, which is conducive to the higher weight of clustering attributes.
Semantic Node Community Clustering Based on Label Propagation
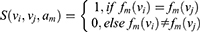
The knowledge graph of novel Coronavirus patient is based on a directed graph. Each node in the graph is a data point, including labeled and unlabeled data. The edges of node i and node j represent the similarity of the two nodes. We assume that the graph is fully connected, and the edge weights of node i and node j are:
Where  stands for hyperparameter.
The principle of the label propagation algorithm is essentially to propagate labels through the edges between nodes. The greater the edge weight is, the more similar the two nodes are, and the easier the label is to propagate.Define a probability transition matrix P of NxN:
 represents the probability of moving from node i to node j. Suppose there are C classes and L labeled samples, we define a label matrix
  of
of  ,the i-th row represents the label indication vector of the i-th sample. That is, if the category of the i-th sample is j, then the j-th element of the row is 1 and the others are 0. Similarly, we also give u unlabeled samples a label matrix
  of
of  .Combining them, we get a
  soft label matrix F = [
 ;
;  ]. Soft label means that we keep the probability that sample i belongs to each category instead of being mutually exclusive. This sample belongs to only one class with probability 1. The label of the labeled data is determined in advance, it can not be taken away, so it must return to its original label after each transmission. As the labeled data continuously propagates its own label, the final class boundary will cross the high-density area and stay in the low-density interval. Equivalent to each different category of labeled samples, the sphere of influence is divided. The pseudocode of the specific steps of the tag propagation algorithm is shown in Table 1.
 |
Table 1 Pseudocode of Label Propagation Algorithm |
Experiment Platform
Data
The experimental data types and sources of this article are as follows (as of 2020-02-08): (1) Daily epidemic data: official websites of National Health and Family Planning Commission and provincial and municipal Health Commissions; (2) Migration data: The People’s Daily app published the data of the number of trains with COVID-19 and the migration location of confirmed patients; (3) Displacement trajectory data of COVID-19 patients. After cleaning, the number of 5096 entities and 15,369 entity relations of the knowledge graph of patients were constructed.
Ethical Considerations
As novel coronavirus has the characteristics of spatial transmission, to make smarter control of the epidemic, the official website of China will publish the spread track of the epidemic legally. For the publicly confirmed transmission track information, the individual names and specific information of the confirmed patients are not public, only the transmission route at a specific time is disclosed, for example, there were two confirmed patients on the G118 train from Beijing to Shanghai on December 15, 2020. The data does not involve personal privacy or ethical trials. Based on the above all, the study can be exempted from ethical review by the ethics committee of the Ocean University of China.
Results
Temporal and Spatial Distribution of Patients
Using browser/ Server (B/S) architecture, the experimental platform constructed a visualized analysis systematic problem-solving for spatio-temporal information knowledge atlas of patients by using the visual tool E-Charts and combining the characteristics of interactive visual analysis of spatio-temporal information system and visual analysis system. The use of multi-view collaborative visual analysis methods can fully grasp the current epidemic situation.
As shown in Figure 6, the patient no. 356 had been to Kunming, Chengdu, Xiaogan and other 5 provinces and cities between February 17, 2020 and March 17, 2020. When the specific provincial and municipal information is clicked, the specific provincial and municipal path information of the patient can be inquired. According to the movement track of patient 356 in Wuhan, it can be seen that the patient arrived at Wuhan Zhongnan Hospital on February 17, 2020. However, without any diagnosis or treatment, he went to Qingdao and Shenyang. Better spatial transmission and early warning can be achieved through the analysis of the distribution of patients in time and space and the in-depth mining of people in contact with the same time and place.
 |
Figure 6 Example: overall epidemic visualization. |
Analysis of Inpatient Information Distribution
As shown in Figure 7, the correlation analysis between “Provinces and cities affected” and “confirmed hospital” can be used to understand the admission situation of each designated hospital. In addition, through graph visualization, it can be found that the location of the case was in Wuhan, but the confirmed hospital was not in Wuhan, indicating that the relevant hospitals in Wuhan had more patients admitted and were under great pressure, and the patients were treated in the provinces and cities around. As demonstrated in Figure 8, the entity relationship analysis of “residence” and “diagnose” clearly shows that most of the infected people in the early stage of the epidemic are related to “Wuhan” and “region” and belong to the “directly imported” type of patients. Through the list of events, the locations and people that patients pass through and contact with can be grasped, which is conducive to further control of personnel (Figure 9). Through the list of the train number of patients, the real-time dynamic grasp of the patient’s events and contact places and people, which is conducive to the further control of infectious patients.
 |
Figure 7 Hospital analysis of patient. |
 |
Figure 8 Regional case analysis. |
 |
Figure 9 Patient train number information. |
 |
|
 |
Figure 10 Continued. |
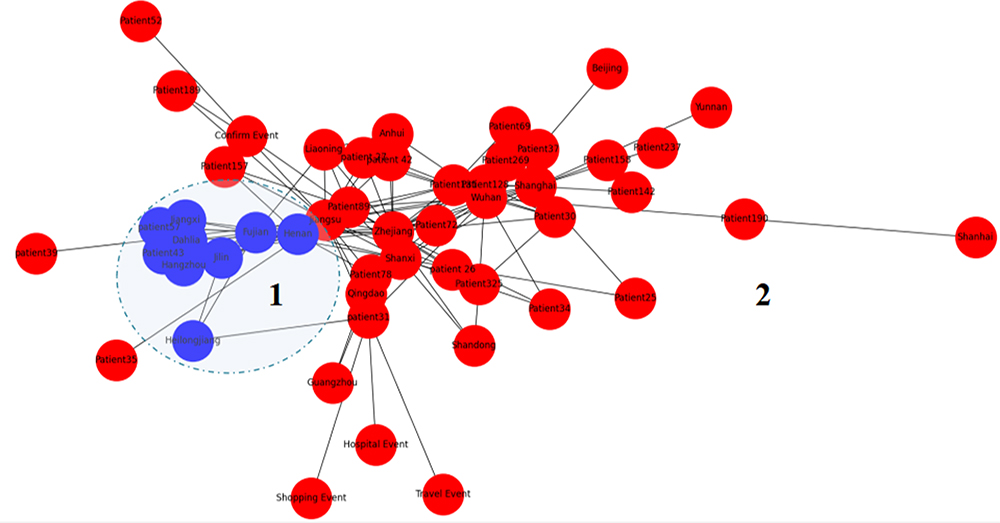 |
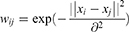
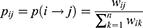
Figure 10 Patients community analysis. (A) Iterative 1 times, 7 Communities. (B) Iterative 2 times, 3 Communities. (C) Iterative 3 times, 2 Communities. |
Analysis of COVID-19 Patients Community Exploration
Label propagation is a semi-supervised machine learning algorithm that assigns tags to previously untagged data points. At the beginning of the algorithm, a subset (usually a small fraction) of the data points have labels (or categories). During the entire algorithm run, these labels will be propagated to unmarked points. To analyze the clustering relationship of patient communities during the spread of new coronavirus patients, we use the pageRank algorithm to analyze the weights of key nodes, add the weights to the Label propagation algorithm, and use the tag propagation algorithm to detect community clustering. In this paper, we selected 189 cases spread in China on March 1, 2020 for community detection analysis, ranked the node weights according to PageRank, and analyzed 189 cases through the label propagation algorithm. As shown in Figure 10, the number of communities is 7 when the iteration is one time, and a total of 7 outbreak communities are detected. After 3 iterations, the number of communities stabilized, and after three iterations or more, the number of communities stabilized at 2. In the Label propagation algorithm, checking the intermediate community structure at the end of each iteration is a powerful tool, which allows us to find small communities that have been ignored. It also allows us to search for hierarchical community structures. For example, in the third iteration of the algorithm, a single community can be composed of two different communities in the second iteration, which implies some sort of hierarchical relationship and structure. At the end of the third iteration, the tag propagation algorithm was used to identify the presence of cross-regional patients in 189 cases, and different communities reflected the presence of patients infected between two different communities.
The overall process of knowledge graph retrieval about the patient information management system is shown in Figure 1. Taking advantage of Django technology, the system performs webpage display on the patient event information system, and completes information display through query, analysis, verification, template matching and visualization. More specifically, if the user click the “Search patient information” button, he requests the URL of a page through the browser, and the URL scheduler finds the appropriate view layer from the URL requested by the user. When accessing the view layer, you can selectively access the entity and relational data of events in the underlying model database of Neo4j. The view layer optionally accesses the entity and relational data of events in the underlying model database of Neo4j. After the retrieved event data is returned to the view layer, all model-to-database interaction is done through the manager file. The Context which is a special context handler is passed to Template (where the previous file is stored) to generate the web page, the Template uses Filters and Tags to render the output to the cache framework, and the response is returned to the browser and finally presented to the user.
The goal of this system is not just for providing information retrieval service for scholars and related researchers engaged in novel Coronavirus research, also provide overall control to detailed defense, hierarchical analysis patient prevention. In the future, the large-scale spatio-temporal information knowledge graph can be constructed by fully combining civil aviation, high-speed rail, highway migration data, household registration data, mobile phone signaling data and other relevant data. Thanks to artificial intelligence natural language processing, knowledge graph and other methods, it is possible to track the release, spread of COVID-19 and fight it, and fully grasp the epidemic expansion situation and the epidemic prevention and save time and space node distribution plan, which is conducive to further accurately locating the epidemic information and preventing and controlling the spread of the epidemic.
Finally, as shown in Figure 11, we compared the novel Coronavirus patient event knowledge graph with the traditional information search method as follows:
 |
Figure 11 Patient train number information. |
Search quality: Novel Coronavirus patient information facilitates users to quickly and accurately find the corresponding detailed information from massive patient information data, meanwhile, improves the quality of information search.
Information accuracy: As the novel Coronavirus incident unfolded suddenly, misleading information about the patient will appear in public opinion within a short period of time. The data collation and data association on the official website can guarantee the accuracy of the patient information.
By comparison, it can be easily concluded that novel coronavirus infectious disease transmission process is closely related to crowd activity events, that is, crowd activity directly affects the spatio-temporal diffusion path of COVID-19. Therefore, with the novel Coronavirus patient information as the center, combining the cutting-edge knowledge mapping technology and the data organization form with semantic characteristics, the case data modeling can greatly improve the efficiency of the information retrieval from the Novel Coronavirus.
Discussion and Outlook
Aiming at the problems of COVID-19 disease analysis lacking data correlation and knowledge atlas lacking in-depth analysis, this paper proposed a new way of thinking for COVID-19 patient event analysis and patient relationship exploration with related technologies such as knowledge Atlas semantic web and big data visual analysis. However, this research has only been attempted in the field of COVID-19, and the applicability of this knowledge graph to other infectious diseases needs to be further explored in the future.
At the same time, in our actual work, we use well-known network robot technology from authority websites, databases and authoritative data from a large amount of raw data, but there are still have limitations on the accuracy of the data. Some “dirty data” will appear in the information system after a period of time which will affect the accuracy of the system service data and quality. In the following work, we will focus on the following aspects.
Firstly, the real-time update of the novel Coronavirus information needs to be further improved in the practical application process. In addition, only by appending a more detailed novel Coronavirus patient information architecture will the system be able to make more precise recommendations.
Secondly, the Novel Coronavirus Patient information Knowledge Atlas database will be made available to the public so that users can access the disease information anytime and anywhere via the Internet. Finally, through the novel Coronavirus disease information data sharing method, deficiencies and problems can be further discovered and the depth and width can be continuously improved to help further accurately locate the transmission path of the epidemic and prevent and control the spread of the epidemic.
Conclusion
In this paper, compared with conventional methods of epidemic surveillance and containment system, Omni-directional stereo display of situation control between cities, detect infection presence and follow its tracks, trend of the outbreak and the method of multiple analysis is adopted for effective surveillance of the epidemic situation. A novel Coronavirus patient information and event management system was proposed by applying the knowledge graph concept and Neo4j graphics database tool. Different from the original and very simple character relation, the updated relationship of epidemic disease has spatial correlation and temporal sustainability. Natural language processing is used to extract the infection events and locations of key patients, track the infection relationship of patients, and perform visual display, which can accurately reflect the infection relationship of patients.
By comparison, it can be easily concluded that there are several irreplaceable innovations in this article:
- COVID-19 infectious disease transmission process is closely related to crowd activity events, that is, crowd activity directly affects the spatio-temporal diffusion path of COVID-19. Therefore, with the novel Coronavirus patient information as the center, combining the cutting-edge knowledge mapping technology and the data organization form with semantic characteristics, the case data modeling can greatly improve the efficiency of the information retrieval from the Novel Coronavirus information.
- The quality of data directly affects the accuracy of patient information and paths. This paper extracts and sorts out data based on structured, semi-structured and unstructured data such as news data and government open websites. At the same time, the construction of a spatiotemporal knowledge graph with different semantic nodes and relationships in the knowledge graph improves the data quality of the knowledge graph and lays a good foundation for data analysis.
- The path of the patient can express the trajectory of the patient’s infection in both time and space. We use the macro and micro levels to track the new coronavirus patient, and track the path of the patient in an all-round and three-dimensional manner, which is the time of the outbreak. The personnel in contact with the space can be controlled in real time, so as to finely track the infection path of the new coronavirus patient.
- Verification of the semantic model of the new coronavirus patient. Through the analysis of the patient’s semantic relationship, the visualization software echarts can visually display the patient’s location and hospital information, and query by the number of trains the patient has taken, query case information and travel information, So as to visualize the association relationship.
- Use the graph algorithm of pagerank and label propagation to detect the patient’s infection relationship in the community, increase the number of iterations to detect the patient’s infection relationship community through the results, and use the weight matrix and label propagation algorithm to segment the image to discover the spread between communities relationship.
Disclosure
The author declares that there is no conflict of interest regarding the publication of this paper.
References
1. Kong D, Yang J, Li L. Early identification of technological convergence in numerical control machine tool: a deep learning approach. Scientometrics. 2020;125:1983–2009. doi:10.1007/s11192-020-03696-y
2. Chen X, Liu J, Xu L, et al. Knowledge graph of COVID-19 patient activity-a case study of Zhengzhou city. J Wuhan Univ. 2020;45:816–824.
3. Li Q, Guan X, Wu P, et al. Early transmission dynamics in Wuhan, China, of novel coronavirus–infected pneumonia. N Engl J Med. 2020;382:1199–1207. doi:10.1056/NEJMoa2001316
4. Chan J, Yuan S, Kok KH, et al. A familial cluster of pneumonia associated with the 2019 novel coronavirus indicating person-to-person transmission: a study of a family cluster. Lancet. 2020;395:514–523. doi:10.1016/S0140-6736(20)30154-9
5. World Health Organization. Statement on the second meeting of the International Health Regulations Emergency Committee regarding the outbreak of novel coronavirus (2019-nCoV). Available from: https://www.who.int/news-room/detail/30-01-2020-statement-on-the-secondmeeting-of-the-international-health-regulations-(2005)-emergency-committeeregarding-the-outbreak-of-novel-coronavirus-(2019-ncov).
6. Confirmed coronavirus cases and deaths by country and territory. Available from: https://virusncov.com.
7. Simonsen L, Gog JR, Olson D, et al. Infectious disease surveillance in the big data era: towards faster and locally relevant systems. J Infect Dis. 2016;214(suppl 4):380–385. doi:10.1093/infdis/jiw376
8. Houlihan CF, Whitworth JA. Outbreak science: recent progress in the detection and response to outbreaks of infectious diseases. Clin Med. 2019;19:140–144. doi:10.7861/clinmedicine.19-2-140
9. Abidi SS, Abidi SR. Intelligent health data analytics: a convergence of artificial intelligence and big data. Healthc Manage Forum. 2019;32:178–182. doi:10.1177/0840470419846134
10. Dong X, Boulton ML, Carlson B, et al. Syndromic surveillance for influenza in Tianjin. J Public Health. 2017;39:274–281.
11. Bansal S, Chowell G, Simonsen L, Vespignani A, Viboud C. Big data for infectious disease surveillance and modeling. J Infect Dis. 2016;214:375–379. doi:10.1093/infdis/jiw400
12. Salathé M. Digital pharmacovigilance and disease surveillance: combining traditional and big-data systems for better public health. J Infect Dis. 2016;214:399–403. doi:10.1093/infdis/jiw281
13. Sun Z, Yang J, Zhang J et al. Recurrent knowledge graph embedding for effective recommendation.
14. Wang X, He X, Cao Y et al. Kgat: knowledge graph attention network for recommendation.
15. Pujara J, Miao H, Getoor L, et al. Knowledge Graph Identification. Vol. 8218. Berlin, Heidelberg: Springer; 2013:542–557.
16. Vo N, Guerreiro M, Yaparla A, et al. Class A scavenger receptors are used by Frog Virus 3 during its cellular entry. Viruses. 2019;11:2–11. doi:10.3390/v11020093
17. Uhlen M, Oksvold P, Fagerberg L, et al. Towards a knowledge-based Human Protein Atlas. Nat Biotechnol. 2010;28:1248–1250. doi:10.1038/nbt1210-1248
18. Ming Z, Yaru D. Ontology non-classification relationship extraction method in the construction of plant domain knowledge map. J Agric Machin. 2016;47:278–284.
19. Jun C, Wanzeng L, Hao W, et al. BasicProblems and study directions of basic geographic knowledge service. Geomat Inf Sci Wuhan Univ. 2019;44:38–47.
20. Clare D. Reading geography between the lines: extracting local place knowledge from text. Spat Inf Theory. 2013;81:320–337.
21. Li Y, Feng L, Xiliang L. A bootstrapping based approach for open geo-entity relation extraction. Acta Geod Cartogr Sin. 2016;45:616–622.
22. Hongwei D, Lingkui M, Changqing H, et al. A method for geo semantic spatial index on SPARQL query. Acta Geod Cartogr Sin. 2014;43:193–199.
23. Gür N, Pedersen TB, Zimányi E, et al. A foundation for spatial data warehouses on the semantic web. Semantic Web. 2018;9:557–587. doi:10.3233/SW-170281
24. Feng L, Li Y, Peiyuan Q. On geographic knowledge graph. J Geo Inf Sci. 2017;19:723–734.
25. Chen J, Deng S, Chen H. Crowd-GeoKG: Crowdsourced Geo-Knowledge Graph. In: CCKS 2017:Knowledge Graph and Semantic Computing,Language,Knowledge and Intelligence. Chengdu,China: Springer; 2017:165–172.
26. Shu W, Xueying Z, Peng Y, et al. Geo-graphic knowledge graph (GeoKG): a formalized geographic knowledge representation. Int J Geo-Inf. 2019;8:184–185.
27. Qiang C, Jia C, Jian C, et al. Multi-level attention mechanism based distant supervision for relation extraction. J Chin Inf Process. 2018;32:96–106.
28. Wan J, Chen B, Wang S, Xia M, Li D, Liu C. Fog computing for energy-aware load balancing and scheduling in smart factory. IEEE Trans Ind Inform. 2018;14:4548–4556. doi:10.1109/TII.2018.2818932
29. Zeng D, Liu K, Lai S, et al. Relation classification via convolutional deep neural network: the 25th International Conference on Computational Linguistics: Technical Papers, Dublin, Ireland, 2014. Dublin City University and Association for Computational Linguistics; 2014.
30. Zhou P, Shi W, Tian J, et al. Attention-based bidirectional long short-term memory networks for relation classification. Proceedings of the 54th annual meeting of the association for computational linguistics, Berlin, Germany, 2016. Association for Computational Linguistics; 2016.
31. Zeng D, Liu K, Chen Y, et al. Distant supervision for relation extraction via piecewise convolutional neural networks. Proceedings of the 2015 Conference on Empirical Methods in Natural Language Processing, Lisbon, Portugal, 2015. Association for Computational Linguistics; 2015.
32. Jiang X, Wang Q, Li P, et al. Relation extraction with multi-instance multi-label convolutional neural networks. Proceedings of COLING 2016, the 26th International Conference on Computational Linguistics: Technical Papers, Osaka, Japan, 2016. The COLING 2016 Organizing Committee; 2016.
33. Feng J,Huang M,Zhao L, et al. Reinforcement learning for relation classification from noisy dat. Thirty-Second AAAI Conference on Artificial Intelligence, New Orleans, USA, 2018. PKP Publishing Services Network; 2018.
34. Woźniak M, Graña M, et al. A survey of multiple classifier systems as hybrid systems. Information Fusion. 2014;16:3–17.
 © 2021 The Author(s). This work is published and licensed by Dove Medical Press Limited. The
full terms of this license are available at https://www.dovepress.com/terms
and incorporate the Creative Commons Attribution
- Non Commercial (unported, 3.0) License.
By accessing the work you hereby accept the Terms. Non-commercial uses of the work are permitted
without any further permission from Dove Medical Press Limited, provided the work is properly
attributed. For permission for commercial use of this work, please see paragraphs 4.2 and 5 of our Terms.
© 2021 The Author(s). This work is published and licensed by Dove Medical Press Limited. The
full terms of this license are available at https://www.dovepress.com/terms
and incorporate the Creative Commons Attribution
- Non Commercial (unported, 3.0) License.
By accessing the work you hereby accept the Terms. Non-commercial uses of the work are permitted
without any further permission from Dove Medical Press Limited, provided the work is properly
attributed. For permission for commercial use of this work, please see paragraphs 4.2 and 5 of our Terms.