Back to Archived Journals » Open Access Journal of Sports Medicine » Volume 9
Concussion rates and effects on player performance in Major League Baseball players
Authors Sabesan VJ, Prey B, Smith R, Lombardo DJ, Borroto WJ ![]() , Whaley JD
, Whaley JD
Received 18 November 2017
Accepted for publication 4 May 2018
Published 13 November 2018 Volume 2018:9 Pages 253—260
DOI https://doi.org/10.2147/OAJSM.S157433
Checked for plagiarism Yes
Review by Single anonymous peer review
Peer reviewer comments 2
Editor who approved publication: Prof. Dr. Andreas Imhoff
Vani J Sabesan,1 Beau Prey,2 Ryan Smith,3 Daniel J Lombardo,3 Wilfredo J Borroto,4 James D Whaley5
1Levitetz Department of Orthopaedic Surgery, Cleveland Clinic Florida, Weston, FL, USA; 2Western Michigan University School of Medicine, Kalamazoo, MI, USA; 3Department of Orthopaedic Surgery, Wayne State University School of Medicine, Detroit, MI, USA; 4Ponce School of Medicine and Health Sciences, Ponce, PR, USA; 5Beaumont Health System, Detroit, MI, USA
Background: Major League Baseball (MLB) players are throwing the ball faster and hitting harder than ever before. Although some safety measures have been implemented, by decreasing the 15 days on the disabled list (DL) to the 7 days on the DL, concussion rates remain high across positions and may impact player performance. Our hypothesis was, there would be an increase in concussion incidence following implementation of the 7 day DL, but this would not have a negative impact on player’s postconcussion performance.
Study design: This is a descriptive epidemiology study.
Methods: The concussed players from 2005 to 2016 were identified from the MLB DL and verified using established new sources. Position-specific performance metrics from before and after injuries were gathered and compared to assess effects of the injury. Postconcussion performance metrics were compared before and after the 7-day DL rule implementation.
Results: A total of 112 concussed players were placed on the DL. For all position players, the batting average (BA) and on-base percentage (OBP) showed a nonsignificant decline after injury (P=0.756). Although performance statistics for pitchers declined on average, the trend was not statistically significant. Postinjury BA and OBP did not significantly change before (0.355) and after (0.313) the 7-day DL rule change in 2011 (P=0.162).
Conclusion: The incidence of reported concussion has increased with the 7-day DL rule change. Concussion incidence was highest in catchers and pitchers compared with all other players. The most common causes identified as being hit by pitch or struck by a foul ball or foul tip. While new league rules prevent collisions with catchers at home plate, injury by a foul tip was the most common cause for concussion. The shortened time spent on the DL did not negatively impact player’s performance. Further research on protective helmets for catchers may reduce concussion incidence.
Keywords: baseball, epidemiology, head injuries/concussion, MLB, performance
Introduction
With increased athletic ability and performance in baseball, players are throwing with higher velocity and hitting with greater power than ever before.1 This creates more exciting games; however, it also has an increased rate of injuries among Major League Baseball (MLB) players. Between years 2005 and 2008, there was a 37% increase in MLB injuries and these most commonly included hit by a batted ball, foul balls, and line drives.2
Horrifying events such as batted line drives impacting an unprotected pitcher’s skull and high-velocity fastballs dislodging a batter’s helmet are becoming more frequent in the MLB. These stunning visuals, in combination with the resulting, highly publicized long-term negative impact on players’ quality of life, have garnered them more attention than ever in recent years. As pitch velocity increases, batters have less time to react with wild pitches and face a greater risk of being struck. Furthermore, in response to increasing pitch velocity, batters are becoming stronger and hitting with greater power and faster velocity, resulting in field players having less time to react to line drives and ground balls.3 Several studies on the effect of protective head gear on the reduction of head injuries were performed and showed that helmets generally attenuate the impact and decrease head acceleration. The early work of Jones and Mohan in 1984 on the impact of the high-speed ball (90–100 mph) on the helmeted and nonhelmeted head showed that helmets decreased the head acceleration by various degrees in relation to the impact mode; they recommended the use of energy absorbing foam in baseball helmets that could help in reducing head injuries.4
An epidemiological study using data from 2002 and 2008 by Posner et al2 showed that head injuries account for ~1.3% of all MLB injuries per season and that fielders have more head injuries than pitchers. In addition, a more recent study by Green et al5 showed that mild traumatic brain injury is an important problem in professional baseball players, especially for catchers. Thus, it is clear that acknowledging and mitigating these types of injuries are critical to maintaining MLB players’ future health and safety.
As the game of baseball changes and new risks arise, so does the variety of safety considerations and precautions taken by MLB administration. In 2005, batting helmets with molded crowns were introduced as they produced a tighter fit on a player’s head, but the effectiveness of these helmets in preventing or reducing the risk of head injuries has not been shown in any MLB-specific study. Even so, the overwhelming majority of players opted to use these helmets.6 In 2009, the issue of concussions in MLB was identified as a recurring problem and, in response, Rawlings unveiled yet a new batting helmet (S100) (Table 1).7 These new helmets were thicker and stronger and able to protect players from injury from baseballs traveling at speeds up to 100 mph, compared with the previous helmets, which only provided protection from balls traveling up to 70 mph.8 Even so, it was not until 2013 that the MLB made helmets mandatory.9 Although head injuries are predominately seen in batters, catchers are also at risk and, therefore, changing helmets is not the only available preventative measure.10 Catcher’s risk of injury is not only due to errant balls but also through bodily contact with other players, which led to the MLB rules’ committee recently passed new regulations banning home-plate collisions between catchers and runners.11 In 2014, the rules’ committee also implemented additional safety measures for pitchers, approving a padded cap to give them more protection against line drives.12 However, these protective measures have largely been implemented based on anecdotal evidence, due to the limited published literature on rates of head and face injuries in MLB players.
 | Table 1 Differences between the standard MLB helmet and the Rawlings S100 Abbreviation: MLB, Major League Baseball. |
Concussions and head injuries have recently been in the national spotlight among both scientific communities and organized professional athletic leagues with the National Football League and National Collegiate Athletic Association both recently facing $675 million and $70 million, respectively, in legal settlements of concussion lawsuits.13,14 As recognition of the magnitude and long-term impact of concussion injuries increases, surveillance, treatment, and understanding of concussions in athletes must increase as well. However, to date, there are limited data regarding effects of concussions on athletic performance in the time immediately following the injury. One study by Wasserman et al15 found that although some concussed players may be asymptomatic upon return to play, residual effects were seen in their batting skills. They evaluated 66 MLB players placed on the DL as a result of concussion injuries. Hitting metrics such as on-base percentage (OBP) and batting average (BA) were used to evaluate players’ pre- and postconcussion performance, and a significant decline in performance was seen in the postconcussion period. The purpose of our study was to ascertain the incidence and impact of concussions on MLB players following the implementation of the 7-day disabled list (DL) rule. The rule change, prompted by conspicuous underreporting of concussion symptoms for the fear of losing their spot on the roster, encourages players to disclose concussion symptoms openly and earlier. We hypothesized that incidence of concussion would be artificially inflated following implementation of the new 7-day DL rule than before, not because the actual number of concussions had increased, but because more would be reported. In addition, based on previous studies suggesting that risk of concussion and magnitude of injury varies by position, we further hypothesized that risk of concussions would be greater in catchers than other positions.5,16
Methods
Players in the MLB who sustained concussion injuries were identified from the MLB DL database.17 Player name, position (pitcher, catcher, or field player), and length of time on the DL were recorded for all players reported as having a concussion from 2005 to 2016. Data for players identified as injured were verified, and additional details obtained through review of articles published by Entertainment and Sports Programming Network about the players and their injuries. A popular sports website,18 which reports comprehensive information on players, including extensive biographies and transaction histories, was used to determine if injured players had a previous history of concussions based on MLB DL transactions.19 These methods have been used in previous studies to verify the accuracy of injury information of MLB players who had undergone ulnar collateral ligament repair.20
Performance metrics data were collected for injured players using a well-cited baseball statistics repository.9,21 Metrics used to measure athlete performance differed for pitchers and catchers/field players. For pitchers, collected metrics were earned run average (ERA) and walks and hits per innings pitched (WHIP). For catchers and field players, we collected at BA, hits per at bats, OBP, and hits and walks per at bat. Performance metrics by season and career averages were recorded. Pre- and postinjury metrics were based on the season when an injury occurred. The all-star break in mid-July was used to classify injuries as happening early (pre-break) or late (post-break) in the season. If an injury occurred before the break, then preinjury performance metrics were those from the previous season. If an injury occurred after the break, then both pre- and postinjury performance metrics from the same season were used.If a player missed more than half of the season (>81 games) due to injury, then performance metrics for pre- and post injury from the previous and subsequent seasons were used.
Using MLB data, the total number of injuries for pitchers, catchers and field players who were placed on the DL was determined. This information was used to estimate the proportion of head and face injuries in these players. To calculate the relative risk of concussion at the different positions, it was assumed that there were four catchers, eight infielders, eight outfielders, and 20 pitchers on each of the 30 team’s rosters. Independent sample t-tests were performed to compare averages between groups. Paired sample t-tests were performed to compare pre- and postinjury statistics. The potential effect of a shorter DL time on player performance was analyzed by comparing postinjury performance before and after the implementation of the 7-day DL rule. All statistics were performed using the SPSS software (IBM Corporation, Armonk, NY, USA) with a significance level of 0.05.
Results
One hundred twelve players placed on the DL with a concussion were identified over the 11-year period. Of these players, there were 39 (34.8%) outfielders, 37 (33%) catchers, 23 (20.5%) infielders, 10 (8.9%) pitchers, and 3 (2.7%) batters. The incidence rate of concussions increased significantly among players in all positions after the implementation of the 7-day DL rule in 2011 (P=0.003). Based on the estimated number of players at each position in the league, fielders demonstrated the greatest incidence rate of concussion with 9 per 100,000 athlete exposures. The incidence rate in catchers was 3 per 100,000 athlete exposures. The most common causes of concussion were being struck with a foul tip or foul ball (25%), collisions with the field wall or other players (23.2%) and hit by a pitch (25.9%) (Figure 1). The number of concussed players on the DL increased every year throughout our sample with a low of 4 in 2005 to a high of 21 in 2013 with rates being the highest for the following years after the 7-day DL rule change in 2011 (Figure 2). Two players were excluded from further analysis, as one player was not able to return to play following concussion and another player missed additional time due to migraine symptoms.
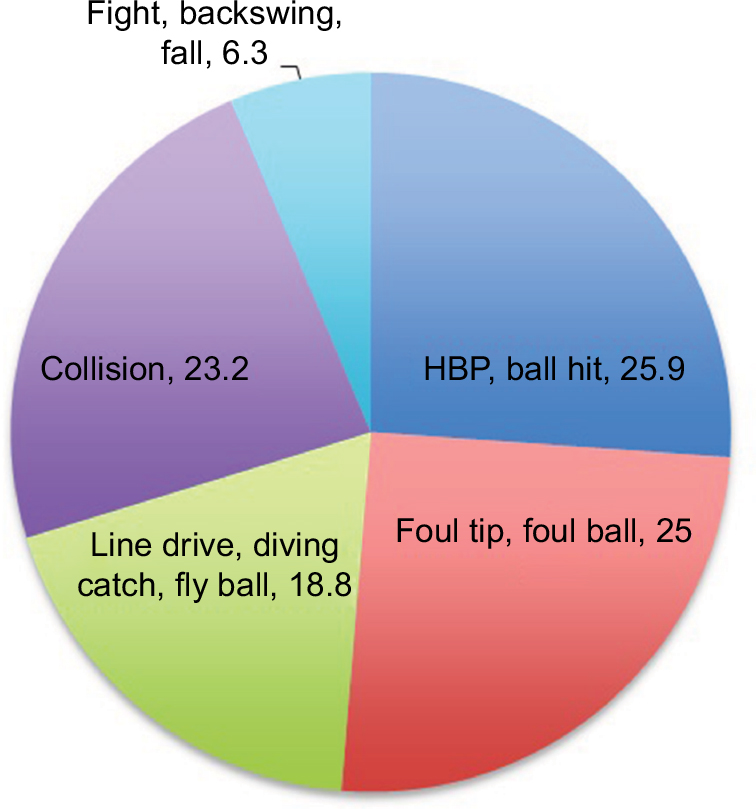 | Figure 1 Most common causes of concussions in MLB players at all positions from 2010 to 2013. Note: HBP indicates players who were hit by pitch. Abbreviation: MLB, Major League Baseball. |
 | Figure 2 Annual incidence of concussion in all position MLB players. Abbreviations: DL, disabled list; MLB, Major League Baseball. |
Players missed an average of 31.3 days following concussions (range 6–183 days). The number of concussions appeared to increase after the 7-day DL rule implementation in 2011. When stratifying players based on the cause of concussion, players who were injured in a collision or fall missed an average of 28.94 days, whereas players who were injured by the ball missed 42.26 days; however, this difference was not statistically significant (P=0.240).
When comparing performance metrics for pitchers, the average preinjury ERA was 3.64 and the preinjury WHIP was 1.33. These averages increased postinjury to an average ERA of 3.78 and an average WHIP of 1.51; however, these increases were not statistically significant (P=0.800 and 0.338) (Table 2). When comparing performance metrics for all other players, the average of BA and OBP was 0.256 and 0.322 preinjury (Table 3). Decline in performance metrics postinjury was nonsignificant in BA (0.25, P=0.580) and OBP (0.32, P=0.756) (Table 4).
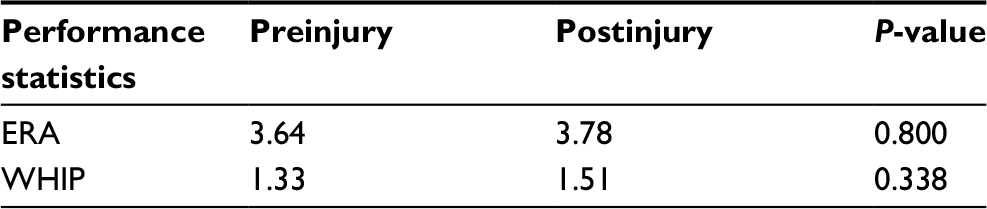 | Table 2 Pre- and postinjury performance statistics for pitchers Abbreviations: ERA, earned run average; WHIP, walks and hits per inning pitched. |
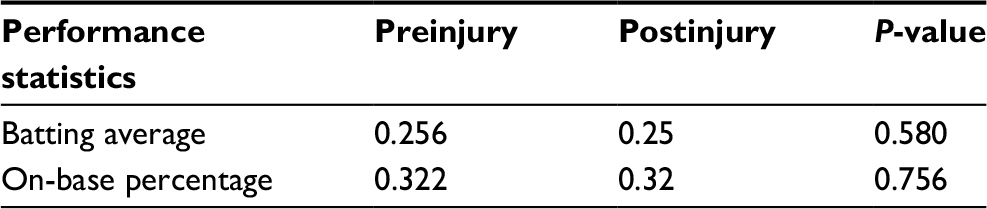 | Table 3 Pre- and postinjury performance statistics for all position players |
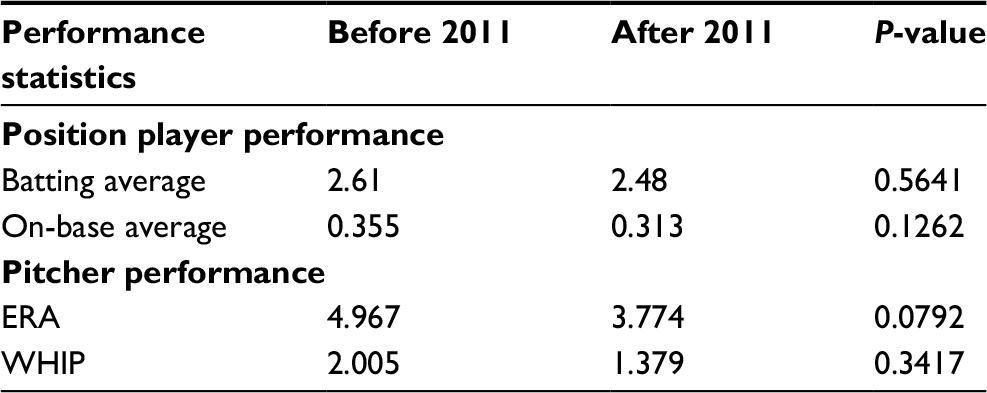 | Table 4 Postinjury performance statistics before and after the 7-day DL rule implementation Abbreviations: DL, disabled list; ERA, earned run average; WHIP, walks and hits per inning pitched. |
For all position players, performance statistics did not show a significant decline on neither BA (P=0.564) nor OBP (P= 0.162) after the 7-day DL rule implementation when compared with before 2011. Pitchers showed a nonsignificant decrease in both ERA (P=0.079) and WHIP (P=0.241) (Figures 3 and 4).
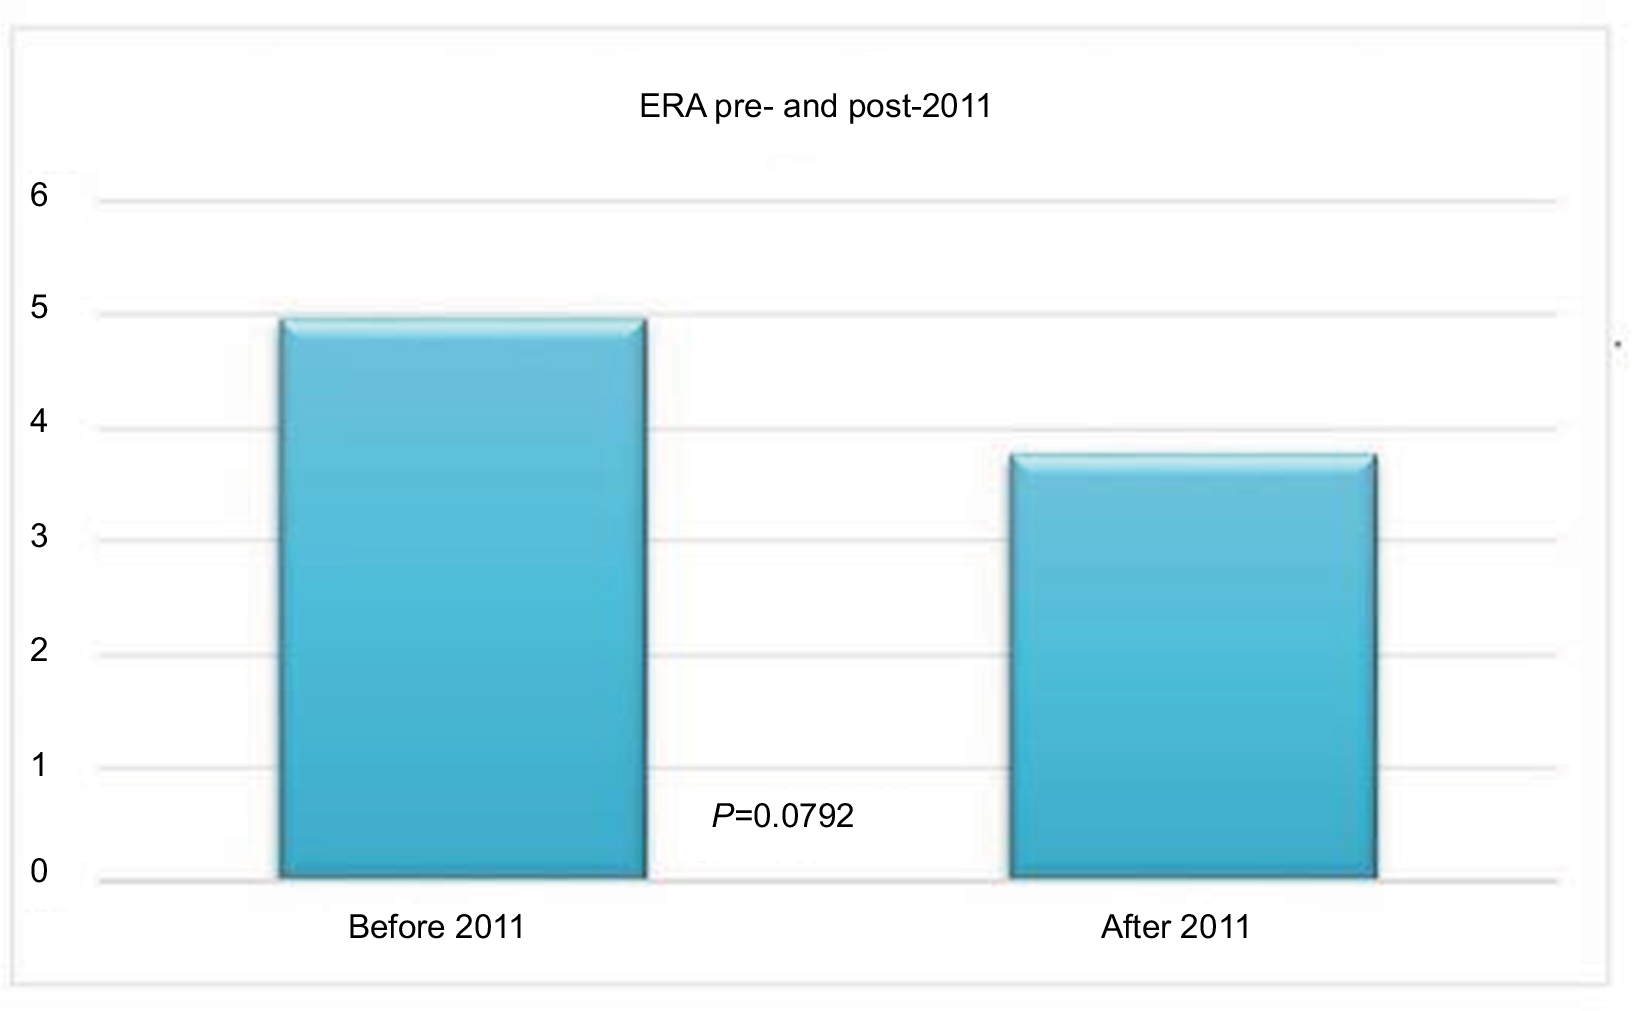 | Figure 3 Postinjury ERA compared pre- and post-2011. Abbreviation: ERA, earned run average. |
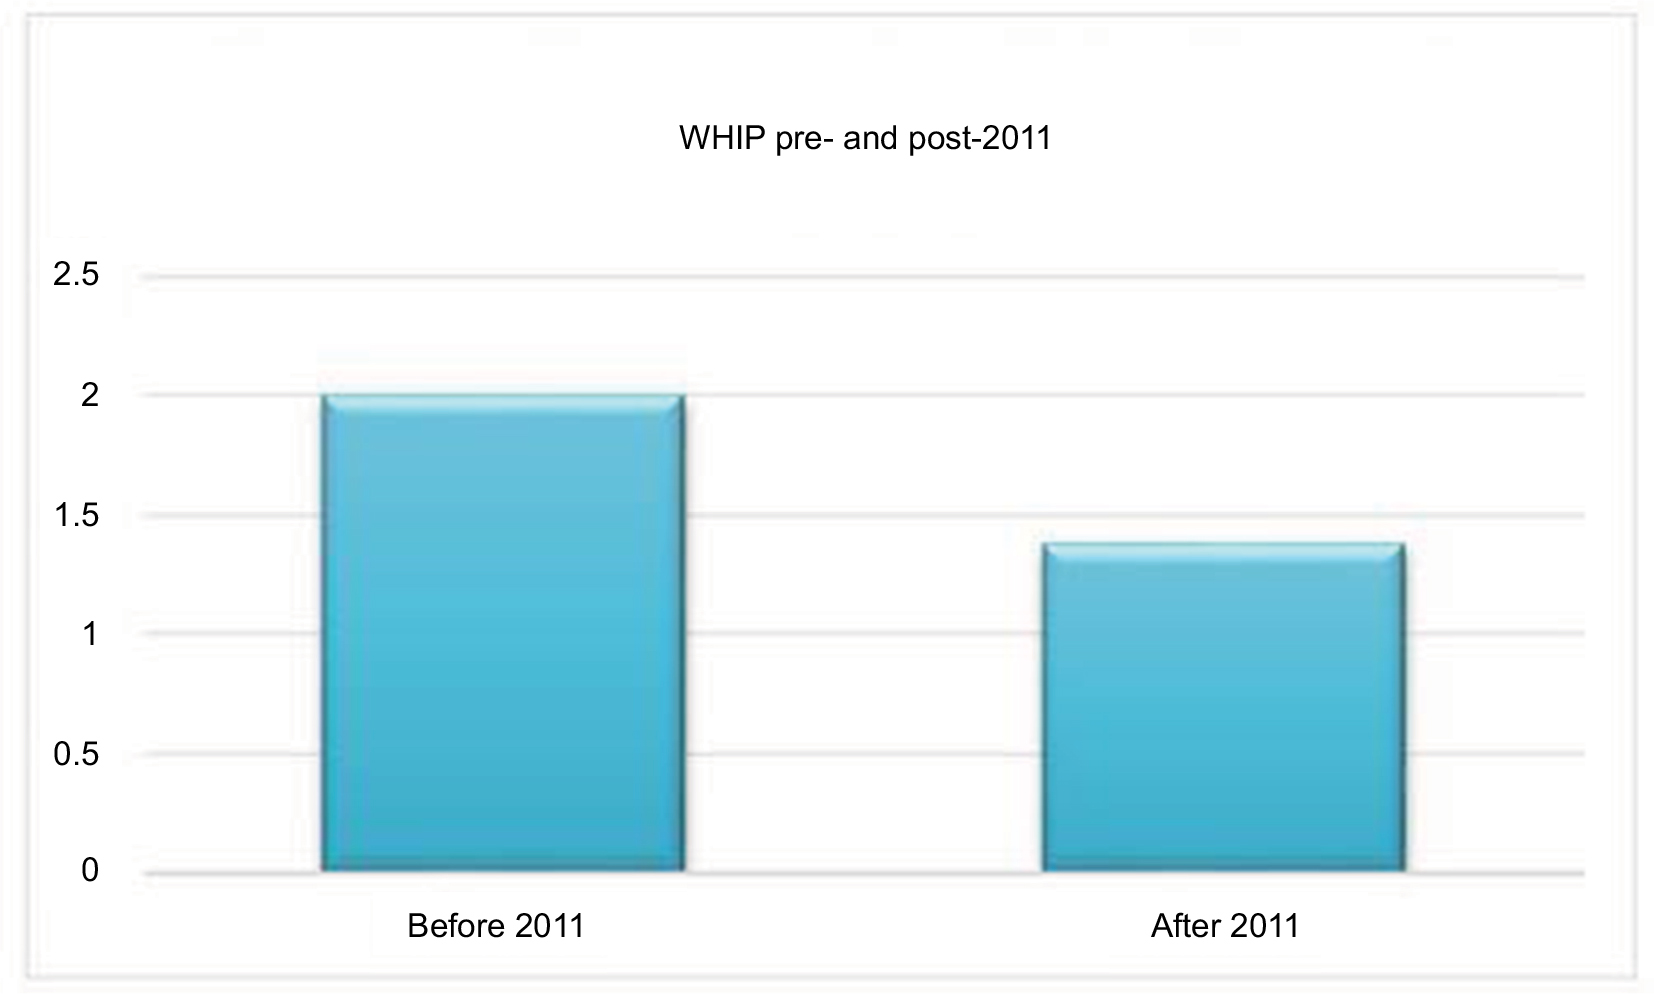 | Figure 4 Postinjury WHIP compared pre- and post-2011. Abbreviation: WHIP, walks and hits per inning pitched. |
Discussion
Due to the serious long-term consequences of concussions, the study of these injuries has been of increased importance in the athletic world, to both the scientific and lay communities.22 In order to better manage concussions in MLB players, the league implemented a 7-day DL in 2011, which gave team physicians and injured players more flexibility to address head injuries. Moreover, the league has been continually striving to provide better protective equipment. One study by Green et al looked at mild traumatic brain injury (MTBI) in minor and major league players over two seasons (2011 and 2012). Of the players they evaluated, there were 21 reported concussions in MLB players, specifically 10 catchers, six infielders, three outfielders, and two pitchers. They also found that the reason for higher concussion rates in catchers was being hit with batted balls and/or colliding with other players. In addition, they found that the most common mechanism of concussion injury for all players is contact with a batted ball (29.3%).5 Our results support this assertion, having found that the most common cause of concussion was being struck with a foul tip or foul ball (25.9%). However, our results differed in that fielders in our study had a significantly high incidence of concussions. One explanation for the higher rates of concussion in fielders in our study (n=62) is that we combined outfielder and infielder positions compared with catchers (n=37), whereas Green et al reported concussions in infielders and outfielders separately. In addition, implementation of a new rule preventing direct collisions with catchers may have also impacted our results, which also differed from the Green et al5 study. Our results demonstrate increased reporting of concussions as a result of the 7-day DL rule change. The rates of reporting have almost doubled, with 112 players placed on the DL for concussions over the past 11 years, compared with previous results of 31 players placed on the DL for concussions from 2001 to 2010.16 Before implementation of the 7-day rule change, players may have been less inclined to report concussion symptoms knowing that no matter how slight the injury, it would be mandatory to remain off the roster for 15 days. The 7-day DL rule allows evaluation of the player by a team physician at 7 days, at which time they can be cleared to play or transferred to the 15 or 60 days if necessary to recuperate.23 The 7-day DL is also in concordance with the most recent guidelines for return to play following a concussion based on the International Conference on Concussion in Sport, which concluded that, to take off, the player away from the field for 7 days is an optimal time to recuperate from injury without significant sequelae.24
According to the MLB policy, return to play for a player after concussion requires that all symptoms have resolved even with exertion and the team’s assigned physician determines whether it is safe to reengage in sports. Interestingly, even with the shortened DL rule, players still missed almost a month (31 days) on average due to concussion. In comparison, professional hockey players miss only 8.3 games based on previously reported data,25 which typically amounts to a span of 18 days based on the NHL scheduling. It is unclear why postconcussion time loss is higher in MLB players, but our findings are consistent with previous reports, where MLB players missed an average of 32.12 days following concussion.16 Further evaluation should focus on why MLB players are out for extended periods of time after a concussion injury.
Although competitive MLB players are eager to return to play following injury, it is the responsibility of the team physicians and healthcare providers to manage the symptoms before affirming medical clearance for players to return to play. Our results suggest that the rule change, which decreases the number of initial mandatory days on the DL from 15 to 7, does not negatively impact player’s performance. These results differ from those reported by Wasserman et al, which demonstrated that even players who were asymptomatic and cleared to play after 7 days had a significant decline in performance metrics, including BA, OBP, slugging percentage, and on-base plus slugging. However, they excluded pitchers, which constituted 8.9% of our cohort and the performance metrics included were only similar for BA and OBP.15 Finally, Wasserman’s evaluation of pre- and postinjury performance metrics were at 2 and 6 weeks, whereas we looked at pre- and postinjury performance metrics based on the season when injuries occurred.15
Similarly, previous studies of NFL, NHL, and NBA players failed to show a decline in performance after concussion.16,25–27 The MLB has a better tracking of player statistics compared with other sports where performance can be more difficult to objectively evaluate. On a similar matter, the decrease in DL time proves more cost-effective for teams since they pay the replacement player less days. Further studies should look at the cost analysis of the 7-day DL concussion rule and the financial effects it entails.
Our study also focused on injury rates based on player positions. We found an increased rate of concussions in infielders and outfielders combined, which is probably due to the increased risk of encountering a collision or being struck by a ball. The second highest rate of concussion by position was found in catchers. This finding indicates that the current helmets available for catchers do not provide adequate protection for these players. Future studies need to evaluate the impact on concussion rates in catchers after the recent ban on collisions at home plate.
This study has several limitations based on the available data. Data were collected from publicly available databases and not directly from players’ medical records, which could have resulted in reporting bias. Furthermore, by simply assessing player statistics following concussion, we did not evaluate the neurocognitive function of players after injury and this may be oversimplifying a complex problem.
Concussion injuries are of concern to all athletes.28 The results reported in this study provide valuable information for athletes and team physicians alike regarding concussion rates in MLB players. The advent of the 7-day DL rule has led to an increased rate of reporting concussions. This increased reporting provides more data to assess an athlete’s postconcussive performance. However, since postinjury statistics is very similar to pre- and postinitiation of the 7-day DL rule, it can be argued that the 7-day DL rule has provided a safe and efficient way for players to recover from concussion injuries. In addition, our findings provide significant data for further amendments in MLB policies and advancements in the protective equipment used by the MLB players. Using other sports as examples, it is clear that concussion injuries can result in long-term sequelae; thus, recognition and measures to maintain player safety must take precedence in the realm of concussion management.
Acknowledgments
This article has not been previously submitted for publication or published. This work has not received any outside funding or grants.
Disclosure
The authors report no conflicts of interest in this work.
References
Sawchik, T. (2014). MLB pitchers setting velocity records, altering balance of power. Trib Live, 5423918–74. | ||
Posner M, Cameron KL, Wolf JM, Belmont PJ Jr, Owens BD. Epidemiology of major league baseball injuries. Am J Sports Med. 2011;39(8):1676–1680. | ||
Rosenthal K [webpage on the Internet]. MLB Studying Headgear for Pitchers. 2014. Available from: http://www.foxsports.com/mlb/story/line-drive-comebackers-head-trauma-studying-protective-headgear-for-pitchers-brandon-mccarthy-juan-nicasio-091712. Accessed June 21, 2014. | ||
Jones ISM. In: Administration NHTS, editor. Head Impact Tolerance: Correlation Between Dummy Impacts and Actual Head Injuries. Arlington, VA: Insurance Institute for Highway Safety; 1984. | ||
Green GA, Pollack KM, D’Angelo J, et al. Mild traumatic brain injury in major and Minor League Baseball players. Am J Sports Med. 2015;43(5):1118–1126. | ||
Lukas P [webpage on the Internet]. MLB Midseason Fashion Report. 2005. Available from: http://sports.espn.go.com/espn/page2/story?page=lukas/050714&num=0. Accessed June 21, 2014. | ||
Lukas P [webpage on the Internet]. Better to Look Good Than Feel Good? 2009. Available from: http://sports.espn.go.com/espn/page2/story?page=lukas/090831&sportCat=mlb. Accessed June 21, 2014. | ||
Waldstein, D. (2009, August 12). Safer batting helmet draws resistance from some players. New York Times [New York], p. B11. | ||
CISION Prnewswire [webpage on the Internet]. MLB Players to Debut New Rawlings S100 Pro Comp™ Batting Helmet This Season. 2012. Available from: http://www.prnewswire.com/news-releases/mlb-players-to-debut-new-rawlings-s100-pro-comp-batting-helmet-this-season-146991495.html. Accessed June 21, 2014. | ||
Athiviraham A, Bartsch A, Mageswaran P, et al. Analysis of baseball-to-helmet impacts in Major League Baseball. Am J Sports Med. 2012;40(12):2808–2814. | ||
Hagen P [webpage on the Internet]. MLB Votes to Eliminate Homeplate Collisions. 2013. Available from: http://mlb.mlb.com/news/article/mlb/mlb-rules-committee-votes-to-end-home-plate-collisions?ymd=20131211&content_id=64598138. Accessed July 30, 2014. | ||
Hagen P [webpage on the Internet]. MLB Approves New Padded Cap for Pitchers. 2014. Available from: http://mlb.mlb.com/news/article/mlb/major-league-baseball-approves-padded-cap-for-pitchers?ymd=20140128&content_id=67202016. Accessed June 21, 2014. | ||
Mihoces G [webpage on the Internet]. NFL Concussion Settlement Gets Preliminary Approval. 2014. Available from: http://www.usatoday.com/story/sports/nfl/2014/07/07/nfl-concussion-lawsuit/12312179/. Accessed August 7, 2014. | ||
[webpage on the Internet]. NCAA Reaches Proposed Settlement in Concussion Lawsuit. 2014. Available from: http://www.ncaa.com/news/ncaa/article/2014-07-29/ncaa-reaches-proposed-settlement-concussion-lawsuit. Accessed August 7, 2014. | ||
Wasserman EB, Abar B, Shah MN, Wasserman D, Bazarian JJ. Concussions are associated with decreased batting performance among Major League Baseball players. Am J Sports Med. 2015;43(5):1127–1133. | ||
Schwindel LE, Moretti VM, Watson JN, Hutchinson MR. Epidemiology and outcomes of concussions in Major League Baseball. Ann Orthop Rheumatol. 2014;2(3):1022–1027. | ||
Major League Baseball Disabled List Data. 2014. Available from: https://www.fangraphs.com/tht/2014-disabled-list-information-and-so-much-more/. Accessed September 13, 2019. | ||
MLB.com. Fantasy baseball injuries updtates. Available from:http://mlb.mlb.com/mlb/fantasy/injuries/. Accessed September 13, 2019. | ||
TSN: MLB. 2014. Available from: https://www.tsn.ca/mlb/players. Accessed September 13, 2019. | ||
Erickson BJ, Gupta AK, Harris JD, et al. Rate of return to pitching and performance after Tommy John surgery in Major League Baseball pitchers. Am J Sports Med. 2014;42(3):536–543. | ||
Baseball-reference.com [webpage on the Internet]. Available from: http://www.baseball-reference.com/. Accessed July 12, 2014. | ||
Mihalik JP, Stump JE, Collins MW, Lovell MR, Field M, Maroon JC. Posttraumatic migraine characteristics in athletes following sports-related concussion. J Neurosurg. 2005;102(5):850–855. | ||
Schwartz A. 7-Day D.L. Estbalished to Aid in Recovery from Concussions. New York: New York Times; 2011. | ||
McCrory P, Meeuwisse W, Aubry M, et al. Consensus statement on Concussion in Sport – the 4th International Conference on Concussion in Sport held in Zurich, November 2012. J Sci Med Sport. 2013;16(3):178–189. | ||
Wennberg RA, Tator CH. Concussion incidence and time lost from play in the NHL during the past ten years. Can J Neurol Sci. 2008;35(5):647–651. | ||
Yengo-Kahn AM, Zuckerman SL, Stotts J, et al. Performance following a first professional concussion among National Basketball Association players. Phys Sportsmed. 2016;44(3):297–303. | ||
Kumar NS, Chin M, O’Neill C, Jakoi AM, Tabb L, Wolf M. On-field performance of national football league players after return from concussion. Am J Sports Med. 2014;42(9):2050–2055. | ||
Zuckerman SL, Yengo-Kahn AM, Kerr ZY. Chapter 15. Athletic performance after sport-related concussion. In: Hall EE, Ketcham CJ, editors. Concussions in Athletics: Assessment, Management and Emerging Issues. Elon, NC: Nova Science Publishers, Incorporated; 2017:211–222. |
 © 2018 The Author(s). This work is published and licensed by Dove Medical Press Limited. The
full terms of this license are available at https://www.dovepress.com/terms
and incorporate the Creative Commons Attribution
- Non Commercial (unported, 3.0) License.
By accessing the work you hereby accept the Terms. Non-commercial uses of the work are permitted
without any further permission from Dove Medical Press Limited, provided the work is properly
attributed. For permission for commercial use of this work, please see paragraphs 4.2 and 5 of our Terms.
© 2018 The Author(s). This work is published and licensed by Dove Medical Press Limited. The
full terms of this license are available at https://www.dovepress.com/terms
and incorporate the Creative Commons Attribution
- Non Commercial (unported, 3.0) License.
By accessing the work you hereby accept the Terms. Non-commercial uses of the work are permitted
without any further permission from Dove Medical Press Limited, provided the work is properly
attributed. For permission for commercial use of this work, please see paragraphs 4.2 and 5 of our Terms.