Back to Journals » Therapeutics and Clinical Risk Management » Volume 14
Computed tomography colonography versus colonoscopy for the diagnosis of colorectal cancer: a systematic review and meta-analysis
Authors Duarte RB, Bernardo WM, Sakai CM, Silva GLR, Guedes HG, Kuga R, Ide E, Ishida RK, Sakai P, de Moura EGH ![]()
Received 20 September 2017
Accepted for publication 13 November 2017
Published 21 February 2018 Volume 2018:14 Pages 349—360
DOI https://doi.org/10.2147/TCRM.S152147
Checked for plagiarism Yes
Review by Single anonymous peer review
Peer reviewer comments 2
Editor who approved publication: Professor Garry Walsh
Ralph B Duarte, Wanderley M Bernardo, Christiano M Sakai, Gustavo LR Silva, Hugo G Guedes, Rogerio Kuga, Edson Ide, Robson K Ishida, Paulo Sakai, Eduardo GH de Moura
Gastrointestinal Endoscopy Unit of Hospital das Clínicas of São Paulo University Medical School, São Paulo, SP, Brazil
Abstract: Colorectal cancer (CRC) is a significant cause of morbidity and mortality. Optical colonoscopy (OC) is the first choice of investigation for assessing the state of the colon and it is excellent for CRC screening. Newer technologies such as computed tomography colonography (CTC) may also be useful in CRC screening. This systematic review compares the benefits of CTC and OC for CRC screening. This review includes all the available randomized clinical trials comparing CTC and OC for CRC screening in asymptomatic patients. Three studies were included in the systematic review and were submitted for meta-analysis. In the analysis of participation rates, only 2,333 of 8,104 (29%) patients who were invited for screening underwent the CTC, and only 1,486 of the 7,310 (20%) patients who were invited for screening underwent OC. The absolute risk difference in participation rate in the two procedures was 0.1 (95% CI, 0.05–0.14) in favor of CTC. In the analysis of advanced colorectal neoplasia (ACN) detection rates, 2,357 patients undergoing CTC and 1,524 patients undergoing OC were included. Of these, 135 patients (5.7%) who underwent a CTC and 130 patients (8.5%) who underwent an OC were diagnosed with ACN. The absolute risk difference in ACN detection rate in the two procedure types was -0.02 (with a 95% CI between -0.04 and -0.00) in favor of OC. CTC is an option for CRC screening in asymptomatic patients. However, as CTC was inferior in detecting ACN, it should not replace OC, which remains the gold standard.
Keywords: computed tomography colonography, colonography, CT colonography, virtual colonoscopy, colonoscopy, colorectal neoplasm, colorectal cancer, colorectal cancer screening, colonic polyp, colonic adenoma
Introduction
Rationale
Adenomas are benign gastrointestinal epithelial tumors with a potential to progress to adenocarcinomas. They may be sessile or pedunculated polyps and have different degrees of dysplasia and different histological characteristics, that is, tubular, tubulovillous, or villous. The risk of malignant transformation of adenomas is associated with their histological type, degree of dysplasia, and size. Follow-up studies on patients with colonic adenomas have found that the adenocarcinoma risk among patients with adenomatous polyps >1 cm was 4% after 5 years, 7.4% after 10 years, and 12.4% after 20 years.1,2
The term advanced adenoma is used for adenomas with features of increased malignancy risk. Although definitions vary, this term is typically used for adenomas ≥1 cm, with a villous (villous or tubulovillous) component or a high degree of dysplasia.3 When tumors involve the large intestine, adenocarcinomas are referred to as colorectal adenocarcinomas or colorectal cancers (CRCs). The term advanced colorectal neoplasia (ACN) refers to the set of neoplasms including advanced adenomas and different CRCs.
CRCs are a significant cause of morbidity and mortality in the United States. Although CRC incidence has declined over the past 20 years, it is the third most common neoplasia in terms of incidence and cause of death among both men and women. According to 2007–2011 data, annual CRC incidence in the United States is 43.7 cases per 100,000 individuals, with ~95% diagnoses occurring in adults aged >45 years. The survival of patients with CRC depends largely on disease stage at diagnosis. Patients with localized disease at diagnosis have a 90% 5-year survival rate. However, the rate decreases to 70% when the disease involves regional lymph nodes at diagnosis and 12% in cases of distant metastasis. The average age at diagnosis is 68 years, and ~50% cases are diagnosed in 68–84-year-old patients.3
According to the Brazilian National Cancer Institute (INCA), CRC incidence in Brazil in 2010 varied across regions; it was higher in the southern and southeastern regions (19–21 cases per 100,000 individuals) and lower in all other regions.4
CRCs normally develop over a prolonged period and start as adenoma.5,6 Approximately 95% of CRCs are estimated to originate as preexisting adenomas.7,8
Because CRC arises from precursor lesions and the survival of the neoplastic patient largely depends on the disease stage at diagnosis, screening is a form of secondary prevention (finding precancerous lesions that could later become malignant and early detection of cancers that can be treated more effectively).3
Randomized clinical trials (RCTs) with large populations and reliable methods have demonstrated that CRC screening can decrease CRC incidence and disease-specific mortality. CRC incidence and mortality has decreased in the United States over the last two decades – from <25% in the 1980s to approximately 52% in 2002 and around 65% in 2012 – and this is associated with increased screening rates.9
Screening methods can be categorized into two groups: low-sensitivity CRC tests for detecting polyps (the fecal occult blood test, fecal immunohistochemical test [FIT], and fecal DNA test) and tests detecting polyps and cancers by providing lesion images (flexible sigmoidoscopy, optical colonoscopy [OC], and computed tomography colonography [CTC]).10,11
Both OC and CTC allow accurate assessments of the entire colon. However, OC is widely accepted as the standard investigation for detecting CRC because removal of adenoma can be performed during the procedure itself.10
Since its development in 1994, CTC has advanced, because of improvements in the analysis software.12 In 2007, the first detailed consensus on the best way to perform the investigation and interpret the results was published.13 In 2013, the medical recommendations of the Food and Drug Administration agreed that the benefits of using CTC for CRC screening outweighed the risks (eg, exposure to radiation and the identification of extracolonic findings).14
Objectives
This systematic review seeks to compare the benefits of CTC to those of OC in the CRC screening process in RCTs available in the literature.
Methods
This systematic review follows the recommendations of Preferred Reporting Items for Systematic Reviews and Meta-Analysis.
Protocol and registration
A protocol specifying the eligibility criteria and analysis methods for the studies included in this systematic review and meta-analysis was established and documented prior to the start of this review. It can be accessed at http://www.crd.york.ac.uk/PROSPERO, and its record number is CRD42016046838.
Eligibility criteria
Types of studies
This review considered RCTs that compared the benefits of CTC and OC in CRC screening in asymptomatic patients in whom CRC screening is indicated (age ≥50 years), without a family history of CRC, who had not previously undergone screenings, and who had no contraindications for the investigative methods. Only complete papers were included. There were no restrictions regarding language.
Types of participants
There was a restriction regarding the studies that involved only asymptomatic patients. There were no restrictions with regard to sex. Regarding age, there was restriction in that the population studied were those in the age range for which CRC screening is indicated (age ≥50 years).
Types of interventions
The intervention studied herein was CTC for CRC screening, performed to identify cases of ACN. The randomized studies included were those that compared this procedure to the gold standard, that is, OC. For comparing the procedures, the study had to include a histopathological analysis of the biopsies or polypectomies of the lesions considered positive in either of the two exams.
Types of outcome measurements
The analysis considered ACN detection rate as a primary outcome and participation rate in the screening program as a secondary outcome.
Information sources
The databases used in the searches were Medline/PubMed (all years), Scopus (1988–present), Cochrane Central Register of Randomized Controlled Trials/CENTRAL (all years), LILACS (all years), and CINAHL (all years). The last date on which all the databases were searched was November 2, 2016.
Search
The search strategies varied by database and are specified below:
- Medline/PubMed: (“Colonography, Computed Tomographic,” “Colonography computed tomographic,” “Computed Tomographic Colonography,” “colonoscopy, virtual,” “virtual colonoscopy,” “CT Colonography,” “Colonography, CT”) AND “random*”;
- LILACS, EMBASE, Cochrane/CENTRAL, Scopus and CINAHL: Colonography AND random*.
Study selection
This review considered RCTs that compared the benefits of CTC and OC in CRC screening in asymptomatic patients in whom CRC screening is indicated (age ≥50 years), without risk factors for CRC and a family history of CRC, who had not previously undergone screening, and who had no contraindications for the investigation methods.
Data collection process
The data were collected on the basis of the absolute numbers provided directly or inferred from information reported in the papers. These findings were placed in 2×2 tables, whenever possible, and separated to be analyzed per patient, in accordance with the data that could be extracted from each article.
Data items
Qualitative data, such as patient characteristics, study objectives, and methodologies, as well as quantitative data on the results were extracted from the studies included. The criteria considered for the positivity of the procedures in the meta-analysis were those established by the authors, provided these were appropriate.
Risk of bias in individual studies and across studies
The quality assessment of the studies included in the meta-analysis was performed using the revised version of the Quality Assessment of Diagnostic Accuracy Studies (QUADAS-2).15
Summary measures, synthesis of results, and planned methods of analysis
The 2×2 tables detail the rates of patients who participated in the study in the respective groups to which they had been invited (rate of participation), the rate of patients whose tests results were positive in each of the procedures (considering the positivity of each study), and the percentage of these patients whose test results were confirmed positive via histopathological analysis, represented by the positive predictive value (PPV), which in this study, is the probability that an individual who tested positive will, in fact, be diagnosed as having ACN. On the basis of the data in these tables, ACN detection rates among all patients who underwent the screening procedures (detection rate per participant) and among all patients invited for screening program (detection rate per invitee) were also obtained. ACN detection rate and participation rate in the screening program were selected for the extraction of data for the meta-analysis.
The statistical calculations were performed using the RevMan software, version 5.3.
Only the intent-to-treat analysis and the 95% confidence interval were considered, and p-values of <0.05 were considered as statistically significant.
Analytical graphs using funnel plots and forest plots were used for the summary of the results. Heterogeneity was calculated using the chi-square test and quantified using the I2 method of Higgins et al.16 The sensitivity analysis was performed when heterogeneity values of >50% were found.
The entire process was completed by two independent authors and revised by all authors.
Results
Study selection
In the searches performed in the Medline/PubMed, LILACS, Cochrane/CENTRAL, Scopus and CINAHL databases, 910 articles were identified. Of these, 524 were excluded because they were repetitions of items retrieved in different databases. A total of 386 articles remained. After evaluating the title and abstract of each paper, 375 were excluded because they were not relevant to the topic of this review. Of the remaining 11 articles, one was excluded because it was not related to the colonoscopy procedure.17 Five papers compared colonographies and colonoscopies and were randomized trials, but they assessed outcomes different from those studied in this systematic review, such as patients’ expectations of the exams, patients’ perceptions after the procedures, and the psychosocial impact of the procedures.18–22 Two other randomized studies,12,23 the outcomes of which were similar to that of this systematic review, were excluded because they involved symptomatic patients.
Three studies were included in this systematic review and meta-analysis,24–26 and data were collected and analyzed as per the previously described methodology. The flowchart used for this selection is shown in Figure 1.
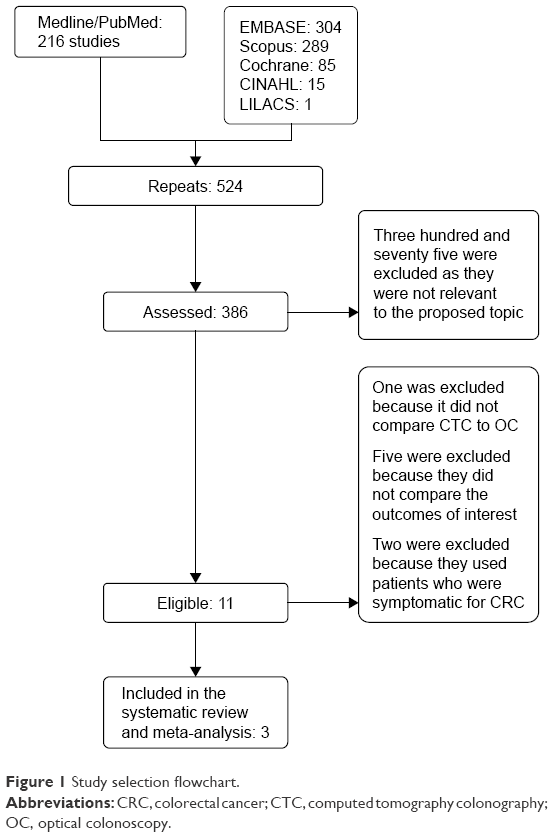 | Figure 1 Study selection flowchart. |
Study characteristics
Data were extracted from the studies using the patient, intervention, comparison intervention, outcome, study design (PICOS) strategy, distributed in a specific table, and explained separately in Supplementary material.
The three articles included in this systematic review supplied all the data necessary to compare participation rate of patients in the CTC and OC groups, as well as ACN detection rate. On the basis of these outcomes, a meta-analysis was possible. In the analysis of the diagnostic accuracy of CTC in ACN diagnosis, sensitivity, specificity, and negative predictive value could not be calculated. In these studies, not all patients underwent both procedures; according to the follow-up criteria of each study, only patients who had positive index test (CTC) results were instructed to undergo the reference standard (OC). Therefore, only the PPV could be calculated.
Risk of bias within studies and across studies
The quality assessment of all included studies using QUADAS-2 is detailed in Supplementary material.
All the three studies were found to exhibit a low risk of the patient selection having introduced bias, but there is a high risk that the conduct or interpretation of the index test, and of the reference standard having introduced bias, as well as a high-risk of patient flow having introduced bias.
As for the concerns regarding applicability, there is low concern that the patients included and that the target condition defined as a reference standard did not correspond to the issue addressed in the research, but there is a high concern that the index test, conduct, or interpretation differed from the issue addressed in the research.
Results of individual studies and syntheses of results
Patients
For the per-patient analysis, only data on the index test (CTC) group and the reference standard (OC) were extracted. The three studies supplied the number of patients invited (I) to undergo these two procedures, the number of patients eligible (E) for the study according to the inclusion and exclusion criteria, and the number of participants who underwent both procedures, referred to as Participants (P). All these data are described in Supplementary material.
Rate of participation
The participation rate was calculated considering the patients among those who were eligible and who agreed to participate in the group to which they were invited (CTC or OC). As Scott’s study26 had a third group that could choose the method (“choice” group), the number of patients in this third group cannot be assessed for the “rate of participation” outcome, because they chose the method to which they would be submitted. So, patients in the “choice” group were not considered, to ensure that basis for calculating participation rate was the same as that of the other studies, by dividing the number of participating patients by the number of eligible patients. In Sali’s study,24 the rate of participation in the full-preparation CTC (F-CTC) was significantly higher than that in the reduced-preparation CTC (R-CTC) (p=0.047). However, when this study evaluated the outcome “rate of participation”, the calculation considered the number of patients resulting from the combination of R-CTC + F-CTC. Table 1 presents all the data extracted from each study for the calculation of participation rate in each of the study groups.
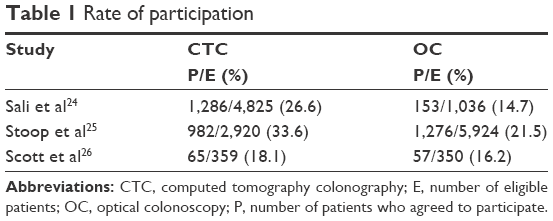 | Table 1 Rate of participation |
The three studies were analyzed regarding participation rate analysis, with a total of 8,104 patients invited to undergo a CTC and 7,310 patients invited to undergo an OC. Of these patients, 2,333 participated in the study involving CTCs and 1,486 participated in the study involving OCs. The absolute risk difference was 0.1 (with a 95% CI between 0.05 and 0.14) in favor of CTC and with heterogeneity of 83% (Figure 2).
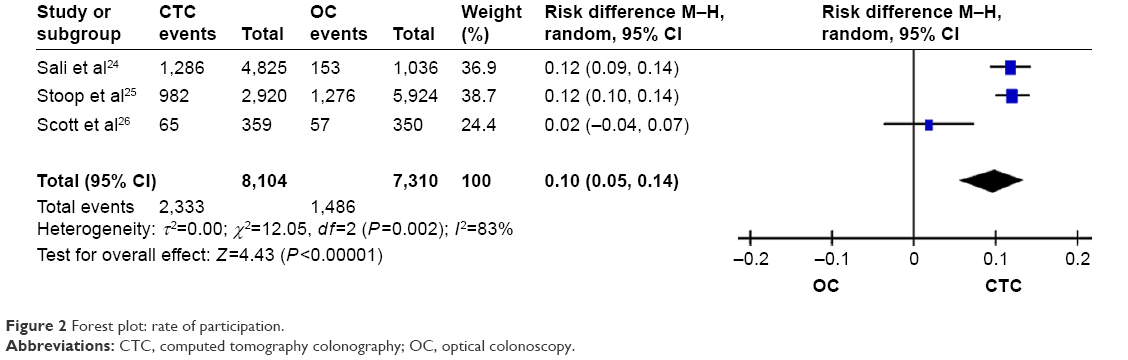 | Figure 2 Forest plot: rate of participation. |
Positive test results and follow-up
Table 2 presents the definition of a “positive test result”, the number of patients who had a positive test result and the number of patients who underwent both procedures.
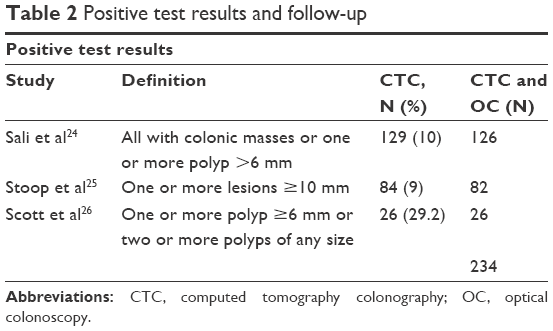 | Table 2 Positive test results and follow-up |
Rate of detection
For calculation of detection rate, patients with a final outcome of ACN were considered among all of those who underwent the procedures and among all patients invited for the screening program.
As there was no statistical difference between the rates of detection in the R-CTC and the F-CTC groups in Sali’s study, when this study evaluated the outcome “rate of detection,” the calculation considered the number of patients resulting from the combination of R-CTC + F-CTC.
As Scott’s study had a third group that could choose the method (“choice” group), the number of patients in this third group cannot be assessed for the “participation rate” outcome. However, for the analysis of the “rate of detection” outcome, the number of patients who agreed to perform the CTC (65) was added to the number of patients of the third group who underwent the CTC procedure by their own choice (24), totaling to 89 patients. Similarly, the number of patients who agreed to perform the OC (57) was added to the number of patients of the third group who underwent the OC procedure by their own choice (38), totaling to 95 patients.
In the analysis of rate of detection, the three studies were analyzed considering detection rate per participant. Table 3 presents the data extracted from each study to calculate detection rate per participant in each of the study groups.
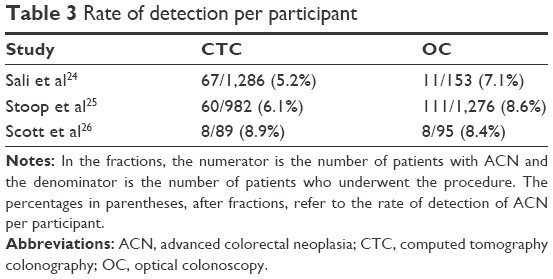 | Table 3 Rate of detection per participant |
A total of 2,357 patients underwent CTC, and 1,524 patients underwent OC. Of these, 135 patients who underwent CTC and 130 patients who underwent OC received ACN diagnosis. The absolute risk difference was −0.02 (with a 95% CI between −0.04 and −0.00) in favor of OC and with heterogeneity of 0%; the difference between the procedures was statistically significant (Figure 3).
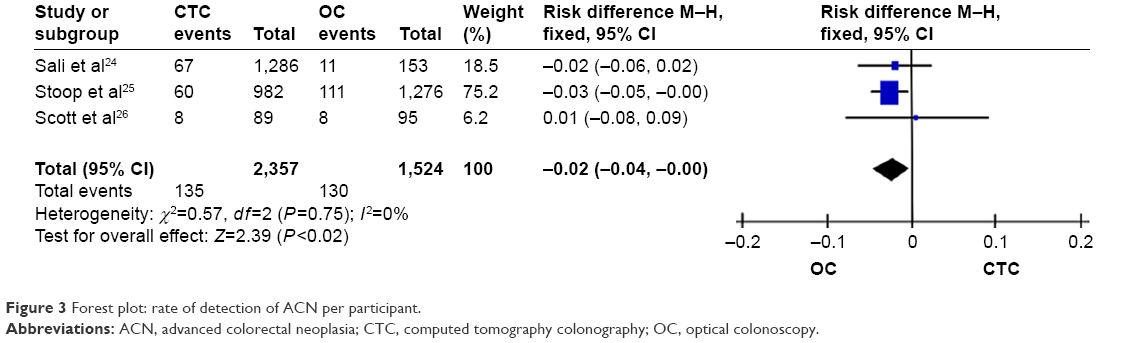 | Figure 3 Forest plot: rate of detection of ACN per participant. |
In the Scott’s study, regarding the analysis of detection rate per invitee, it is not possible to collect the data because it does not specify the detection rate between the group invited to CTC and the choice group. Therefore, in the meta-analysis of this outcome, only the first two studies were evaluated. A total of 7,745 patients were invited to CTC and 6,960 patients were invited to OC. Of these, 127 who were invited to CTC and 122 who were invited to OC received ACN diagnosis. The absolute risk difference was 0.00 (with a 95% CI between −0.00 and 0.01). So, there was no statistical significance between the two methods (Figure 4).
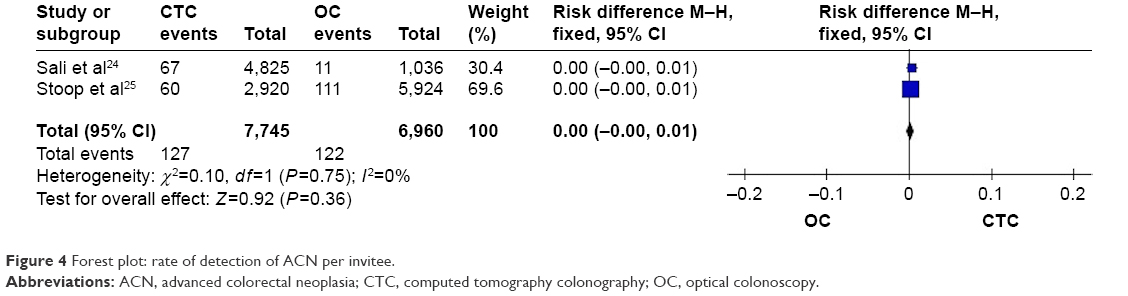 | Figure 4 Forest plot: rate of detection of ACN per invitee. |
PPV
The data for the calculation of PPV and the results are described in Table 4.
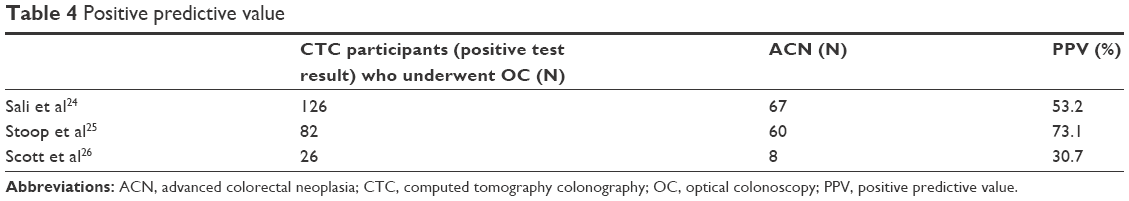 | Table 4 Positive predictive value |
Discussion
Summary of evidence
Given the high prevalence and mortality of CRC, it is extremely important that screening programs for this disease be continually improved in an effort to decrease its incidence. There is a consensus that any screening method for CRC is better than none at all. Many studies have attempted to establish which method is superior in terms of decreasing the morbidity and mortality associated with CRC, comparing the existing procedures. Recently, the joint recommendations of the American Cancer Society (ACS)–US Multi-Society Task Force (MSTF)–American College of Radiology (ACR) have supported more recent technologies (such as DNA testing of feces and CTC), and it has stated a preference for “structural exams”, including colonoscopies and CTCs, as a method of preventing CRC.3
Other systematic reviews have been published, comparing CTC to colonoscopy. In 2011, Pickhardt et al27 compared the sensitivity of CTC to that of OC for CRC detection; the sensitivities were 96.1% versus 94.7%, respectively, indicating that CTC is highly sensitive and suggesting that CTC is more appropriate for initial CRC screening; however, this study was not designed to evaluate the accuracy of the method as a screening test in asymptomatic patients. The latest study that compares the detection rate of CRC in asymptomatic patients was published in 2011 by Hann et al28 and involved five studies and included 4,086 patients. However, this review did not include Scott’s study, which was the only RCT up until that time. Stoop’s study25 was then published in 2012, and Sali’s study in 2015. In June 2016, the latest update to the recommendations from the US Preventive Services Task Force was published in JAMA.3 This review already includes Stoop’s study, but not Scott’s 2004 study or Sali’s 2015 study. This review considered only relevant clinical trials published between June 2008 and December 2014.
Therefore, this systematic review is the first to include Sali’s study and the first to assess only RCTs comparing the benefits of CTC relative to those of OC. It is very important that more studies like those included in this review be performed. Methodologies need to be well designed and comparable in order to produce better evidence for the implementation of this procedure as a screening option for CRC.
Limitations
Although the outcomes of these studies were all compared in this systematic review, and though a meta-analysis was applied to two of them, it is important to note that some differences in the methodologies of these studies prevent a perfect comparison between CTC and OC.
Because the criteria for a “positive test result” were much more sensitive in Scott’s study, their data included a much higher rate of positive results. A comparison between the groups should, ideally, include studies with the same criteria.
In the PPV analysis of CTC in detecting ACN, there was a substantial difference between the studies. This difference may also be justified by the differences in criteria between the studies in terms of the definition of a positive test result. Stoop’s study was less sensitive and recommended colonoscopies only for patients with one or more lesions ≥10 mm; therefore, there was a greater probability that this study would find a higher value of true positives, and the higher PPV found was therefore justified.
There were no differences between the studies in their definitions of ACN; the same concept was used in all the three studies. If criteria for the concept of a positive test result on CTC were established, many of the results of this review could be better analyzed.
Furthermore, not all patients in the three studies underwent both procedures. As per the follow-up criteria of the studies, only patients who had a positive index test (CTC) were referred to undergo the reference standard (OC). Therefore, only the true-positive test values and the false-positive test values were extracted. For this reason, only the PPV of CTC was calculated. For a complete assessment of CTC as a diagnostic method relative to the OC gold standard, studies in which patients undergo both procedures are necessary, regardless of the results of CTC. This would enable false-negative test values and true-negative test values to be extracted, and a review could include calculations of negative predictive value, sensitivity, and specificity, thus establishing the accuracy of the procedure.
Summary
This systematic review includes all available RCTs comparing the benefits of CTC and OC for CRC screening in asymptomatic patients in whom CRC screening is indicated.
Advances in knowledge
CTC is better accepted than colonoscopy by the population, and the option to perform this examination can increase the rate of participation in CRC screening programs.
Implications for patient care
CTC is a CRC screening option for patients who are unable or unwilling to undergo colonoscopy.
Conclusion
Because of the higher rate of participation, CTC is an option to perform CRC screening in asymptomatic patients, thus serving as another screening method. However, because CTC has been shown to be inferior in the detection of ACN, the method should not replace OC, which remains the gold standard.
We conclude that the patient should be informed about the superiority of the OC in the rate of detection of ACN. However, as the CTC is also validated for CRC screening, the decision regarding which method to use should be made jointly with the patient, considering their choice.
Acknowledgment
This study was performed with the resources of the Department of Gastrointestinal Endoscopy of the Clinical Hospital of the University of São Paulo School of Medicine (FM-USP), with which the researchers involved have a working relationship.
Disclosure
The researchers were responsible for the study design, data collection and analysis, writing of the paper, and the decision to submit the research for publication. The authors report no conflicts of interest in this work.
References
Stryker SJ, Wolff BG, Culp CE, Libbe SD, Ilstrup DM, MacCarty RL. Natural history of untreated colonic polyps. Gastroenterology. 1987;93(5):1009–1013. | ||
Otchy DP, Ransohoff DF, Wolff BG, et al. Metachronous colon cancer in persons who have had a large adenomatous polyp. Am J Gastroenterol. 1996;91(3):448–454. | ||
Lin JS, Piper MA, Perdue LA, et al. Screening for colorectal cancer: updated evidence report and systematic review for the US Preventive Services Task Force. JAMA. 2016;315(23):2576–2594. | ||
National Brazilian Cancer Institute (INCA). Cancer in Brazil: data from population-bases registries: volume IV. Rio de Janeiro; 2010. | ||
Whitlock EP, Lin JS, Liles E, et al. Screening for colorectal cancer: a targeted, updated systematic review for the U.S. Preventive Services Task Force. Ann Intern Med. 2008;149(9):638–658. | ||
Soetikno RM, Kaltenbach T, Rouse RV, et al. Prevalence of nonpolypoid (flat and depressed) colorectal neoplasms in asymptomatic and symptomatic adults. JAMA. 2008;299(9):1027–1035. | ||
Walsh JM, Terdiman JP. Colorectal cancer screening: scientific review. JAMA. 2003;289(10):1288–1296. | ||
Chen CD, Yen MF, Wang WM, et al. A case-cohort study for the disease natural history of adenoma-carcinoma and de novo carcinoma and surveillance of colon and rectum after polypectomy: implication for efficacy of colonoscopy. Br J Cancer. 2003;88(12):1866–1873. | ||
Centers for Disease Control and Prevention (CDC). Vital signs: colorectal cancer screening test use – United States, 2012. MMWR Morb Mortal Wkly Rep. 2013;62(44):881–888. | ||
Wijkerslooth TR, Haan MC, Stoop EM, et al. Reasons for participation and non-participation in colorectal cancer screening: a randomized trial of colonoscopy and CT colonography. Am J Gastroenterol. 2012;107(12):1777–1783. | ||
Hassan C, Pickhardt PJ, Kim DH. Systematic review: distribution of advanced neoplasia according to polyp size at screening colonoscopy. Aliment Pharmacol Ther. 2010;31(2):210–217. | ||
Atkin W, Dadswell E, Wooldrage K, et al. Computed tomographic colonography versus colonoscopy for investigation of patients with symptoms suggestive of colorectal cancer (SIGGAR): a multicentre randomised trial. Lancet. 2013;381(9873):1194–1202. | ||
Neri E, Halligan S, Hellström M, et al; ESGAR CT Colonography Working Group. The second ESGAR consensus statement on CT colonography. Eur Radiol. 2013;23(3):720–729. | ||
McNamara D. FDA Panel: most favour CTC colorectal cancer screen. Medscape; 2013. Available from: http://www.medscape.com/viewarticle/810740. Accessed December 18, 2014. | ||
Whiting PF, Rutjes AW, Westwood ME, et al; QUADAS-2 Group. QUADAS-2: a revised tool for the quality assessment of diagnostic accuracy studies. Ann Intern Med. 2011;155(8):529–536. | ||
Higgins JPT, Thompson SG, Deeks JJ, Altman DG. Measuring inconsistency in meta-analyses. BMJ. 2003;327(7414):557–560. | ||
Forbes GM, Edwards JT, Foster NM, Wood CJ, Mendelson RM. Randomized single blind trial of two low-volume bowel preparations for screening computed tomographic colonography. Abdom Imaging. 2005;30(1):48–52. | ||
Ghanouni A, Halligan S, Plumb A, Boone D, Wardle J, von Wagner C. Non- or full-laxative CT colonography vs. endoscopic tests for colorectal cancer screening: a randomised survey comparing public perceptions and intentions to undergo testing. Eur Radiol. 2014;24(7):1477–1486. | ||
van Dam L, de Wijkerslooth TR, de Haan MC, et al. Time requirements and health effects of participation in colorectal cancer screening with colonoscopy or computed tomography colonography in a randomized controlled trial. Endoscopy. 2013;45(3):182–188. | ||
Wijkerslooth TR, Haan MC, Stoop EM, et al. Reasons for participation and non-participation in colorectal cancer screening: a randomized trial of colonoscopy and CT colonography. Am J Gastroenterol. 2012;107(12):1777–1783. | ||
Wijkerslooth TR, Haan MC, Stoop EM, et al. Burden of colonoscopy compared to non-cathartic CT-colonography in a colorectal câncer screening programme: randomized controlled trial. Gut. 2012;61(11):1552–1559. | ||
von Wagner C, Ghanouni A, Halligan S, et al; SIGGAR Investigators. Patient acceptability and psychologic consequences of CT colonography compared with those of colonoscopy: results from a multicenter randomized controlled trial of symptomatic patients. Radiology. 2012;263(3):723–731. | ||
Halligan S, Dadswell E, Wooldrage K, et al. Computed tomographic colonography compared with colonoscopy or barium enema for diagnosis of colorectal cancer in older symptomatic patients: two multicentre randomised trials with economic evaluation (the SIGGAR trials). Health Technol Assess. 2015;19(54):1–134. | ||
Sali L, Mascalchi M, Falchini M, et al. SAVE study investigators. Reduced and full-preparation CT colonography, faecal immunochemical test, and colonoscopy for population screening of colorectal cancer: a randomized trial. J Natl Cancer Inst. 2015;108(2):pii:djv319. | ||
Stoop EM, de Haan MC, de Wijkerslooth TR, et al. Participation and yield of colonoscopy versus non-cathartic CT colonography in population-based screening for colorectal cancer: a randomised controlled trial. Lancet Oncol. 2012;13(1):55–64. | ||
Scott RG, Edwards JT, Fritschi L, Foster NM, Mendelson RM, Forbes GM. Community-based screening by colonoscopy or computed tomographic colonography in asymptomatic average-risk subjects. Am J Gastroenterol. 2004;99(6):1145–1151. | ||
Pickhardt PJ, Hassan C, Halligan S, Marmo R. Colorectal cancer: CT colonography and colonoscopy for detection-systematic review and meta-analysis. Radiol. 2011;259(2):393–405. | ||
Haan MC, van Gelder RE, Graser A, Bipat S, Stoker J. Diagnostic value of CT-colonography as compared to colonoscopy in an asymptomatic screening population: a meta-analysis. Eur Radiol. 2011;21(8):1747–1763. |
Supplementary materials
Characteristics of the studies as per the patient, intervention, comparison intervention, outcome, study design (PICOS) strategy
Participants
Inclusion criteria
All the three studies involved groups of similar patients, that is, asymptomatic patients for whom colorectal cancer (CRC) screening was indicated because of their age groups (Table S1). The study by Sali1 included patients aged 54–65 years who were likely to be invited for regional screening with fecal immunohistochemical test (FIT) as part of the local screening program in Florence, Italy. The study by Stoop2 included patients aged 50–75 years who had been identified through electronic data from Amsterdam and Rotterdam in the Netherlands. The study by Scott3 included patients aged 50–55 years and 65–70 years who had been identified on the basis of the electoral register in Perth, Australia.
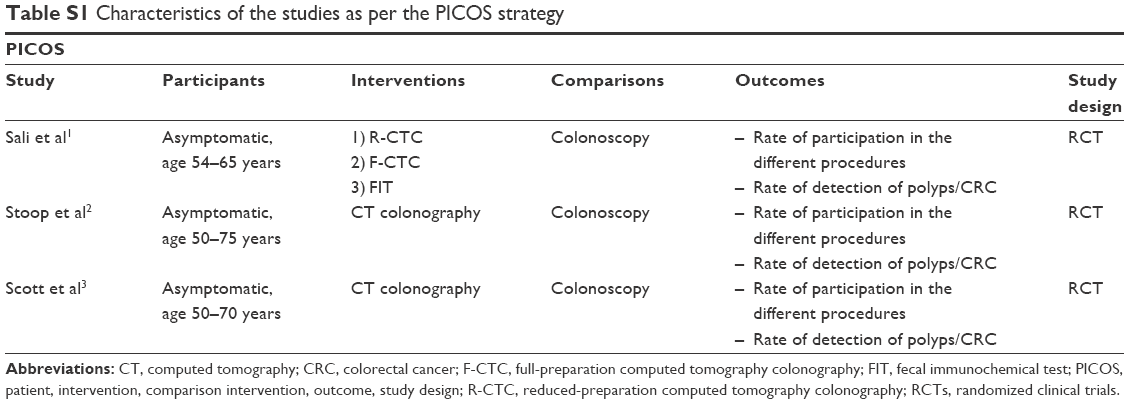 | Table S1 Characteristics of the studies as per the PICOS strategy |
Exclusion criteria
The rationale for the definition of the exclusion criteria for each study was the same as the goal was to exclude any patient who had symptoms of CRC or other clinical factors that could increase the CRC risk, such as a previous history or family history of CRC, as CRC screening should be individualized in these patients. Patients who had already undergone some type of recent screening or who had any contraindication for either of the interventions being tested were also excluded.
Interventions
In the study by Sali,1 the patients who met the inclusion criteria were randomized to one of the following four CRC screening methods: 1) reduced-preparation CTC (R-CTC); 2) full-preparation CTC, with preparation equal to that in colonoscopy (F-CTC); 3) three rounds of biannual FIT; and 4) optical colonoscopy (OC). These patients were invited to participate in the group into which they had been randomized.
In Stoop’s study,2 the patients were randomized and invited to participate in one of two groups (CTC or OC).
In Scott’s study,3 the patients were randomized to one of three groups: 1) the group in which the patients were invited to participate in the study on CTC, 2) the group in which the patients were invited to participate in the study on OC, and 3) the group in which the patients were invited to participate in the study and could choose which of the two procedures they would undergo.
The randomized data of the arms of interest in each study (CTC and OC) were used in the analysis of the results to meet the objectives of this review.
Comparisons
In all the studies, the standard method was OC.
Outcomes
The objectives of Sali’s study1 were 1) to compare the participation rate in the index test groups to that in the standard test group (definition: the number of those who completed the test among those who were invited, excluding those who did not respond to the invitation and who were excluded) and 2) to compare the ACN detection rate between the procedures (divided by invited patients and participating patients).
The objectives of Stoop’s study2 were 1) to compare the participation rate in the two groups and 2) to compare the ACN detection rate between the procedures (divided by invited patients and participating patients).
The objectives of Scott’s study3 were 1) to compare the participation rate in both groups (CTC and OC), 2) to compare the ACN detection rate between the procedures (only in participating patients), 3) to compare the acceptability of the two procedures using a specific questionnaire, and 4) to assess whether the choice between the two procedures increased participation rate in screening in Group 3.
Study design
All included studies were randomized clinical trials (RCTs), and this randomization was similar in all the three studies: groups of patients in each screening were similar in terms of age, gender, and socioeconomic factors. As mentioned in the “Participants” section, the studies by Sali1 and Scott3 were performed at a single site, whereas the study by Stoop2 was conducted at two sites.
Performing the index test (CTC) and follow-up
The methodology used in CTC was analyzed in terms of bowel preparation for the examination, the investigation itself, and the evaluation of the results. In Sali’s study,1 there were two CTC groups, one that used R-CTC, based on macrogol, and one that used conventional F-CTC, based on polyethylene glycol, as in the other studies that were meta-analyzed. The procedures were performed in a similar manner in all the three studies. Regarding the assessment of the results, there were differences in the definition of a “positive test result” in each of the studies and also in the monitoring of patients according to the results of their examinations (follow-up).
In Sali’s study,1 patients were considered to have tested positive in CTC when colonic masses or one or more polyps >6 mm were identified. All patients were instructed to undergo OC within 1 month. In this study, the patients were informed of only relevant extracolonic findings, and the follow-up data of these extracolonic findings were not included.
In Stoop’s study,2 the definition of a positive test result was a finding of one or more lesions ≥10 mm, and all patients with a positive test result were instructed to undergo colonoscopy within 3 weeks. For patients with less than three lesions between 6 and 9 mm, new CTC within 3 years was recommended. For patients with three or more lesions between 6 and 9 mm, CTCs after 1 and 5 years were recommended. Polyps of <6 mm were ignored because of their low malignancy risk. Patients with extracolonic findings were referred for specific follow-up care, and these data were not included.
Meanwhile, in Scott’s study,3 the definition of a positive test result was one or more polyps ≥6 mm or two or more polyps of any size. Patients with these findings were referred to undergo OC, which was performed on the same day. Patients with a single polyp ≤5 mm were informed of the result of the investigation and were told that this finding was considered “undetermined”. They were informed of the possibility of a false-positive result and that colonoscopy was not necessary; however, the option to undergo colonoscopy on the same day was offered for those who wished.
Performing the reference standard test (OC)
In the three studies, the reference standard test (OC) was performed in a similar manner by experienced colonoscopists with colon preparations based on polyethylene glycol under sedation. Any lesions found were removed (when endoscopic removal was not possible, biopsies were performed), and the samples were histopathologically analyzed. In Stoop’s2 study, all lesions were classified in terms of their morphology, location, and macroscopic aspects, and these characteristics were used in the group-specific data analyses. In the study by Sali,1 the data were analyzed only in terms of the locations of the lesions. In the study by Scott,3 there were no group-specific analyses of the endoscopic findings.
Histopathological analysis
In the three studies, all lesions were evaluated by experienced pathologists and classified according to the Vienna classification: 1) hyperplastic polyp, 2) serrated polyp, 3) tubular adenoma, 4) tubulovillous adenoma, 5) villous adenoma, or 6) adenocarcinoma.
In Sali’s study,1 “advanced adenoma” was defined as >9 mm and/or a villous component of >20% and/or a high degree of dysplasia. Meanwhile, “ACN” was defined as cancer or advanced adenoma.
In Stoop’s study,2 dysplasia was classified as low or high, and “advanced adenoma” was defined as ≥10 mm and/or a villous component of >25% and/or a high degree of dysplasia. “ACN” was defined as cancer or “advanced adenoma.”
In Scott’s study,3 ACN was defined as an adenoma of ≥10 mm, villous adenoma, a high degree of dysplasia, or carcinoma.
Quality assessment of all included studies using QUADAS-2
In the “Judgments on Bias and Applicability” phase of QUADAS-2 (Table S2), the three studies were evaluated for the “selection of patients”, “index test”, “reference standard”, and “flow and time”, and the risk of bias was rated as low or high for each domain of each article. Subsequently, in this phase that defined the trial on the risk of bias in the studies, the “tabular application of results of QUADAS-2 for the included studies” was generated. Table S3 uses cores and designs to show the risk of bias and concern about applicability in each domain assessed in the studies. The red cells correspond to a high risk of bias and low applicability, whereas the green cells correspond to a low risk of bias and high applicability.
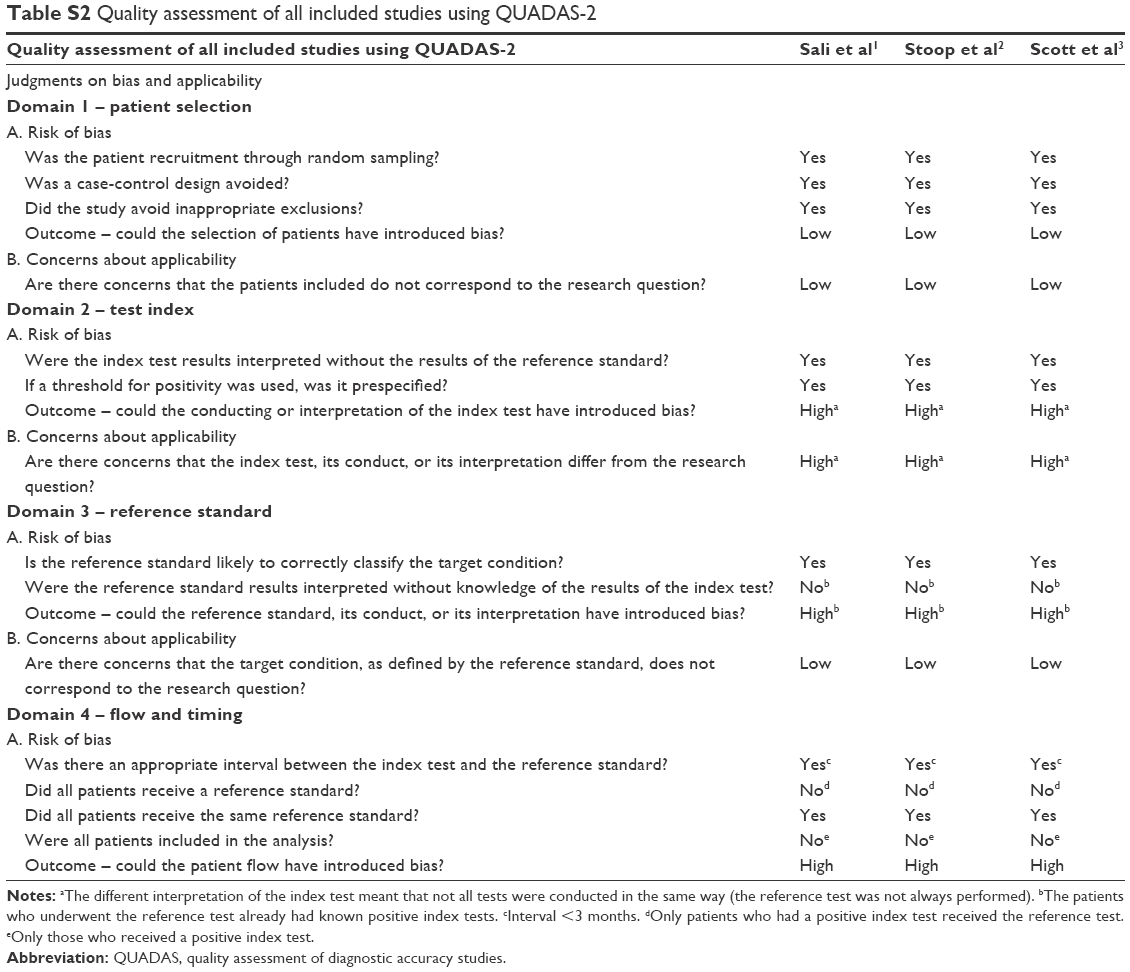 | Table S2 Quality assessment of all included studies using QUADAS-2 |
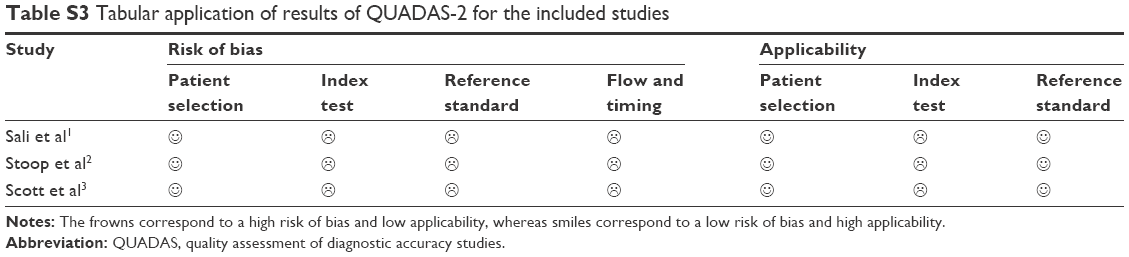 | Table S3 Tabular application of results of QUADAS-2 for the included studies |
Patients
Total number of included patients
The study by Sali1 invited 6,348 patients, the study by Stoop2 invited 8,844 patients, and the study by Scott3 invited 1,400 patients, resulting in a total of 16,592 patients.
Eligible patients
The number of eligible patients in the study by Sali1 was 4,825 in the CTC group (2,395 in the R-CTC group and 2,430 in the F-CTC group) and 1,036 in the OC group, resulting in a total of 5,861 patients.
In the study by Stoop,2 all patients invited were eligible. In the e-mail sent to the patients, they were asked to refuse to participate if they did not meet the inclusion criteria or if any of the exclusion criteria applied to them, and they were instructed to seek medical advice for specific follow-up. Therefore, Table S4 shows that the number of patients eligible for this study is the same as the number reported in the column showing the number of invited patients, that is, 2,920 patients in the CTC group and 5,924 in the OC group, resulting in a total of 8,444 patients.
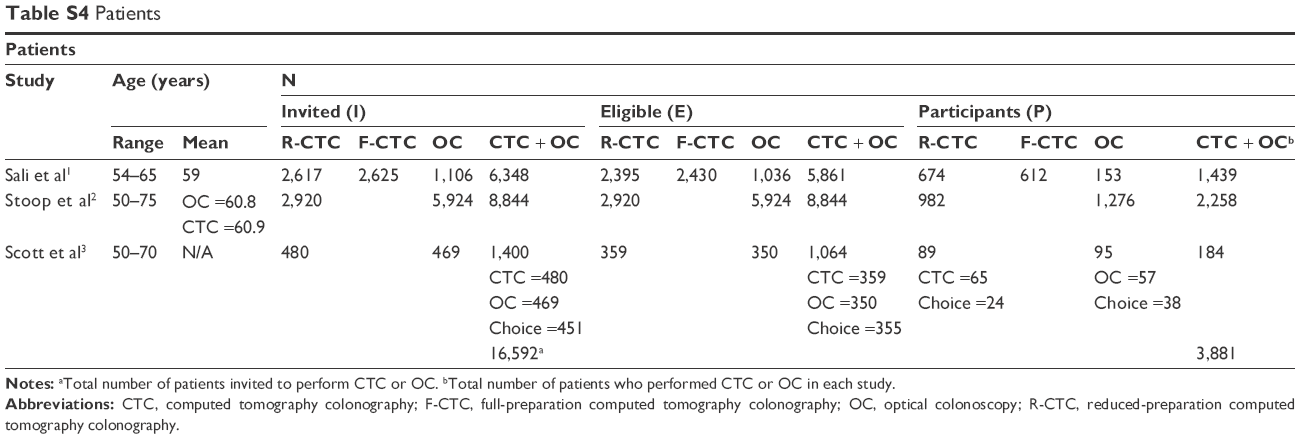 | Table S4 Patients |
Meanwhile, in the study by Scott,3 the total number of eligible patients was 1,064, with 359 in the CTC group, 350 in the OC group, and 355 in the group of patients who could choose which of the procedures they would undergo (the “choice” group).
Participating patients
In Sali’s study,1 the number of participants in the CTC group was 1,286 (674 in the R-CTC group and 612 in the F-CTC group). The number of participants in the OC group was 153; therefore, the total number of participants who underwent the procedures was 1,439.
In Stoop’s study,2 there were 2,258 patients in total (982 in the CTC group and 1,276 in the OC group).
In Scott’s study,3 the total number of participants was 184: 89 patients underwent CTC, 65 of whom were in the CTC group and 24 of whom were in the “choice” group. Of the 95 patients who underwent OC, 57 were in the OC group and 38 were in the choice group and preferred this method.
Thus, the total number of included patients was 3,881.
References
Sali L, Mascalchi M, Falchini M, et al. SAVE study investigators. Reduced and full-preparation CT colonography, faecal immunochemical test, and colonoscopy for population screening of colorectal cancer: a randomized trial. J Natl Cancer Inst. 2015;108(2):pii:djv319. | ||
Stoop EM, de Haan MC, de Wijkerslooth TR, et al. Participation and yield of colonoscopy versus non-cathartic CT colonography in population-based screening for colorectal cancer: a randomised controlled trial. Lancet Oncol. 2012;13(1):55–64. | ||
Scott RG, Edwards JT, Fritschi L, Foster NM, Mendelson RM, Forbes GM. Community-based screening by colonoscopy or computed tomographic colonography in asymptomatic average-risk subjects. Am J Gastroenterol. 2004;99(6):1145–1151. |
 © 2018 The Author(s). This work is published and licensed by Dove Medical Press Limited. The
full terms of this license are available at https://www.dovepress.com/terms
and incorporate the Creative Commons Attribution
- Non Commercial (unported, 3.0) License.
By accessing the work you hereby accept the Terms. Non-commercial uses of the work are permitted
without any further permission from Dove Medical Press Limited, provided the work is properly
attributed. For permission for commercial use of this work, please see paragraphs 4.2 and 5 of our Terms.
© 2018 The Author(s). This work is published and licensed by Dove Medical Press Limited. The
full terms of this license are available at https://www.dovepress.com/terms
and incorporate the Creative Commons Attribution
- Non Commercial (unported, 3.0) License.
By accessing the work you hereby accept the Terms. Non-commercial uses of the work are permitted
without any further permission from Dove Medical Press Limited, provided the work is properly
attributed. For permission for commercial use of this work, please see paragraphs 4.2 and 5 of our Terms.