Back to Journals » Clinical Ophthalmology » Volume 14
Comparison of Visual Performance and Patient Satisfaction Outcomes with Two Trifocal IOLs with Similar Optical Design but Different Materials
Authors Poyales F, Pérez R, López-Brea I ![]() , Zhou Y, Rico L, Garzón N
, Zhou Y, Rico L, Garzón N ![]()
Received 23 July 2020
Accepted for publication 25 September 2020
Published 13 October 2020 Volume 2020:14 Pages 3237—3247
DOI https://doi.org/10.2147/OPTH.S273641
Checked for plagiarism Yes
Review by Single anonymous peer review
Peer reviewer comments 3
Editor who approved publication: Dr Scott Fraser
Francisco Poyales,1 Ricardo Pérez,1 Israel López-Brea,1 Ying Zhou,1 Laura Rico,1 Nuria Garzón1,2
1Miranza IOA, Madrid, Spain; 2Optometry and Vision Department, Universidad Complutense, Madrid, Spain
Correspondence: Nuria Garzón
Miranza IOA, C/Galileo 104, Madrid 28003, Spain
Tel +34 915353570
Email [email protected]
Purpose: To compare clinical outcomes in a prospective trial of cataract surgery patients bilaterally implanted with two different trifocal intraocular lenses (IOLs) with very similar optical designs but consisting of different IOL materials (hydrophobic and hydrophilic).
Patients and Methods: Fifty-one patients (102 eyes) were randomized to receive trifocal IOLs bilaterally – FineVision POD F (hydrophilic) or FineVision POD F GF (hydrophobic) (both PhysIOL, Liége, Belgium). The follow-up period was 3 months. Outcome measurements included uncorrected distance (UDVA), corrected distance (CDVA), distance-corrected intermediate (DCIVA), and distance-corrected near visual acuity (DCNVA), refraction, negative dysphotopsia, optical quality of vision, contrast sensitivity under photopic and mesopic conditions, halometry (discrimination index), and patient-reported outcomes.
Results: At the final study visit, mean (SD) values for binocular UDVA, CDVA, DCIVA (80 cm), and DCNVA (40 cm) were − 0.01 (0.06), − 0.04 (0.04), 0.09 (0.10), and 0.10 (0.09) logMAR, respectively, for POD F, and 0.01 (0.08), − 0.03 (0.03), 0.08 (0.1), and 0.13 (0.11) respectively, for POD F GF. Defocus assessments showed a continuous curve with a functional range of visual acuity (≤ 0.15 logMAR) from ∼ 30 cm to infinity in both groups. The discrimination index was > 0.85 for all patients, and both groups showed similar contrast sensitivity under photopic and mesopic conditions. At 3 months, no patient reported negative dysphotopsia, and high satisfaction rates were observed.
Conclusion: Clinical outcomes showed no significant difference between each lens when measured at 1 month and 3 months after implantation. This equally good clinical performance of hydrophilic and hydrophobic trifocal lenses allows the surgeon to choose the IOL material based on personal preferences or patients’ needs.
Keywords: trifocal FineVision, intraocular lens, biomaterial, hydrophobic, hydrophilic, glistening-free
Introduction
It is often said that “cataract surgery is refractive surgery”. The advances in intraocular lens (IOL) design over the previous two decades have resulted in many patients choosing multifocal rather than monofocal lens implants to enable good vision not only at far but also at intermediate and near distances, so they have reduced or no spectacle dependence after surgery. However, with multifocal diffractive lens designs, multiple images are displayed on the retina and neuroadaptation is required for the patient to “focus”. There are various optical compromises that are made with multifocal IOLs when compared to monofocal lenses; for example, reduced contrast sensitivity and photic phenomena.1,2 Careful patient and lens selection, meticulous ocular biometry measurements and surgical precision are all pivotal in providing patients with the best possible visual outcome and greater spectacle independence.
Several factors after surgery can change patients’ visual outcomes and satisfaction, like lens tilt, rotation (in terms of toric IOLs), decentration, posterior capsular opacification (PCO) and glistenings. Many of the former phenomena can be mitigated through thoughtful lens and haptic design, but glistenings – fluid-filled microvacuoles that form within certain IOLs after implantation, and can develop in various shapes, sizes, and density – are a function of the material used. PCO is partly a function of IOL design (square optic edges that fit flush with the capsular bag reduces the rate of PCO) but also of IOL material.3,4 IOLs made from hydrophobic acrylic are associated with an enhanced risk of glistening formation, but usually provoke low or no PCO,5 whereas hydrophilic IOLs resist glistening formation, but are more likely to develop PCO.6,7
In recent years, glistening-free (GF) hydrophobic IOL materials have been developed, and several IOLs made from GF materials have made it to the market. One IOL that has been marketed in Europe since 2010, the FineVision lens (POD F; PhysIOL, Liège, Belgium) is made from a 26% hydrophilic acrylic material with a trifocal optical design that combines two diffractive patterns; a +3.50 diopter (D) addition for near and a +1.75 D addition for intermediate vision, with the diffractive steps being alternated over the optical zone. Several studies have shown that the POD F IOL offers a significant improvement in uncorrected visual acuity across all distances and high patient satisfaction.8–14
PhysIOL subsequently developed the POD F GF IOL, which retains the FineVision optic and the POD haptic design but differs in terms of the material as it is made from a hydrophobic acrylic glistening-free material called GFree.15
Given the two materials differ in refractive properties, the Abbe number (POD F GF: 42; POD F: 58) and the refractive index (POD F GF: 1.52; POD F: 1.46), the thickness of the optics of the POD F and POD F GF IOL are very different. However, the diffractive pattern of both lenses has been designed so that the measurable properties, such as near addition powers, are almost identical on the optical bench.
The goal of this current study was to compare visual and refractive outcomes between the hydrophobic trifocal POD F GF and the hydrophilic trifocal POD F IOL, and to investigate whether the newer POD F GF can achieve clinical outcomes comparable to its hydrophilic counterpart.8–14 Although monocular clinical results have been previously reported,9 to our knowledge, this is the first study reporting binocular clinical outcomes and patient satisfaction after POD F GF IOL implantation.
Patients and Methods
This was a prospective, randomized, controlled, single-surgeon (FP), single-center post-market clinical follow-up study (NCT03347981), performed at our eye clinic (Miranza, IOA Madrid, Spain). Informed consent and permission to use their data for analysis and publication were obtained from each patient prior to surgery as part of our routine preoperative protocol. The study was conducted in accordance with the tenets of the Declaration of Helsinki and was approved by the ethics committee of the Hospital Clínico San Carlos (Madrid, Spain), Comité Ético de Investigación Clínica GAE HCSC Area 7 (C.I. 17/165-R_P).
The study population comprised patients with cataracts and no other ocular comorbidities who spontaneously reported a desire for reduced spectacle dependence after surgery, and who were available, capable, and willing to comply with the study examination procedures. Patients were excluded if they were aged <45 years, had irregular astigmatism, regular corneal astigmatism >1.00 D or >1.50 D if the steep cylinder axis was between 90 and 120 degrees in one or both eyes. A history of ocular trauma or prior ocular surgery, and any ocular comorbidities, including capsule, zonule, pupil, and retina abnormalities or the expectation of complicated surgery served as exclusion criteria.
All patients underwent a comprehensive preoperative ophthalmic examination, which included keratometry and biometry using the IOLMaster 700 (Carl Zeiss Meditec AG, Jena, Germany), intraocular pressure (IOP) using Goldmann applanation tonometry, fundus optical coherence tomography (OCT) imaging (Cirrus; Carl Zeiss Meditec AG, Jena, Germany), manifest refraction, and pupil diameter measurements under photopic and mesopic conditions using the OPD Scan III (Nidek, Japan). The OPD Scan III was also used to perform aberrometry measurements of spherical aberrations (SA), higher-order aberrations (HOA) and IOL tilt.
Patients were scheduled to undergo routine femtosecond laser-assisted cataract surgery. The capsulotomy and the lens fragmentation were performed with the Catalys Precision system (Johnson & Johnson Vision, Santa Ana, California, USA). Then, a 2.2 mm 45-degree angled, bevel-up surgical knife (Xstar Safety Slit Knife, Beaver-Visitec International) was used to create a self-sealing clear corneal incision on the steep meridian. All the IOLs were implanted with one injector (Accujet 2.1, Medicel, Switzerland) to standardize the surgically induced astigmatism, and capsular tension rings were used in most cases to increase the stability of the IOL. The optic-haptic junctions of the IOLs were placed inferotemporally in order to reduce negative dysphotopsias.16 IOL power calculation was performed using the Barrett formula and the following lens factors: 1.89 for POD F (already optimized), and 2.09 for POD F GF. During the course of the study, we individualized the POD F GF lens factor resulting in a final value of 2.15.
Patients were assigned to one of two groups according to a randomization table: the study group (patients received the trifocal hydrophobic FineVision POD F GF IOL) and the control group (patients received the trifocal hydrophilic FineVision POD F IOL).
At the 3-month follow-up, UDVA, and CDVA at 4 m (ETDRS [Early Treatment Diabetic Retinopathy Study] charts), DCIVA at 80 cm (Radner reading charts), and DCNVA at 40 cm (Radner reading charts) were binocularly assessed, as were DCIVA at 70 cm and 35 cm (both ETDRS) at the 1-month follow-up.
Distance corrected visual acuities (CDVA, DCIVA, DCNVA) were measured using the subjective refraction for far distance. The Optical Quality Analysis System (OQAS) (Visiometrics S.L., Spain) was used to measure the Objective Scatter Index (OSI score), the Modulation transfer function (MTF) and the Strehl Ratio. Halometry was assessed using a bright light to dazzle a screen and the number of halos was determined by the number of correctly read characters, with the results expressed by the software package Halo v1.0 (University of Granada, Granada, Spain) as a “discrimination index.”
Defocus curves were generated by adding a defocus lens to the best-corrected refraction (at 4 m) from +2.0 D to −4.0 D in steps of 0.5 D.
Contrast sensitivity was assessed under photopic (85 cd/m2) and mesopic (3.5 cd/m2) light conditions using the Vector Vision CSV-1000 (VectorVision, Greenville, Ohio) system; mesopic contrast sensitivity was assessed by placing mesopic filters in the trial frame.
To assess subjective patient satisfaction, a questionnaire was handed out to the patients at the final examination visit. The questionnaire used was the validated National Eye Institute Visual Function Questionnaire-25 (NEI VFQ-25 questionnaire).17 In addition, to evaluate the rate of negative dysphotopsia, the patients were asked directly whether they perceive a dark shadow in the peripheral visual field. The possible responses were “yes” or “no”.
Statistical Analysis
The primary study endpoint was to show statistically equal visual acuity outcomes between both study groups measuring UDVA in photopic light conditions. For sample size calculation we used the Sealed Envelope Power Calculator18 and the following parameters: alpha = 0.05, power = 0.90, two-sided test, expected SD of outcome = 0.08 logMAR (based on our experience from former POD F studies), equivalence limit = four optotypes of a Snellen line (=0.08 logMAR). In order to show no difference between the two study cohorts, 22 patients per group were needed.
To assess whether the results of the NEI VFQ-25 questionnaire correlated with visual acuity, contrast sensitivity and halometry discrimination index, a Spearman correlation analysis was performed, based on the overall composite score obtained from the VFQ-25.
Statistical data analysis was performed using Microsoft Excel (version 16.0) including the add-in statistics software WinSTAT (version 2012.1.0.96). Results of descriptive statistics are expressed as mean (± standard deviation) and median (range). The Mann–Whitney U-test was used to assess the significance of differences between groups. The Wilcoxon rank-sum test for paired data was performed to assess the significance of differences between examinations. A p-value of less than 0.05 was considered statistically significant. The refractive prediction error was calculated by subtracting the postoperative manifest spherical equivalent (SE) from the preoperative targeted SE given by the IOLMaster.
Results
A total of 51 patients (POD F GF group: 26; POD F group: 25) were recruited for this study. All patients were available for follow-up at 1 month, and 49 patients (POD F GF group: 25; POD F group: 24) completed the 3-month follow-up examination. The patients’ mean age (SD, range) on the day of surgery was 65.0 (6.3, 47.1–75.2) years and 66.0 (6.9, 52.7–83.7) years in the POD F and POD F GF groups, respectively. The majority of patients in both treatment groups were female: 21/25 (84.0%) and 23/26 (88.5%) in the POD F and POD F GF groups, respectively (Table 1). There was no statistically significant difference in patient age (p=0.553) and preoperative biometry and keratometry values between the two treatment groups (p>0.05) (Table 2).
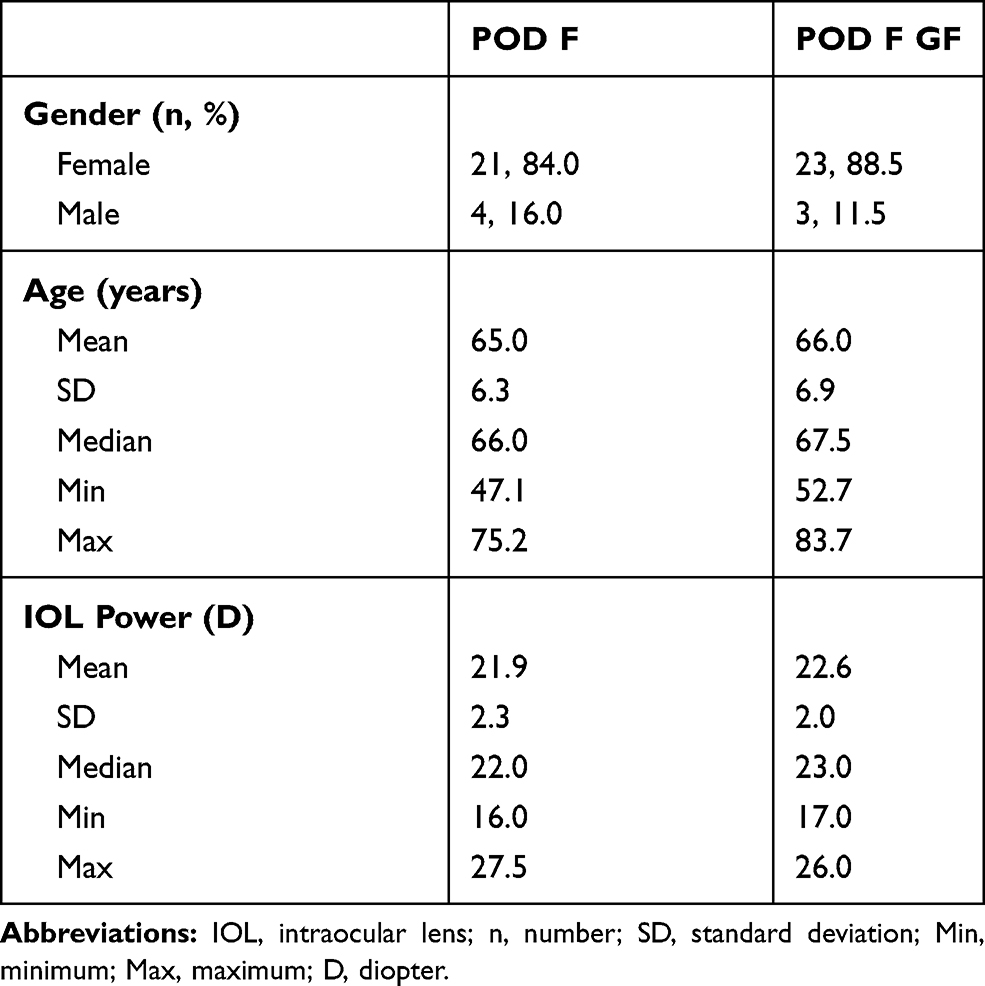 |
Table 1 Patient Demographics and IOL Power per Group |
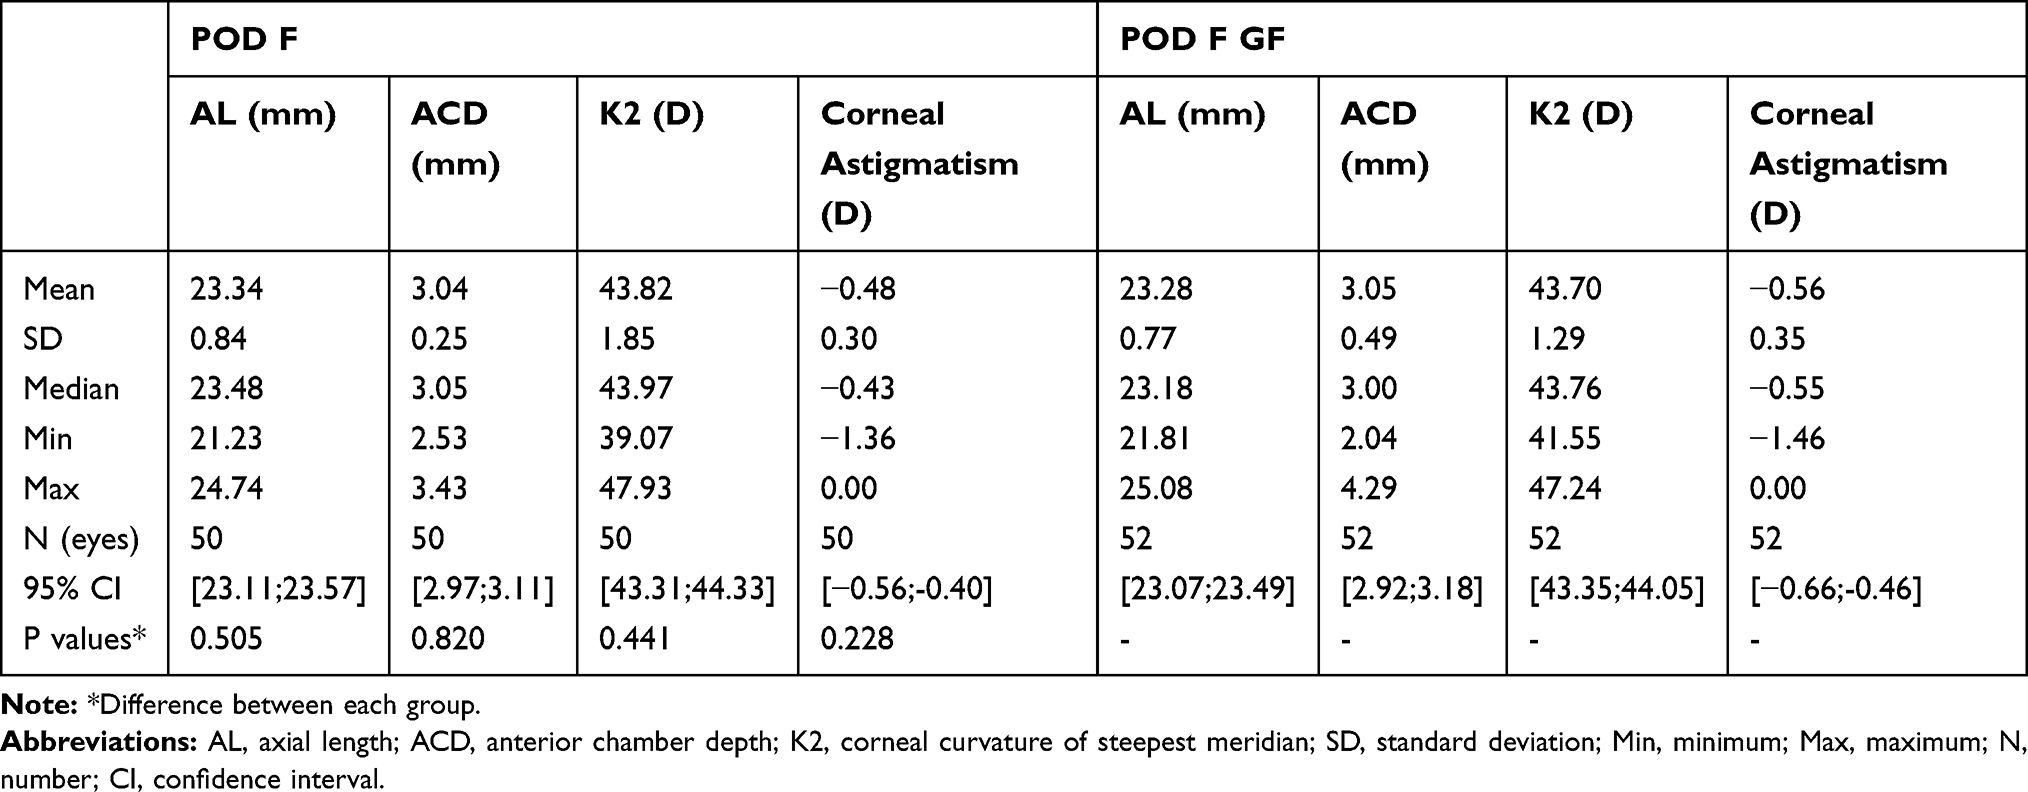 |
Table 2 Preoperative Biometry and Keratometry Values |
Patients bilaterally implanted with either lens showed postoperative visual outcomes as follows. At the 3-month follow-up, mean (SD) values for binocular UDVA, CDVA, DCIVA (80 cm), and DCNVA (40 cm) were −0.01 (0.06), −0.04 (0.04), 0.09 (0.10) and 0.10 (0.09) logMAR, respectively, for POD F, and 0.01 (0.08), −0.03 (0.03), 0.08 (0.1) and 0.13 (0.11) respectively, for POD F GF. Additionally, at 3 months, 95.8% (POD F, n=23) and 100% (POD F GF, n=24) of each treatment group experienced vision of 0.1 logMAR (20/25) or better for binocular UDVA and CDVA (Figure 1A and B). Good binocular DCIVA (≤0.1 logMAR) at 3 months was also obtained; 75.0% (POD F, n=18) and 79.2% (POD F GF, n=19), and 92.0% (POD F, n=23) and 88.0% (POD F GF, n=22) for DCIVA at 80 cm (3 months) and 70 cm (1 month) respectively (Figure 1C and D); at near, these values were 83.3% (POD F, n=20) and 70.8% (POD F GF, n=17), and 88.0% (n=22) for both POD F and POD F GF, for DCNVA at 40 cm (Radner, 3 months) and at 35 cm (ETDRS, 1 month) respectively (Figure 1E and F). Overall, mean visual acuity (VA) outcomes were very good for all distances down to 35 cm in both study groups (Figure 1G). There was no statistically significant difference in VA between the two treatment groups at any of these distances (p>0.05).
 |
Figure 1 Visual acuity results at 3 months. Cumulative binocular UDVA (A), CDVA (B), DCIVA at 80 cm (C) and 70 cm (D), DCNVA at 40 cm (E) and 35 cm (F), and (G) mean binocular values for all outcomes presented in (A–F). |
The binocular defocus curve analysis (Figure 2) showed an extended range of clear vision rather than distinct peaks corresponding to the +1.75 D and +3.50 D adds for each IOL design. Between the foci for distance and near vision (for defocus levels between 0.0 and −3.0 D), a functional range of visual acuity was maintained, with mean values of 0.09 logMAR (20/25) or better in the POD F group and 0.15 logMAR (20/28) or better in the POD F GF group. In effect the defocus curves were not significantly different, except for at one defocus value of −3 D where the POD F lens showed significantly higher VA than the POD F GF lens (p=0.017).
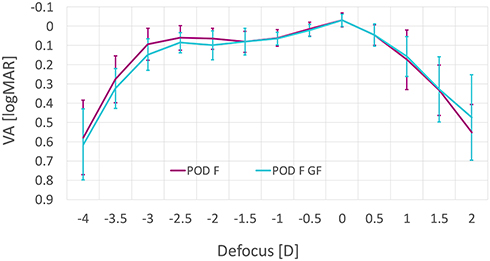 |
Figure 2 Binocular defocus curve measured at 3 months postoperatively in the POD F and POD F GF group. |
The refractive outcomes of the patients involved in the trial are displayed in Figure 3. In terms of sphere, the refractive outcomes were similar in both groups (Figure 3A), although the mean postoperative sphere was closer to zero in the POD F group. There was a statistically significant reduction of refractive cylinder with POD F between 1 week and 1 month (Figure 3B, p=0.032). The only significant difference between the groups’ cylinder was measured at 1 month (p=0.020). Postoperative mean manifest refraction spherical equivalent (MRSE) (Figure 3C) was on target with POD F (0.00 ± 0.29D) and there were slightly hyperopic outcomes with POD F GF (mean MRSE = 0.23 D at 3 months). Again, the only statistically significant difference between the groups was at 1 month (p=0.037). A slight but statistically non-significant (p>0.05) hyperopization was seen with POD F GF between 1 week and 3 months. At 3 months, 83% (POD F, n=40) and 90% (POD F GF, n=45) of the eyes were within ±0.5D, and 100% (POD F, n=48) and 92% (POD F GF, n=46) were within ±1.0D of targeted refractive SE.
 |
Figure 3 Pre- and postoperative refractive outcomes of sphere (A), cylinder (B) and MRSE (C) (% of eyes). |
The results presented in Figure 4A–F reveal that there was no significant difference in halometry, modulation transfer function, Strehl ratio, tilt, root-mean-square (RMS) HOAs (total, corneal or internal), spherical aberrations or photopic contrast sensitivity between the POF F and POF GF groups. Both lens groups exhibited low OSI scores. The photopic results were slightly better than the mesopic data at high and low spatial frequencies (Figure 4G and H). The mesopic curve of the POD F group at 3 and 6 cpd was slightly above the curve of the POD F GF group; however, the differences were not statistically significant (p>0.05). In terms of negative dysphotopsias (Figure 5), about one in three patients in both treatment groups reported these at day 1 post-surgery, but the proportion of patients reporting this reduced to one out of eight (12.5%) in the POD F group, and to zero in the POD F GF group after 1 month – there was no statistically significant difference in negative dysphotopsia rates between each treatment group (p>0.05). The VFQ-25 questionnaire revealed no significant difference between study groups (p>0.05) (Figure 6); both the POD F and POD F GF lenses scored very highly across all categories.
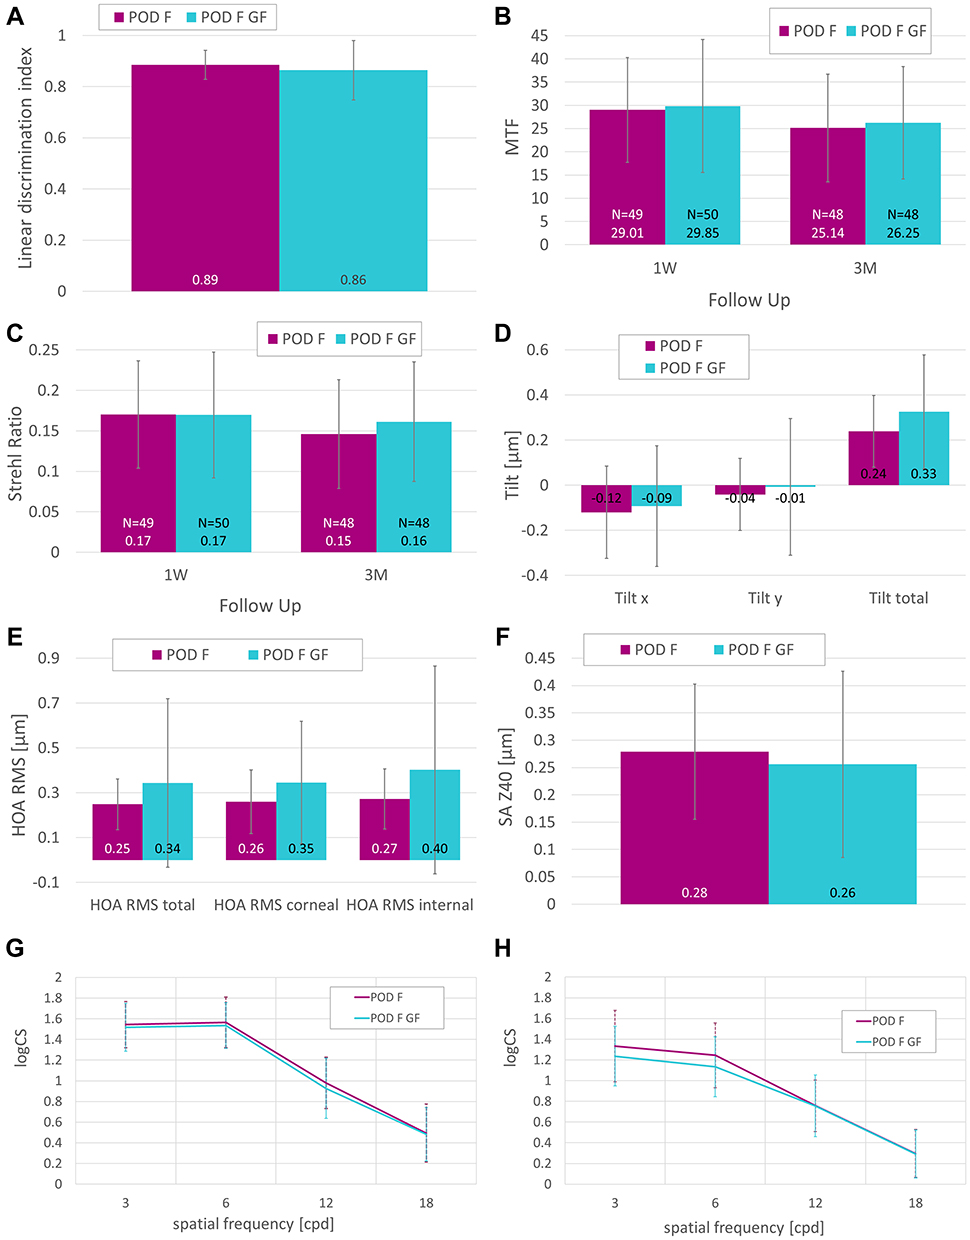 |
Figure 4 Halometry at 3 months (A), MTF at 1 week and 3 months (B), Strehl ratio at 1 week and 3 months (C), tilt at 1 month (D), HOA RMS at 1 month (E), spherical aberrations (F) and binocular photopic (G) and mesopic (H) contrast sensitivity (logCS) at 3 months per group. |
 |
Figure 5 Negative dysphotopsia at the 1-day (1D), 1-week (1W) and 1-month (1M) visit of the POD F group (A) and the POD F GF group (B). |
 |
Figure 6 Results of VFQ-25 questionnaire for each group conducted 3 months after surgery. |
The results of a Spearman correlation analysis of VFQ-25 total score versus VA, contrast and halometry indicated no significant correlations in the POD F group, but some (binocular UDVA and CDVA; Patch A and D at 85 cd/m2; and Patch A at 6 cd/m2) were seen in the POD F GF group (Table 3).
 |
Table 3 Correlation Analysis (Spearman): VFQ Total Score vs Visual Acuity, vs Contrast, and vs Halometry in Both Groups |
After 3 months, a detailed slit-lamp examination was performed. Three eyes (2.9%) from two patients (one per treatment group) showed PCO classified as “mild” but no Nd:YAG treatment was needed. Dry eye was diagnosed in six eyes (5.9%) of three patients (four in the POD F group, two in the POD F GF group). Three eyes (2.9%) of three patients (two patients from the POD F group, one from the POD F GF group) developed posterior vitreous detachment (PVD) at 3 months after surgery; one patient (POD F group) developed bilateral (1.96%) PVD at 1 month. No anterior capsular fibrosis was detected in any case.
Discussion
The FineVision POD F lens has repeatedly been shown in clinical trials to restore vision at various distances following cataract surgery, specifically intermediate and near vision.8–14 In the past, the FineVision optical design has also proven its effectiveness in numerous clinical studies with the hydrophilic Micro F IOL model (PhysIOL, Liége, Belgium).13,14,19–25 Unlike double-C-loop POD lenses, the Micro F IOL has a four-loop haptic design. Compared to extended depth of focus (EDOF) lenses, FineVision IOLs performed statistically significantly better in terms of uncorrected near vision.19,21 Furthermore, compared to bifocal lenses, the trifocal FineVision optic design allows for a higher degree of complete spectacle independence.25
This study demonstrated that the trifocal IOLs, POD F and POD F GF provided equally good unaided functional vision at far, intermediate and near distances, under both photopic and mesopic conditions, following binocular implantation in patients undergoing cataract surgery. Both lenses effectively and predictably reduced refractive errors, and our study found no disadvantages associated with the hydrophobic biomaterial used in the POD F GF lens.
Overall, our findings are in line with the recently published outcomes of Nagy et al.9 This prospective study compared the clinical outcomes of patients undergoing cataract surgery and implantation of POD F in one eye and POD F GF in the contralateral eye. The authors reported that 6 months after surgery there was no statistically significant difference in monocular distance, intermediate and near visual acuities, or contrast sensitivity under photopic and mesopic conditions.9 In the POD F GF group, mean logMAR monocular photopic UDVA, CDVA, DCIVA, and DCNVA at 6 months was 0.00±0.07, −0.04±0.08, 0.04±0.09, and 0.04±0.07, respectively. The POD F group showed mean logMAR values of 0.03±0.12 (UDVA), −0.04±0.09 (CDVA), 0.06±0.09 (DCIVA), and 0.08±0.08 (DCNVA).9 Summarizing the outcomes, which are presented in a meta-analysis of trifocal IOLs, mean monocular UDVA from 9 studies (n=344 eyes) was 0.03 logMAR.26 The review of another meta-analysis with trifocal lenses showed that the mean UDVA from 3 studies (n=81) was 0.07 logMAR, mean CDVA from 4 studies (n=105) was 0.01 logMAR, and mean DCNVA from 5 studies (n=149) was 0.11 logMAR.27
Interestingly, in our study, both the binocular defocus curve as well as binocular DCNVA showed a trend towards a better near VA in the POD F group. However, the difference between both groups was only statistically significant in the defocus curve at −3 D, which corresponds to the near vision. Furthermore, although not statistically significant, the mesopic contrast sensitivity of the POD F group at 3 and 6 cpd was slightly better than in the hydrophobic group. These findings are not consistent with recently published data where the authors reported no statistically significant difference between POD F and POD F GF regarding the monocular photopic defocus curve.9 Also, mesopic contrast sensitivity in this study was almost identical or even slightly better for POD F GF at 3 cpd.9
Multifocal IOLs do involve optical compromises, and one of the factors that can be compromised with such designs is contrast sensitivity; in this trial, as expected, both lenses’ mesopic results were slightly worse than their photopic results at high and low spatial frequencies. Another potential consequence of multifocal IOL optics is an increase in photic phenomena, but in the case of both the POD F and POD F IOLs, halometry results showed that neither lens appeared to introduce any additional problems to those reported for diffractive IOL designs. Single-piece hydrophobic acrylic high-refractive-index IOLs have been associated with higher rates of postoperative negative dysphotopsias,28 but best-practice placement of the optic-haptic junction, as was observed in this study, can help reduce these rates.16 It was therefore encouraging to observe that at 1 month postoperatively, there were no reports of negative dysphotopsia in patients implanted with the hydrophobic acrylic POD F GF IOL.
The MTF and Strehl Ratio were close to that of a normal population, and tilt, HAO and spherical aberrations were similar for both IOL models. The OSI was low in both groups and did not differ statistically significantly between the lenses.
In our study, no glistenings were observed in either group and there was no clinically relevant PCO over the follow-up time necessitating Nd:YAG posterior capsulotomy. This is consistent with the results of Nagy et al, who observed neither glistening nor significant PCO over a follow-up period of 6 months for POD F and POD F GF IOLs.9
Overall, this study showed that both lenses exhibited very satisfactory visual outcomes over a 3-month follow-up period, and that both the POD F and POD F GF lenses are essentially equivalent in visual outcomes at 1 and 3 months after implantation. Patient satisfaction scores, as assessed by the VFQ-25 questionnaire, were very high and similar in both lenses.
This study had some limitations; a relatively small study size and a final follow-up period of 3 months. A longer follow-up period of at least 6 months – particularly in relation to detecting the development of significant PCO and glistenings, none of which were observed in this trial, and which can take years to form – and a larger sample size would enable a more comprehensive assessment of lens performance.
Conclusion
In conclusion, this study demonstrated good visual and refractive outcomes with the new hydrophobic POD F GF lens compared with the existing hydrophilic POD F lens. Both IOLs allow for safe and efficient restoration of near, intermediate, and distance visual acuity for cataract patients undergoing IOL implantation. The introduction of a hydrophobic, glistening-free version of the established FineVision POD F trifocal design, and the knowledge that the FineVision POD F GF optics are essentially functionally equivalent to POD F, means that surgeons now have the option to choose this new material with a familiar optical design. This may become the lens of choice for patients where the benefits of a reduced risk of PCO and glistenings in the longer term are important considerations.
Data Sharing Statement
The authors do not intend so share individual patient raw data for reasons of data protection.
Funding
This study was sponsored by PhysIOL SA, Liège, Belgium.
Disclosure
The authors report no conflicts of interest in this work.
References
1. Alio JL, Plaza-Puche AB, Férnandez-Buenaga R, Pikkel J, Maldonado M. Multifocal intraocular lenses: an overview. Surv Ophthalmol. 2017;62(5):611–634. doi:10.1016/j.survophthal.2017.03.005
2. de Silva SR, Evans JR, Kirthi V, Ziaei M, Leyland M. Multifocal versus monofocal intraocular lenses after cataract extraction. Cochrane Database Syst Rev. 2016;12:Cd003169.
3. Zhao Y, Yang K, Li J, Huang Y, Zhu S. Comparison of hydrophobic and hydrophilic intraocular lens in preventing posterior capsule opacification after cataract surgery: an updated meta-analysis. Medicine (Baltimore). 2017;96(44):e8301. doi:10.1097/MD.0000000000008301
4. Buehl W, Findl O. Effect of intraocular lens design on posterior capsule opacification. J Cataract Refract Surg. 2008;34(11):1976–1985. doi:10.1016/j.jcrs.2008.07.029
5. Gregori NZ, Spencer TS, Mamalis N, Olson RJ. In vitro comparison of glistening formation among hydrophobic acrylic intraocular lenses(1). J Cataract Refract Surg. 2002;28(7):1262–1268. doi:10.1016/S0886-3350(02)01224-5
6. Chang A, Kugelberg M. Posterior capsule opacification 9 years after phacoemulsification with a hydrophobic and a hydrophilic intraocular lens. Eur J Ophthalmol. 2017;27(2):164–168. doi:10.5301/ejo.5000831
7. Li Y, Wang J, Chen Z, Tang X. Effect of hydrophobic acrylic versus hydrophilic acrylic intraocular lens on posterior capsule opacification: meta-analysis. PLoS One. 2013;8(11):e77864. doi:10.1371/journal.pone.0077864
8. Poyales F, Garzon N. Comparison of 3-month visual outcomes of a spherical and a toric trifocal intraocular lens. J Cataract Refract Surg. 2019;45(2):135–145. doi:10.1016/j.jcrs.2018.09.025
9. Nagy ZZ, Popper-Sachetti A, Kiss HJ. Comparison of visual and refractive outcomes between hydrophilic and hydrophobic trifocal intraocular lenses sharing the same optical design. J Cataract Refract Surg. 2019;45(5):553–561. doi:10.1016/j.jcrs.2018.11.034
10. Ferreira TB, Ribeiro FJ. Prospective comparison of clinical performance and subjective outcomes between two diffractive trifocal intraocular lenses in bilateral cataract surgery. J Refract Surg. 2019;35(7):418–425. doi:10.3928/1081597X-20190528-02
11. Ribeiro F, Ferreira TB. Comparison of clinical outcomes of three trifocal intraocular lenses. Online ahead of print. J Cataract Refract Surg. 2020.
12. Garzón N, García-Montero M, López-Artero E, et al. Influence of angle κ on visual and refractive outcomes after implantation of a diffractive trifocal intraocular lens. J Cataract Refract Surg. 2020;46(5):721–727. doi:10.1097/j.jcrs.0000000000000156
13. Poyales F, Garzón N, Pizarro D, Cobreces S, Hernández A. Stability and visual outcomes yielded by three intraocular trifocal lenses with same optical zone design but differing material or toricity. Eur J Ophthalmol. 2019;29(4):417–425. doi:10.1177/1120672118795065
14. Poyales F, Garzon N, Rozema JJ, Romero C, de Zarate BO. Stability of a novel intraocular lens design: comparison of two trifocal lenses. J Refract Surg. 2016;32(6):394–402. doi:10.3928/1081597X-20160428-04
15. Pagnoulle C, Bozukova D, Gobin L, Bertrand V, Gillet-de Pauw MC. Assessment of new-generation glistening-free hydrophobic acrylic intraocular lens material. J Cataract Refract Surg. 2012;38(7):1271–1277. doi:10.1016/j.jcrs.2012.02.041
16. Henderson BA, Yi DH, Constantine JB, Geneva II. New preventative approach for negative dysphotopsia. J Cataract Refract Surg. 2016;42(10):1449–1455. doi:10.1016/j.jcrs.2016.08.020
17. Mangione CM, Lee PP, Gutierrez PR, Spritzer K, Berry S, Hays RD. Development of the 25-item national eye institute visual function questionnaire. Arch Ophthalmol. 2001;119(7):1050–1058. doi:10.1001/archopht.119.7.1050
18. Sealed Envelope Ltd. Power calculator for continuous outcome equivalence trial [Online]; 2012. Available from: https://www.sealedenvelope.com/power/continuous-equivalence/.
19. Cochener B, Boutillier G, Lamard M, Auberger-Zagnoli C. A comparative evaluation of a new generation of diffractive trifocal and extended depth of focus intraocular lenses. J Refract Surg. 2018;34(8):507–514. doi:10.3928/1081597X-20180530-02
20. Sudhir RR, Dey A, Bhattacharrya S, Bahulayan A. AcrySof IQ PanOptix intraocular lens versus extended depth of focus intraocular lens and trifocal intraocular lens: a clinical overview. Asia Pac J Ophthalmol (Phila). 2019;8(4):335–349. doi:10.1097/APO.0000000000000253
21. Singh B, Sharma S, Dadia S, Bharti N, Bharti S. Comparative evaluation of visual outcomes after bilateral implantation of a diffractive trifocal intraocular lens and an extended depth of focus intraocular lens. Eye Contact Lens. 2020;46(5):314–318.
22. Ferreira-Ríos I, Zuñiga-Posselt K, Serna-Ojeda JC, Chávez-Mondragón E. Objective and subjective results following implantation of the FineVision trifocal intraocular lens in Mexican patients. Int Ophthalmol. 2018;38(6):2617–2622. doi:10.1007/s10792-017-0725-x
23. Bilbao-Calabuig R, Llovet-Rausell A, Ortega-Usobiaga J, et al. Visual outcomes following bilateral implantation of two diffractive trifocal intraocular lenses in 10 084 eyes. Am J Ophthalmol. 2017;179:55–66. doi:10.1016/j.ajo.2017.04.013
24. Marques EF, Ferreira TB. Comparison of visual outcomes of 2 diffractive trifocal intraocular lenses. J Cataract Refract Surg. 2015;41(2):354–363. doi:10.1016/j.jcrs.2014.05.048
25. Jonker SM, Bauer NJ, Makhotkina NY, Berendschot TT, van den Biggelaar FJ, Nuijts RM. Comparison of a trifocal intraocular lens with a +3.0 D bifocal IOL: results of a prospective randomized clinical trial. J Cataract Refract Surg. 2015;41(8):1631–1640. doi:10.1016/j.jcrs.2015.08.011
26. Yoon CH, Shin IS, Kim MK. Trifocal versus bifocal diffractive intraocular lens implantation after cataract surgery or refractive lens exchange: a meta-analysis. J Korean Med Sci. 2018;33(44):e275. doi:10.3346/jkms.2018.33.e275
27. Shen Z, Lin Y, Zhu Y, Liu X, Yan J, Yao K. Clinical comparison of patient outcomes following implantation of trifocal or bifocal intraocular lenses: a systematic review and meta-analysis. Sci Rep. 2017;7:45337. doi:10.1038/srep45337
28. Davison JA. Positive and negative dysphotopsia in patients with acrylic intraocular lenses. J Cataract Refract Surg. 2000;26(9):1346–1355. doi:10.1016/S0886-3350(00)00611-8
 © 2020 The Author(s). This work is published and licensed by Dove Medical Press Limited. The
full terms of this license are available at https://www.dovepress.com/terms
and incorporate the Creative Commons Attribution
- Non Commercial (unported, 3.0) License.
By accessing the work you hereby accept the Terms. Non-commercial uses of the work are permitted
without any further permission from Dove Medical Press Limited, provided the work is properly
attributed. For permission for commercial use of this work, please see paragraphs 4.2 and 5 of our Terms.
© 2020 The Author(s). This work is published and licensed by Dove Medical Press Limited. The
full terms of this license are available at https://www.dovepress.com/terms
and incorporate the Creative Commons Attribution
- Non Commercial (unported, 3.0) License.
By accessing the work you hereby accept the Terms. Non-commercial uses of the work are permitted
without any further permission from Dove Medical Press Limited, provided the work is properly
attributed. For permission for commercial use of this work, please see paragraphs 4.2 and 5 of our Terms.