Back to Journals » Clinical Ophthalmology » Volume 13
Comparison of two devices to simulate vision with intraocular lenses
Authors Wahl S ![]() , Song C, Ohlendorf A
, Song C, Ohlendorf A ![]()
Received 26 September 2018
Accepted for publication 29 November 2018
Published 4 January 2019 Volume 2019:13 Pages 123—130
DOI https://doi.org/10.2147/OPTH.S188890
Checked for plagiarism Yes
Review by Single anonymous peer review
Peer reviewer comments 3
Editor who approved publication: Dr Scott Fraser
Siegfried Wahl,1,2 Chengyang Song,1 Arne Ohlendorf1,2
1Institute for Ophthalmic Research, Eberhard Karls University Tuebingen, Tuebingen, Baden-Wuerttemberg, Germany; 2Technology and Innovation, Carl Zeiss Vision International GmbH, Aalen, Baden-Wuerttemberg, Germany
Introduction: The simulation of vision with intraocular lenses (IOLs) prior to the clinical validation is of great interest for manufacturers as well as clinicians. We have tested the influence of different IOLs on the perception of contrast using different devices.
Materials and methods: A Rassow telescope and the VirtIOL have been used to assess the contrast sensitivity function (CSF) through monfocal IOL (CT Asphina 409 MP, IOL 1), multifocal IOL (AT LISA tri 839 MP, IOL 2) and extended-depth-of-focus-IOL (TECNIS Symfony ZXR00, IOL3) in 21 participants, aged between 22 and 29 years. Contrast sensitivity (CS) was tested at various spatial frequencies (3–30 cycles per degree), using the Tuebingen contrast sensitivity test.
Results: All tested IOL reduced the CS when compared to measurements with a trial lens correction of refractive errors. The analysis of the area under the curve of the contrast sensitivity function (AUC-CSF) revealed a significant reduction compared to the trial lens correction in case the Rassow telescope was used (IOL 1: P=0.008; IOL2: P<0.001; IOL3: P<0.001) and the same was true for the VirtIOL device for IOL2 and IOL3 (IOL2: P<0.001; IOL3: P<0.001), but not for IOL1 (P=0.192). Interdevice analysis of the AUC-CSF revealed significant differences for IOL1 and IOL2 (IOL1: P=0.025; IOL2: P<0.001), while no difference was found for IOL3 (P=0.092). Bland–Altman analysis as well as intraclass correlations coefficients indicated only weak interdevice agreement for the tested IOL.
Conclusion: The assessment of the interdevice analysis for the Rassow telescope and the VirtIOL device revealed only a minor agreement between the two devices. In order to investigate vision with IOLs prior to a clinical validation, the use of the VirtIOL device is recommended.
Keywords: contrast sensitivity, cataract, vision, psychophysics
Introduction
Visual accommodation describes the possibility of the eye to change its focus over a wide range of distances, and this capability is depending on the age of the individual.1 With increasing age, the crystalline lens loses its ability to change its refractive power – a refractive state that is called presbyopia and that usually starts around an age of 40 years.1 To overcome this limitations, presbyopia can be corrected using single vision spectacle lenses, bifocal or multifocal spectacle lenses as well as contact lenses, refractive surgery, or intraocular lenses (IOLs) with more than one focus. While IOLs are used to restore vision in the cataract eyes, the trend goes toward the so-called refractive lens exchange of the clear lens in precataract or early-presbyopic individuals.2,3 This approach should enable clear vision in various distances without the use of spectacle or contact lenses, the so-called spectacle lens or contact lens independence. The optical design of multifocal IOL can be divided in to refractive or diffractive designs and provide foci for two distances (bifocal IOLs [BIOL]), three distances (trifocal IOLs [TIOL]) or are the so-called extended-depth-of-focus lenses, where a distinct focus is not perceivable.4,5 Since the development of any multifocal design of IOLs at a first glance is done by optical design software, the testing prior to the implantation is normally done on optical benches in order to ensure the compliance to regulatory requirements. In the past, vision of an eye implanted with such a newly developed IOL was mainly studied in clinical trials several weeks after implantation, while visual acuity or contrast sensitivity (CS) was measured. In order to reduce the effort and to be able to gain knowledge on the performance of such an IOL prior to implantation, already Kusel and Rassow6 presented the so-called Rassow telescope. In the last years, further developments of these devices have been presented, and until now, there are several of these devices commercially available, for example, the simultaneous vision device7 or the VirtIOL.8 Using such devices, simulations are performed in vivo, while an IOL is imposed on the optics of the patient artificially to deduct the impact of the IOLs that is tested on any visual function. A widely used indicator for the visual performance of BIOL and TIOL is the measurement of the high-contrast visual acuity in order to distinguish the smallest visual angle that can be seen with such a lens at a defined distance9 or with a defined amount of spherical defocus.10 Since visual acuity only describes the cutoff spatial frequency of the eye, this measure only mimics a small part of the whole perception of the eye and does not completely describe the visual function of the eye.11 For example, several abnormalities in vision have been described where visual acuity was normal, while only the measurement of the contrast sensitivity function (CSF) revealed such abnormalities.12,13 Therefore, the measurement of the sensitivity to contrast is of higher importance, since one can not only measure the cutoff frequency that is equivalent to visual acuity but also the perception of contrast that is depending on the spatial frequency14 with the used method of correction. So far, most studies that report on the CS of different IOLs (monofocal IOL, BIOL, TIOL, or extended depth-of-focus) only report the CS for a limited range of spatial frequencies and with a psychophysical paradigm that is not ideal, especially since most of the clinical standard tests are printed charts with only a limited number of contrasts for each spatial frequency. The purpose of the current study was to measure and compare the CSF with different optical designs IOLs, in a study cohort of precataract subjects, when vision through IOLs was simulated with two devices, the Rassow telescope and the VirtIOL device. Consequently, we are able to compare the different IOLs regarding their performance to perceive contrast and to give advices regarding the use of such a device.
Materials and methods
Subjects
Twenty-one participants, all within an age range between 22 and 29 years and with a mean spherical equivalent refractive error of −2.99D±2.74D, were recruited for the study. Habitual refractive errors, if existing, were corrected using a trial frame and trial lenses, and normal or corrected to normal visual acuity was 0.00 logMAR (=1.0 decimal visual acuity). Subjects with known ocular diseases were excluded from the study. All participants were aware of this exclusion criterion and answered a questionnaire before the experiment. Binocular vision of the participants was tested using the bichrome balance test during the subjective refraction. The content and possible consequences were explained prior to the study, and all participants gave their written consent. The study course was approved from the Ethics Commission of the Medical Faculty of the University of Tuebingen, and the research followed the tenets of the Declaration of Helsinki.
Intraocular lenses
Three different IOLs from two manufactures were used in the study, and detailed information about these lenses can be obtained from Table 1.
 | Table 1 Details of the three IOLs that were used in the study |
Devices to simulate vision with IOL
Two devices were used to simulate vision with IOLs, the so-called Rassow telescope6 and the VirtIOL.8 The Rassow telescope was custom build with the following specifications: a biconvex lens with an optical power of 20D and the IOL of the same power. The IOL was placed in an artificial eye that was filled with distilled water, and the biconvex lens was placed behind the IOL with a distance that was equivalent to the doubling of the focal length of the IOL. The distance between the biconvex lens and the eye of the participant was also twice the focal length of the lens. With this setup, it was assured that there was no magnification or minimization effect of the stimuli that was presented on the monitor. However the image of the target was inversed, but since Gabor Patches were used, there would have been no effect on the perception (of the contrast and the direction) of the stimuli. The VirtIOL is a commercially available product and its optical setup is more complex. While the IOL is also placed in an artificial eye that is filled with distilled water, the same eye contains a 40D lens behind the IOL. Additionally, the artificial eye can be fixated through a magnetic support in a fixed position in order to limit rotations. Any object is imaged ~15–30 mm from the IOL, depending on its power. A second lens with a power of 60D is used to image the object into the eyes pupil plane of the subject. For both devices, an artificial pupil of 4 mm was used. This pupil size can be adjusted in the VirtIOL and correct positioning of the observers eye as well as the pupil size could be detected with a live image of an attached camera that continually records the eye. In case of the Rassow telescope, the artificial pupil was placed in front of the artificial eye. The order of the use of each device followed an ABBA pattern.15
The Tuebingen contrast sensitivity test (TueCST)
The TueCST14 was used to measure CS at spatial frequencies of 3, 6, 12, 18, 24, and 30 cycles per degree in the dominant eye of the test persons. The test uses a Bayesian adaptive method that is called Ψ (psi) method for the acquisition of the threshold contrast of the psychometric function,16 and the slope of the psychometric function was set to 2.74 with a lapse rate of 4%, as suggested by Hou et al.17 Forty trials were used to determine the contrast threshold of the participants’ dominant eye. Stimuli for the test were Gabor Patches with a visual angle of 1.7° that were randomly displayed in four different directions. The test was controlled by MATLAB (Matlab R2010b, MathWorks Inc., Natick, MA, USA) running on Mac OSX, version 10.9.5. In order to present the Gabor Patches with a high gray-level resolution of 16 bits (216 levels), an LCD-Display (ViewPixx 3D, VPixx Technologies, Saint-Bruno, Canada) with a mean luminance of the Gabor Patches of 20 cd/m² and a pixel resolution of 1,920×1,080 was used. The monitor was placed 2 m in front of the participant’s dominant eye in order to be able to present spatial frequencies up to 30 cycles per degree (equivalent to a visual acuity of 0.0 logMAR). CS was tested with all IOLs and while refractive errors were corrected with trial lenses that were placed in a trial frame. The use of each IOL was randomized individually for each subject. In order to maintain the best focus while looking through the IOLs, the visual acuity was tested prior the start of each experiment. Therefore, an acuity chart was presented in the distance of 2 m and the spherical correction that was worn in the trial frame was adapted until highest visual acuity was reached with maximum positive spherical correction.
Statistical analysis
The data processing and calculation were carried using MS Excel (Microsoft Corporation, Redmond, WA, USA) and Matlab 2016b (MathWorks Inc.). The statistical analysis was carried out with IBM SPSS statistics 24 (International Business Machines Corp., Armonk, NY, USA). The statistical analysis of the area under the curve of the contrast sensitivity function (AUC-CSF) was done using the Friedman test, with additional pairwise post hoc analysis between each data sets and Bonferroni correction of significance values.
Results
Contrast sensitivity
Figure 1 presents the mean CSF with the three IOLs (Figure 1A: IOL1, Figure 1B: IOL2, and Figure 1C: IOL3), when obtained with both devices.
 | Figure 1 Comparison of mean contrast sensitivity curves of IOL1 (A), IOL2 (B), and IOL3 (C) tested with both the Rassow telescope (blue) and VirtIOL (red). |
As can be observed from Figure 1, CS was always better when tested with the VirtIOL device. Additionally, the design of the IOLs influenced the CSF, while the IOL1 affected the CSF only minor when compared to the IOL2 and IOL3. In order to statistically analyze the differences between the IOLs and the devices, the so-called AUC-CSF was used for the further analysis. The AUC-CSF was calculated for each used correction method (trial lenses, IOL1, IOL2, and IOL3) and both devices (Rassow telescope, VirtIOL). Table 2 summarizes the mean AUC-CSF for each IOL, tested with each device and the AUC-CSF during the test of the CSF with the trial frame correction.
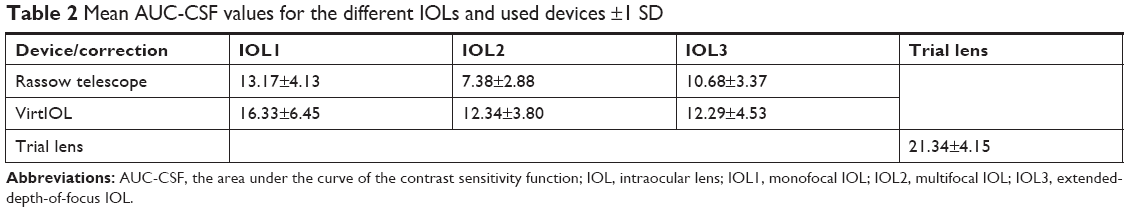 | Table 2 Mean AUC-CSF values for the different IOLs and used devices ±1 SD |
In order to visualize the AUC-CSF with the trial lens correction as well as when CS was measured with the different IOL and both the devices, Figure 2 displays the mean AUC-CSF ±1 SD.
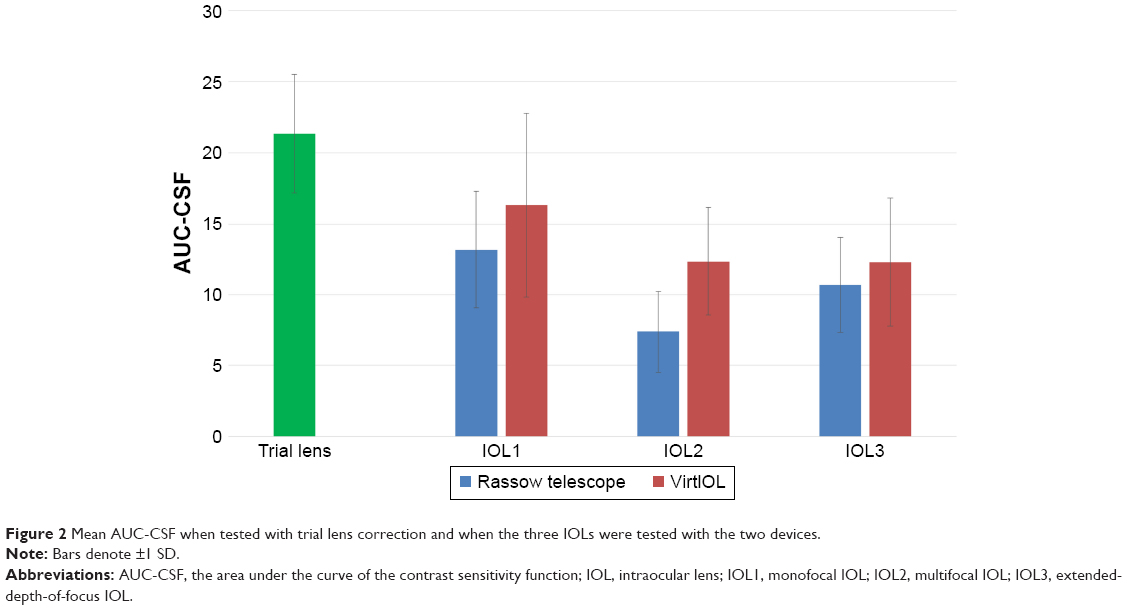 | Figure 2 Mean AUC-CSF when tested with trial lens correction and when the three IOLs were tested with the two devices. |
Table 2 and Figure 2 clearly indicate that the trial lens correction resulted in the best CSF and therefore in the highest AUC-CSF value. When comparing the different IOLs, the IOL1 reduced the CSF as well as the AUC-CSF only slightly, when compared to the trial lens correction, while higher reductions were observed for IOL2 and IOL3. A pairwise post hoc analysis including a Bonferroni correction of the Friedman test revealed the following: using the Rassow telescope, all IOLs reduced the AUC-CSF significantly compared to the trial lens correction (IOL1: P=0.008; IOL2: P<0.001; IOL3: P<0.001) and the same was true for the VirtIOL device (IOL2: P<0.001; IO3: P<0.001), except for IOL1 (P=0.192). Comparing the AUC-CSF of the different IOLs, when using the Rassow telescope to measure CS, no differences were observed for IOL2 vs IOL3 (P=0.139) and IOL1 vs IOL3 (P=0.721), while IOL2 and IOL1 were significantly different (P<0.001). In case the VirtIOL was used, a significant difference was found for IOL3 vs IOL1 (P=0.018), but neither for IOL1 vs IOL2 (P=0.063) or IOL2 vs IOL3 (P=1.0). In order to compare the results for the AUC-CSF for each IOL, when both devices were used, a Wilcoxon signed-rank test was used. Results for IOL1 and IOL2 showed significant differences between the two devices (IOL1: P=0.025, IOL2: P<0.001), while no difference was found for IOL3 (P=0.092).
Interdevice analysis
Bland–Altman analysis18 and ICC coefficients19 were used to statistically analyze the conducted interdevice analysis for the AUC-CSF. The Bland–Altman analysis represents the agreement of two data sets, which are, for example, measured by two different methods. Table 3 summarizes the mean difference for each IOL and both devices, the 95% limit of agreement (95% LoA=1.96 × SD) as well as the 95% CI of the upper limit and the 95% CI of the lower limit of the AUC-CSF for all participants and IOLs.
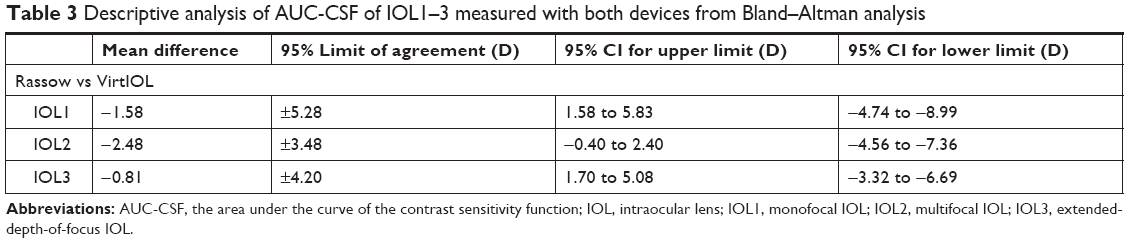 | Table 3 Descriptive analysis of AUC-CSF of IOL1–3 measured with both devices from Bland–Altman analysis |
In order to visualize the mean differences, as well as the 95% LoA and the 95% CI for the lower as well as upper limit, Figure 3 represents the Bland–Altman plots.
 | Figure 3 Difference vs mean plot to compare the three IOLs (A: IOL1, B: IOL2, C: IOL3), when vision was simulated with the Rassow telescope and the VirtIOL device. |
Unexpectedly, IOL1 gave a high (negative) mean difference and also the highest 95% LoA for all tested IOLs. A high mean difference but only minor 95% LoA were found for IOL2 in the test, while the IOL3 showed the smallest mean difference for the AUC-CSF for both devices but higher amounts of 95% LoA.
Apart from the Bland–Altman analysis, the ICC coefficients19 were used to analyze the consistency of the AUC-CSF results of IOL1–3. In this analysis, a two-way mixed absolute agreement calculation ICC (3, k) was conducted and the results are shown in Table 4.
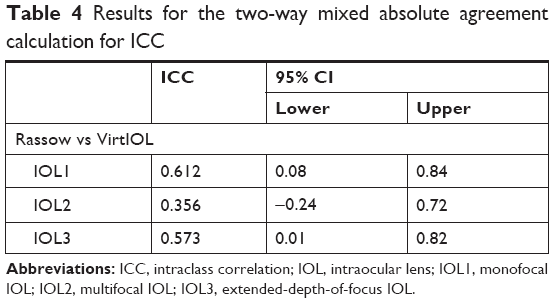 | Table 4 Results for the two-way mixed absolute agreement calculation for ICC |
Discussion
In this study, we have evaluated the influence of IOL1, IOL2, and IOL3 on the CS of the eye, when vision through IOLs was simulated with two different devices.
Intraocular lenses and CS
One has to take into account that the presented results were obtained under the best correction of the habitual refractive errors of each subject’s dominant eye for the test distance of 2 m, and therefore, the assessment of the direct influence of the IOL itself on the CSF was evaluated. Additionally, such experiments could introduce an initial bias by the use of IOLs outside the eye – the questions still remains if the simulated performance is equivalent to results observed in real patients. All tested IOLs reduced the sensitivity to perceive contrast at the various tested spatial frequencies, when compared to the test with the trial frame, and the IOL2 had a bigger influence compared to the IOL1. Testing CS at spatial frequencies between 1 and 10 cycles per degree, Yamauchi et al20 also observed a significant difference in CS between IOL1 and IOL2 in a group of patients, implanted with either IOL1 or IOL2 of the same manufacturer (Tecnis monofocal IOLs [ZA9003 or ZCB00] or Tecnis multifocal IOLs [ZMA00 or ZMB00]). Since the same authors20 included the typical CS of subjects with an average age of 60 years, they were able to conclude that the observed difference between IOL1 and IOL2 had no clinical significance, since the typical contrast threshold in elderly persons was even worse compared to their study group. Measuring the CS in patients implanted with IOL1 or IOL2, Packer et al21 also observed a reduction in the perception of contrast in patients implanted with the IOL2, when compared to patients implanted with IOL1. Since a loss in the sensitivity to contrast is unavoidable in IOL2 due to its optical design, the current study showed that the reduction is comparable between IOL2 and IOL3, either tested with the custom-build Rassow telescope or with the VirtIOL device. As mentioned before, CS reveals a better description of the visual function of the eye as an optical system as for example the measured high-contrast visual acuity. Since the CSF not only describes the contrast threshold that is needed but also gives information on the visual acuity. Figure 1 clearly indicates that the resolution limit of the IOL1 was superior compared to both tested multifocal IOLs, especially when tested with the VirtIOL. Additionally, the resolution limit was higher in case the VirtIOL device was used, which indicates that simulation of vision with IOLs by using the Rassow telescope results in a lower visual acuity compared to the VirtIOL device.
Interdevice agreement
When CS was assessed with the two devices and the same IOL, significant differences were observed. The question arises if this difference can be caused by the test that is used to assess the CS or by the device itself. Since the used TueCST offers higher precision, intertest repeatability, and test–retest reliability for the measurement of the CS when compared to other existing tests, the observed differences can be accounted to be caused by the used device. The Bland–Altman analysis revealed moderate to high differences in the analyzed AUC-CSF for the different IOLs and the two used devices. Surprisingly, since the optical design of a monofocal lens is intended to provide the focus for only one distance, the mean difference between the Rassow telescope and the VirtIOL devices was the highest. In case of IOL2, the results between the two devices showed a smaller mean difference as well as smaller 95% LoA, which would indicate a better accordance for the CSF, when assessed with the two devices. The statistical analysis of the AUC-CSF for IOL3 revealed no significant differences between the Rassow telescope and the VirtIOL device, and this is also indicated by Table 3, since the mean difference between the two devices was the smallest among the three comparisons. Additionally, most of the AUC-CSF values for the 21 subjects who participated in the study were within the 95% LoA, and therefore, one could argue that the obtained results with the two devices are exchangeable. Since the mean difference was always negative, the CSF that was measured with the Rassow telescope was always smaller compared to the use of the VirtIOL device, a result that is also confirmed by Figure 1. Since the 95% CIs are quite large, a weak correlation of the test results acquired by both devices is expected. In order to evaluate the correlation between these two devices, the ICC was calculated. Depending on the IOL, the ICC ranged between 0.356 and 0.612. In general, these results do not suggest a good interdevice agreement regarding the AUC-CSF for the single IOLs. According to Cicchetti,22 the interdevice agreement can be defined as “poor” when the ICC coefficient is below 0.4, “fair” when the ICC coefficient is between 0.4 and 0.59, and a “good” correlation between two devices has an ICC value between 0.6 and 0.74. If the ICC coefficient is between 0.75 and 1.0, then the interdevice agreement can be described as “excellent”. IOL1 has the highest ICC value (ICC: 0.612), followed by IOL3 (ICC: 0.573) and IOL2 (ICC: 0.356). One has to keep in mind that the presented data were gathered in experiments with young subjects (mean age: 25 years) without known ocular diseases or clouding of the crystalline lens. Additionally, it was not possible to confirm the obtained data in a clinical data set of patients implanted with the IOLs that were used in the course of the study. Therefore, it is not possible to conclude if the observed higher CS with the VirtIOL is in line with measurements that are conducted in real patients.
Agreement with clinical outcomes
Comparing the results regarding the measured sensitivity to contrast when vision through an IOL is simulated (as in the current study) with clinical studies is of high importance. Only in case the results of these two attempts agree, the simulation of the visual experience is of significant value for the future use of such attempts for the research and development of new models of IOLs. Mojzis et al23 reported a logarithmic sensitivity to contrast above 1.5 under photopic conditions for spatial frequencies of 1.5, 3, and 6 cycles per degree when CS was tested with the AT LISA tri 839 MP (Lens #2 of the current study). A similar outcome was reported by Mencucci et al24 for IOL2 (AT LISA tri 839 MP) and IOL3 that were used in the current study (TECNIS Symfony ZXR00). In contrast, the current study found a lower logCS for similar tested spatial frequencies when compared to these clinical assessments of the sensitivity to contrast. On the one hand, this would indicate that a simulation of the visual experience would underestimate clinical findings, which might limit the use of the presented technologies. On the other hand, the observed difference might only be the consequence of different psychophysical methods that were used. So far, sensitivity to contrast is clinically measured using simple charts, or screening devices such as the Optec 6500 Vision Tester (Stereo Optical Co., Inc., Chicago, IL, USA). These test have in common that they only test CS at a very limited range of spatial frequencies, while the threshold contrast is measured while only a limited amount of contrasts are presented to the eye. In the current study, a computer-based presentation of contrast was used with 40 trials for each spatial frequency to accurately measure the contrast threshold. In both cases, the question if the observed differences are of statistical significance and/or clinical relevance is not answered.
Conclusion
The preclinical validation if the visual performance is of increasing interest for manufacturers of IOLs, scientists and clinicans. Nevertheless, a validation of the results to the clinical measurement of the sensitivity to contrast still needs to proof if the obtained results are comparable. The interdevice comparison of the CSF of the Rassow telescope and the VirtIOL device revealed significant differences and only a minor interdevice agreement. In order to better predict the visual performance of an IOL regarding, for example, the maximal visual acuity or the CS at different spatial frequencies, we can recommend the use of the VirtIOL device.
Acknowledgment
We acknowledge support by Deutsche Forschungsgemeinschaft and Open Access Publishing Fund of University of Tübingen.
Disclosure
The authors report no conflicts of interest in this work.
References
Helmholtz H. Ueber die Accommodation des Auges. Albrecht von Graefes Archiv für Ophthalmologie. 1855;2(1):1–74. | ||
Alio JL, Grzybowski A, El Aswad A, Romaniuk D. Refractive lens exchange. Surv Ophthalmol. 2014;59(6):579–598. | ||
Alió JL, Grzybowski A, Romaniuk D. Refractive lens exchange in modern practice: when and when not to do it? Eye Vis (Lond). 2014;1:10. | ||
Chehade M, Elder MJ. Intraocular lens materials and styles: a review. Aust N Z J Ophthalmol. 1997;25(4):255–263. | ||
Zeng L, Fang F. Advances and challenges of intraocular lens design [Invited]. Appl Opt. 2018;57(25):7363–7376. | ||
Kusel R, Rassow B. Präoperative Abschätzung des mit Intraokularlinsen erreichbaren Sehvermögens. Klinische Monatsblätter für Augenheilkunde. 1999;215(08):127–131. | ||
Dorronsoro C, Radhakrishnan A, Alonso-Sanz JR, et al. Portable simultaneous vision device to simulate multifocal corrections. Optica. 2016;3(8):918–924. | ||
Pujol J, Aldaba M, Giner A, Arasa J, Luque SO. Visual performance evaluation of a new multifocal intraocular lens design before surgery. Invest Ophthalmol Vis Sci. 2014;55(13):3752. | ||
Hayashi K, Manabe S, Hayashi H. Visual acuity from far to near and contrast sensitivity in eyes with a diffractive multifocal intraocular lens with a low addition power. J Cataract Refract Surg. 2009;35(12):2070–2076. | ||
Buckhurst PJ, Wolffsohn JS, Naroo SA, et al. Multifocal intraocular lens differentiation using defocus curves. Investig Opthalmol Visual Sci. 2012;53(7):3920–3926. | ||
Comerford JP. Vision evaluation using contrast sensitivity functions. Am J Optom Physiol Opt. 1983;60(5):394–398. | ||
Ross JE, Bron AJ, Clarke DD. Contrast sensitivity and visual disability in chronic simple glaucoma. Br J Ophthalmol. 1984;68(11):821–827. | ||
Sabour-Pickett S, Loughman J, Nolan JM, et al. Visual performance in patients with neovascular age-related macular degeneration undergoing treatment with intravitreal ranibizumab. J Ophthalmol. 2013;2013(3):1–7. | ||
Schilling T, Ohlendorf A, Leube A, Wahl S. TuebingenCSTest – a useful method to assess the contrast sensitivity function. Biomed Opt Express. 2017;8(3):1477–1487. | ||
VanderStoep SW, Johnston DD. Research Methods for Everyday Life: Blending Qualitative and Quantitative Approaches. San Francisco (CA): Jossey-Bass; 2009. | ||
Kontsevich LL, Tyler CW. Bayesian adaptive estimation of psychometric slope and threshold. Vision Res. 1999;39(16):2729–2737. | ||
Hou F, Lesmes L, Bex P, Dorr M, Lu ZL. Using 10AFC to further improve the efficiency of the quick CSF method. J Vis. 2015;15(9):2. | ||
Bland JM, Altman DG. Statistical methods for assessing agreement between two methods of clinical measurement. Lancet. 1986;1(8476):307–310. | ||
McAlinden C, Khadka J, Pesudovs K. Statistical methods for conducting agreement (comparison of clinical tests) and precision (repeatability or reproducibility) studies in optometry and ophthalmology. Ophthalmic Physiol Opt. 2011;31(4):330–338. | ||
Yamauchi T, Tabuchi H, Takase K, Ohsugi H, Ohara Z, Kiuchi Y. Comparison of visual performance of multifocal intraocular lenses with same material monofocal intraocular lenses. PLoS One. 2013;8(6):e68236. | ||
Packer M, Chu YR, Waltz KL, et al. Evaluation of the aspheric tecnis multifocal intraocular lens: one-year results from the first cohort of the food and drug administration clinical trial. Am J Ophthalmol. 2010;149(4):577–584.e1. | ||
Cicchetti DV. Guidelines, criteria, and rules of thumb for evaluating normed and standardized assessment instruments in psychology. Psychol Assess. 1994;6(4):284–290. | ||
Mojzis P, Majerova K, Plaza-Puche AB, Hrckova L, Alio JL. Visual outcomes of a new toric trifocal diffractive intraocular lens. J Cataract Refract Surg. 2015;41(12):2695–2706. | ||
Mencucci R, Favuzza E, Caporossi O, Savastano A, Rizzo S. Comparative analysis of visual outcomes, reading skills, contrast sensitivity, and patient satisfaction with two models of trifocal diffractive intraocular lenses and an extended range of vision intraocular lens. Graefes Arch Clin Exp Ophthalmol. 2018;256(10):1913–1922. |
 © 2019 The Author(s). This work is published and licensed by Dove Medical Press Limited. The
full terms of this license are available at https://www.dovepress.com/terms
and incorporate the Creative Commons Attribution
- Non Commercial (unported, 3.0) License.
By accessing the work you hereby accept the Terms. Non-commercial uses of the work are permitted
without any further permission from Dove Medical Press Limited, provided the work is properly
attributed. For permission for commercial use of this work, please see paragraphs 4.2 and 5 of our Terms.
© 2019 The Author(s). This work is published and licensed by Dove Medical Press Limited. The
full terms of this license are available at https://www.dovepress.com/terms
and incorporate the Creative Commons Attribution
- Non Commercial (unported, 3.0) License.
By accessing the work you hereby accept the Terms. Non-commercial uses of the work are permitted
without any further permission from Dove Medical Press Limited, provided the work is properly
attributed. For permission for commercial use of this work, please see paragraphs 4.2 and 5 of our Terms.