Back to Journals » Clinical Interventions in Aging » Volume 13
Comparison of three tools for predicting primary osteoporosis in an elderly male population in Beijing: a cross-sectional study
Authors Zhang X ![]() , Lin J, Yang Y, Wu H, Li Y, Yang X, Fei Q
, Lin J, Yang Y, Wu H, Li Y, Yang X, Fei Q ![]()
Received 6 July 2017
Accepted for publication 8 December 2017
Published 2 February 2018 Volume 2018:13 Pages 201—209
DOI https://doi.org/10.2147/CIA.S145741
Checked for plagiarism Yes
Review by Single anonymous peer review
Peer reviewer comments 3
Editor who approved publication: Dr Zhi-Ying Wu
XiaoDong Zhang,1,* JiSheng Lin,1,* Yong Yang,1 Hao Wu,2 Yongjin Li,3 Xiuquan Yang,4 Qi Fei1,*
1Department of Orthopedics, Beijing Friendship Hospital, Capital Medical University, 2Fangzhuang Community Health Service Center, 3Tuanjiehu Community Health Service Center, 4Wangzuo Community Health Service Center, Beijing, People’s Republic of China
*These authors contributed equally to this work
Purpose: In this cross-sectional study, three clinical tools, the Osteoporosis Self-Assessment Tool for Asians (OSTA), Fracture Risk Assessment Tool (FRAX) without bone mineral density (BMD), and body mass index (BMI), for predicting primary osteoporosis (OP) were compared and ideal thresholds for omission of screening BMD were proposed in a community-dwelling elderly Han Beijing male population.
Patients and methods: A total of 1,349 community-dwelling elderly Han Beijing males aged ≥50 years were enrolled in this study. All subjects completed a questionnaire and measured BMD by dual-energy X-ray absorptiometry (DXA). Osteoporosis was defined as a T-score of -2.5 SD or lower than that of the average young adult in different diagnostic criteria (lumbar spine [L1–L4], femoral neck, total hip, worst hip, and World Health Organization [WHO]). FRAX without BMD, OSTA, and BMI were assessed for predicting OP by receiver operating characteristic (ROC) curves. Sensitivity, specificity, and areas under the ROC curves (AUCs) were determined. Ideal thresholds for omission of screening BMD were proposed.
Results: The prevalence of OP ranged from 1.8% to 12.8% according to different diagnostic criteria. This study showed that the BMI has highest discriminating ability. The AUC of FRAX without BMD ranged from 0.536 to 0.630, which suggested limiting predictive value for identifying OP in elderly Beijing male. The AUCs of BMI (0.801–0.880) were slightly better than OSTA (0.722–0.874) in predicting OP at all sites. The AUC of BMI to identify OP in worst hip was 0.824, yielding a sensitivity of 84.8% and a specificity of 64.4%. 40% of participants on BMD measurements saved only 0.1%–2.7% missed OP. Compared to OSTA and FRAX without BMD, the BMI got the best predictive value for OP.
Conclusion: BMI may be a simple and effective tool for identifying OP in the elderly male population in Beijing to omit BMD screening reasonably.
Keywords: male, osteoporosis, Osteoporosis Self-Assessment Tool for Asians, OSTA, Fracture Risk Assessment Tool, FRAX, body mass index, BMI
Introduction
Osteoporotic fractures have become a major source of mortality and morbidity in older people due to the progressive aging of the population.1 In most developing countries, osteoporosis (OP) has rapidly become a critical health problem as it is related to age and costs. Although OP has become a major threat to aging women in terms of morbidity and mortality, it has not been widely recognized as a significant health issue in aging male population. The majority of elderly men who have a previous fragility fracture are not aware of undergoing bone mineral density (BMD) screening tests or receiving medical treatment.2,3 OP in men is largely neglected in People’s Republic of China. Prediction of the risk of developing OP in elderly males is important to prevent the occurrence of first fracture.
A previous study indicates that men lose 1% of BMD every year from the sixth decade.4 With the development of economy and medical treatment, the average life expectancy has increased. Considering the high prevalence of mortality and disability in men after fractures, early diagnosis and prevention of OP are crucial to future medication.5
BMD measurement by dual-energy X-ray absorptiometry (DXA) is the current gold standard for diagnosing OP. According to the World Health Organization (WHO), OP is defined as a BMD value of <2.5 SD below the mean value at any site of the lumbar spine (L1–L4), femoral neck, or total hip.6 Currently, there is no uniform standard for diagnosis of OP in men; however, a previous study has found that BMD at the lumbar spine site declines with age in women, but it is not applicable to men.7 Therefore, some scholars hold the opinion that the femoral neck can reflect the BMD of men more precisely. Although BMD measurement is expensive and invasive, some guidelines recommend that men at high risk of OP (aged ≥70 years or men aged 50–69 years with risk factors) are supposed to undergo BMD test by central DXA.8 Owing to the huge population of People’s Republic of China, there would be a large financial burden caused by OP. Hence, it is necessary to obtain a better way to predict OP in People’s Republic of China. Various OP screening tools have been developed by multiple organizations, such as the Fracture Risk Assessment Tool (FRAX), Osteoporosis Self-assessment Tool for Asians (OSTA), and weight-based criterion.
The WHO suggests FRAX as a tool to predict 10-year probabilities of hip fractures (HF) and major osteoporotic fractures (MOF) according to individual’s clinical risk factor information with or without BMD measurement.9 FRAX without BMD is not only a method to predict osteoporotic fractures but also an effective tool to evaluate OP. Although FRAX still cannot replace BMD in guiding treatment recommendations, it affects the clinical treatment for anti-OP. FRAX without BMD is able to reduce the unnecessary BMD testing, it can also advise individuals at high risk for OP to receive medical care.10 However, most of the studies aim at postmenopausal women, few studies have been conducted to define the threshold of OP in men.11
The Osteoporosis Self-Assessment Screening Tool (OST) and the Osteoporosis Self-Assessment Tool for Asians (OSTA) are simple and effective screening tools for identifying OP in men and postmenopausal women.12–14 Although OSTA includes only two factors (age and weight), some validation studies show that OSTA is more effective when compared to other complicated tools.15 Some researchers have also proved that OSTA is a useful tool for diagnosing OP in elderly Beijing men, especially at the femoral neck site.16
Body mass index (BMI) has been used to assess obesity and health in individuals with an international standard. Some studies show that BMI is related to osteoporotic fracture risk. The results of previous study suggest that women aged <60 years with low BMI (<20 kg/m2) should go for a DXA.17 Overall, many studies show that BMI and BMD have a certain correlation in postmenopausal women.18 However, whether BMI can be a very-effective tool for predicting OP in elderly male population remains to be confirmed.
Hence, the goal of this study is to compare the validation of FRAX without BMD, OSTA, and BMI in predicting primary OP and to find suitable thresholds to omit BMD testing reasonably in a community-dwelling elderly male population in Beijing.
Patients and methods
The study was approved by the ethics committee of Beijing Friendship Hospital, Capital Medical University. All subjects provided signed informed consent to participate in this study. The flow diagram of the study is shown in Figure 1.
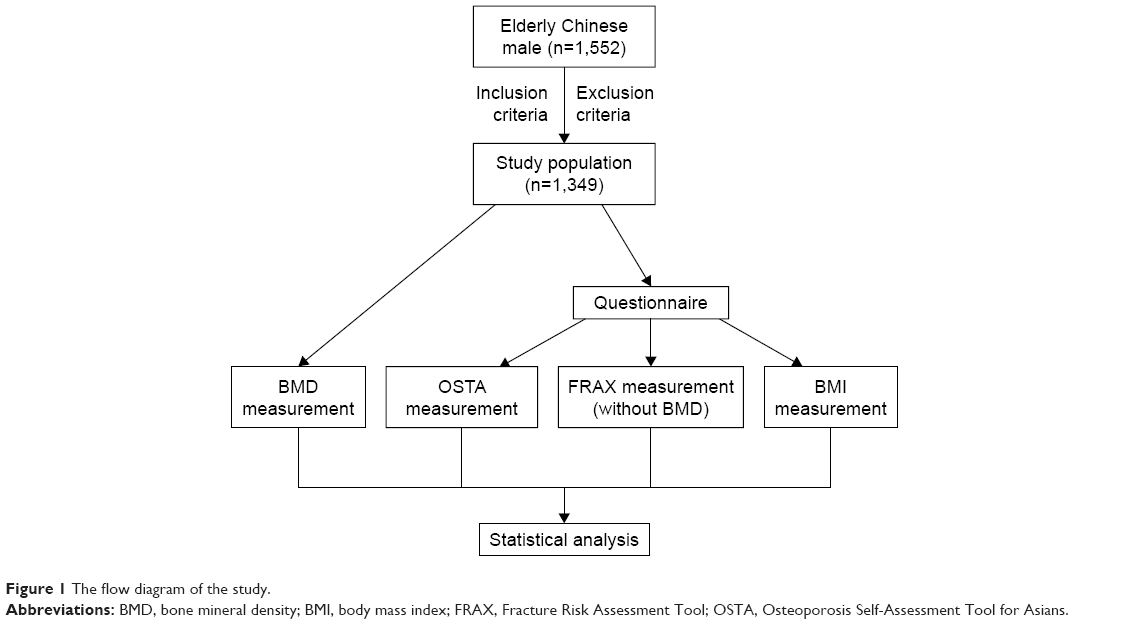 | Figure 1 The flow diagram of the study. |
Study design
It is a cross-sectional study and the study population included Chinese men aged ≥50 years consecutively recruited from three community health service centers (Fangzhuang, Tuanjiehu, and Wangzuo) from January 2014 to October 2015. The main inclusion and exclusion criteria are listed in Table 1. The subjects had never been diagnosed with OP before.
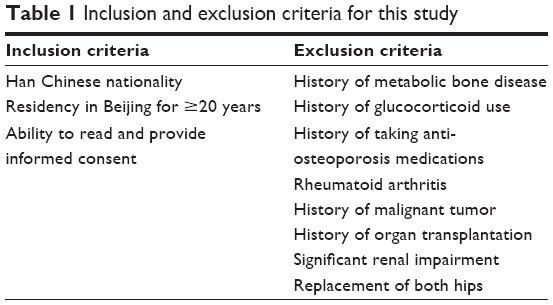 | Table 1 Inclusion and exclusion criteria for this study |
BMD measurements and data obtained via questionnaire
All the subjects were selected by stratified random sampling according to age proportion collected from three different communities. Each participant was required to complete a questionnaire including personal information and clinical risk factors for OP such as age, weight, BMI, previous fracture, current smoking, alcoholic drinks per day, parent fractured hip history, and so on. Weight was measured using an electronic balance (Tanita, Tokyo, Japan), and height was measured with a stadiometer (Mahr GmbH, Gottingen, Germany). The database established was checked by two researchers (XiaoDong Zhang and JiSheng Lin) to ensure the quality of data and control the total amount of data input per day and then checked by the senior researcher (Yong Yang). DXA (Discovery Wi, QDR Series; Hologic, Waltham, MA, USA) was used to measure the BMD of the femur (the femoral neck and total hip) and lumbar spine (L1–L4). To standardize measurements, all DXA measurements were conducted by a well-trained and qualified technician. The weight, height and BMD were measured with the same equipment throughout the study. The DXA machine was calibrated by the same technician every day by using the lumbar module. Osteoporosis was defined as a T-score (lumbar spine, femoral neck, total hip, and worst hip [femoral neck and total hip], the WHO [any site]) of −2.5 SD or lower.
OSTA score
The OSTA score was calculated based on weight and age put forward in 2001:12
|

The decimal digits of the calculation results were then disregarded. For example, a 70-year-old man weighing 54 kg would have an OSTA index of −3.
FRAX score
FRAX was a screening tool suggested by Kanis to predict 10-year probability of MOF and HF according to individual’s clinical risk factor information with or without BMD measurement.19 Because this study mainly focused on the ability of the FRAX tool to identify primary OP in men, the data were obtained without the BMD measurement.
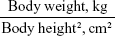
BMI
The BMI was calculated based on weight and height using the following formula:
|
Statistical analysis
The performance of tests (FRAX without BMD, OSTA, and BMI) for predicting OP at the lumber spine, total hip, femoral neck, worst hip (femoral neck and total hip), and at any site was compared. The receiver operating characteristic (ROC) curve was constructed, and the area under the ROC curve (AUC) and its 95% confidence interval (CI) were estimated using SPSS Version 17.0 (SPSS Inc., Chicago, IL, USA) and MedCalc version 11.5.0.0 (MedCalc Software, Ostend, Belgium). The predictive value of the three tools was determined according to the AUC as follows: perfectly predictive, AUC =1; highly predictive, 0.9≤ AUC <1; moderately predictive, 0.7≤ AUC <0.9; less predictive, 0.5≤ AUC <0.7; and non-predictive, AUC <0.5.20 The independent-samples t-test and one-way analysis of variance were used for single-factor analysis. The initial data were recorded in a Microsoft Excel spreadsheet, and the analysis was performed using SPSS Version 21 (IBM Corporation, Armonk, NY, USA) software. A p-value of <0.05 was considered statistically significant.
We identified the optimal thresholds with the results of AUC to maximize the diagnostic benefit and obtain the optimal OP missed value. Then, sensitivity, specificity, positive, and negative predictive values for each threshold were calculated and transformed into number of BMD measurements saved per 100 individuals (who would be candidates for screening) and the percentage of individuals with OP who would be missed.
Results
A total of 1,552 men aged 50 years or older completed the questionnaires and their BMD was measured; of whom, 1,349 individuals were selected according to the inclusion and exclusion criteria. The characteristics of the participants are shown in Table 2.
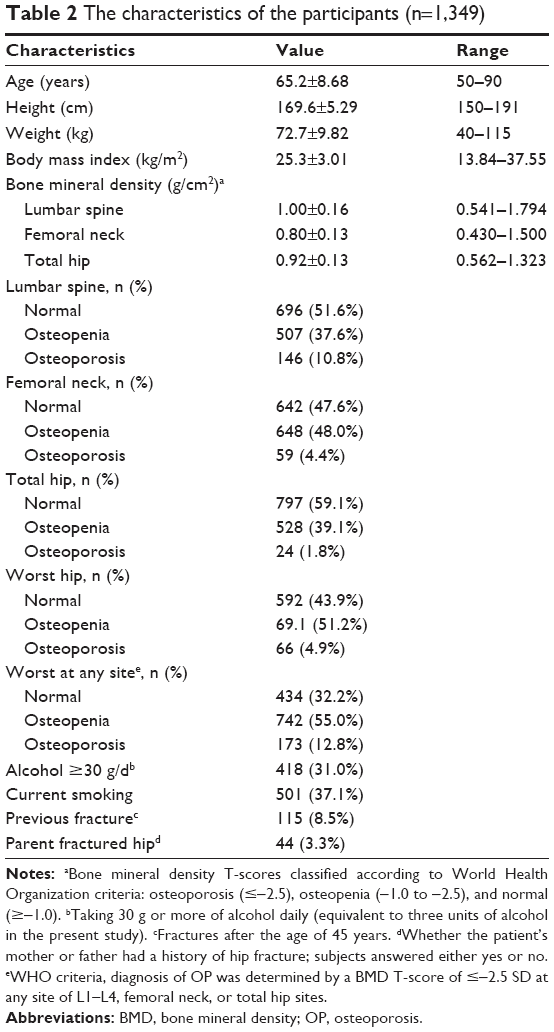 | Table 2 The characteristics of the participants (n=1,349) |
The prevalence rates of OP according to the WHO, lumbar spine, worst hip, femoral neck, and total hip criteria were 12.8%, 10.8%, 4.4%, 4.9%, and 1.8%, respectively. The results showed that the relationship between age and OP was significantly different (p<0.05) among total hip, femoral neck, and worst hip criteria, but there were no significant differences (p>0.05) between the lumbar spine and the WHO criteria.
ROC curve outcomes
A summary of the cutoff values and AUCs is listed in Table 3. The ROC curves for each tool were analyzed and various thresholds were assessed. AUC values of each diagnostic criteria are listed in Table 3. The AUC values of these tools for identifying OP ranged from 0.536 to 0.583 (MOF), 0.558 to 0.630 (HF), 0.722 to 0.874 (OSTA), and 0.801 to 0.880 (BMI). According to the total hip diagnostic criteria, OSTA and BMI obtained the highest AUC values (0.874 and 0.880) in this study. The results of the ROC curve and AUCs according to the worst hip criteria are described in Figure 2. Overall, predicting performance of BMI and OSTA was better than MOF and HF (FRAX without BMD), and BMI yielded the best predicted value.
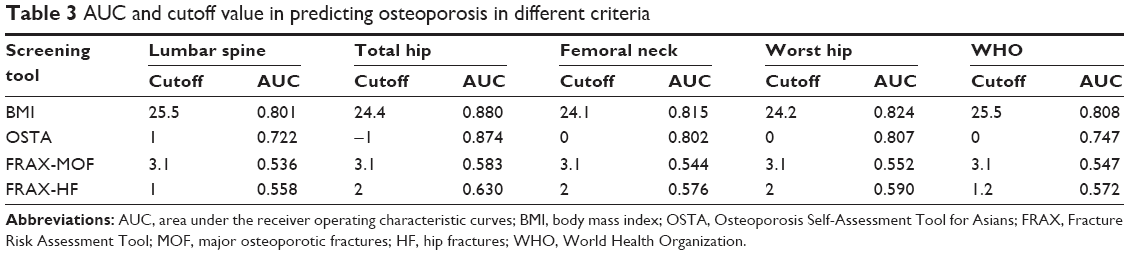 | Table 3 AUC and cutoff value in predicting osteoporosis in different criteria |
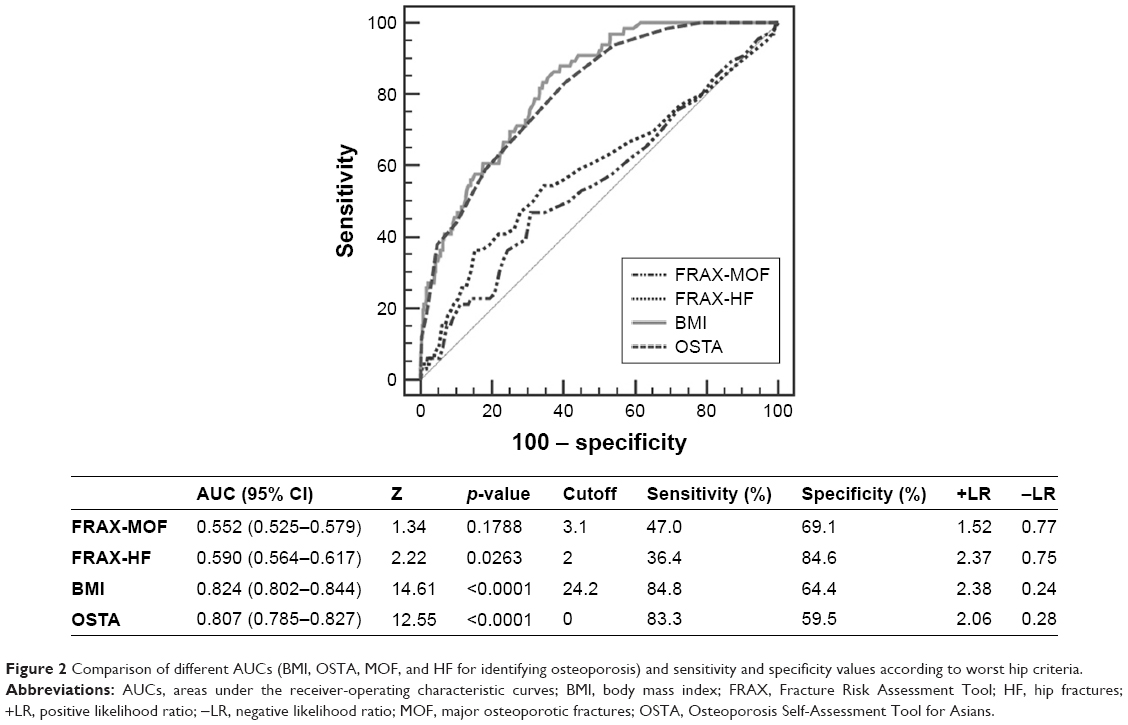 | Figure 2 Comparison of different AUCs (BMI, OSTA, MOF, and HF for identifying osteoporosis) and sensitivity and specificity values according to worst hip criteria. |
Lower thresholds results
In this study, the AUC performed best in the total hip diagnostic criterion. Considering the prevalence of OP was only 1.8% according to the total hip criterion, which could not reflect the real prevalence of OP, we set the cutoff value of the worst hip criterion as the optimal threshold. The low-risk thresholds were set at 2% for HF, 3.1% for MOF, 0 for OSTA, and 24.2 for BMI. Test performances at these thresholds are summarized in Table 4. As shown in Table 4, compared to the sensitivity and specificity of MOF and HF, BMI and OSTA performed better. In the worst hip criteria, BMI had the best predictive value yielding an AUC of 0.824, a sensitivity of 83.3%, a specificity of 59.5%, a negative predictive value of 98.6%, and percentage of missed OP of 0.8%.
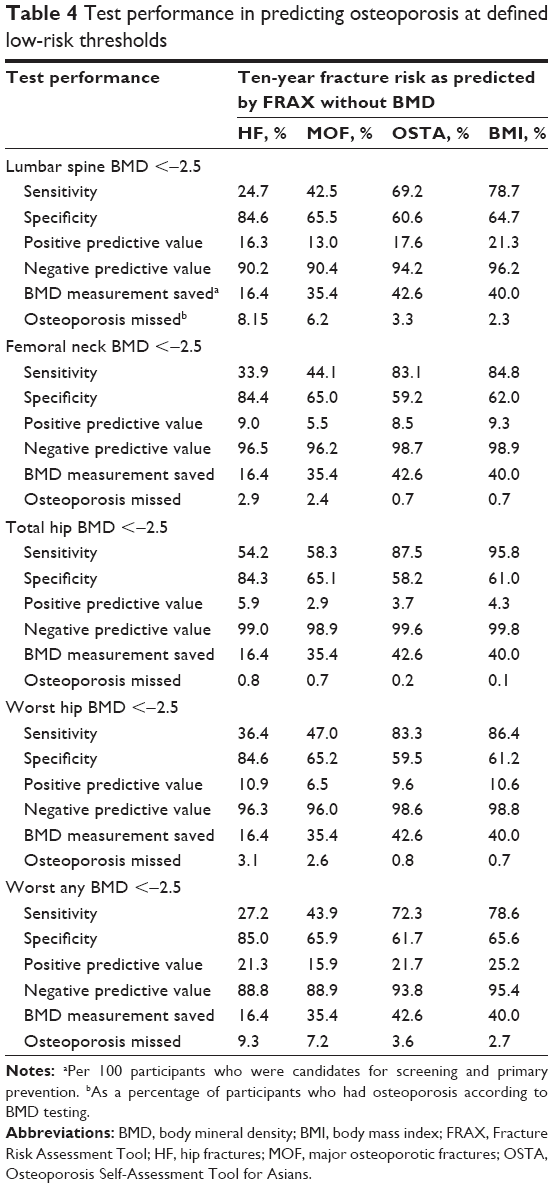 | Table 4 Test performance in predicting osteoporosis at defined low-risk thresholds |
Results of age groups
We divided the population into two subgroups based on age (50–65 years and 66–90 years), and the predictive values of three tools in worst hip criteria are listed in Table 5. The results showed significant differences in the prevalence of OP (p<0.05). According to the results, the AUC values of MOF and HF were fairly low, while BMI achieved good predictive value in both the age groups, 0.790 in 50–65 years and 0.829 in 66–90 years.
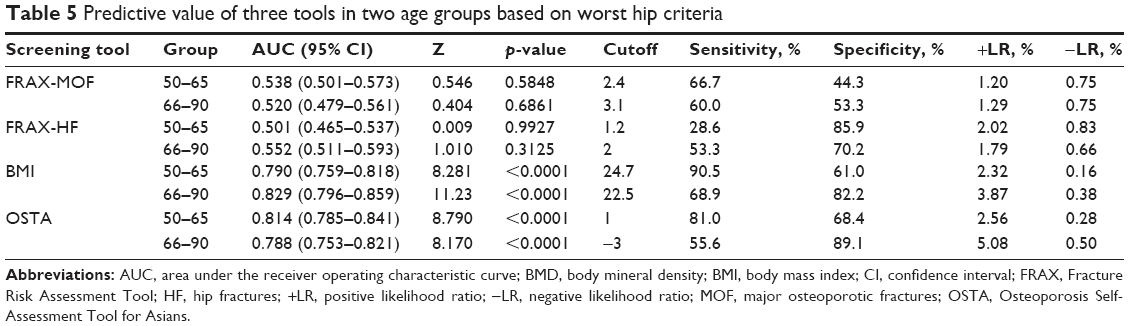 | Table 5 Predictive value of three tools in two age groups based on worst hip criteria |
Discussion
This study compared FRAX, OSTA, and BMI for predicting OP in Chinese men aged ≥50 years and defined the optimal thresholds so that unnecessary BMD measurement could be avoided as much as possible. Some previous studies have reported that the prevalence rate of OP was ~13%–21% in the developed countries, ~11.8% in Chinese men,21 and nearly 10 billion US dollars had been spent for osteoporotic fractures in 2010 in People’s Republic of China.22 OP was considered to be increasing with the age that was associated with the improvement of the average life expectancy. In the present study, the prevalence of OP ranged from 1.8% to 12.8% according to the different criteria. Among them, the prevalence of OP was 4.9% when worst hip was set as the diagnostic standard, basically consistent with the prevalence of femoral neck OP reported in men.23
There is no consistent standard of OP in men nowadays. Some previous studies have shown that BMD of the femoral neck is better than the lumbar spine to discriminate OP from normal, because calcification of the abdominal aorta and osteoarthritis of the spine can influence BMD at the lumbar spine site. Commonly, measurements by DXA at the femoral neck have the highest predictive value for HF, so some researchers suggest that the reference standard should be based on BMD measured at the femoral neck.7,24 The femoral neck is widely accepted because it has been proposed as the reference skeletal site for defining OP in epidemiologic studies.25 Although the bone loss of the femur is related to age, it is barely affected by heterotopic calcification or hyperplasia. In terms of consequences of OP, morbidity and financial burden are the main problems. For reducing the missed diagnosis rate of OP and eliminating the financial burden as much as possible, attempts were made to reduce the number of missed OP and increase the BMD measurement saved results (Table 4). However, considering the lowest prevalence of OP (1.8%) in total hip criteria, worst hip was selected as the final diagnostic criterion, and the results showed that the prevalence of OP was 4.9%, similar to that reported by the National Health and Nutrition Examination Survey.26
FRAX without BMD is of more limited predictive value for OP in men than in postmenopausal women. According to the results, FRAX without BMD, which had suboptimal sensitivity and an AUC ranging from 0.536 to 0.630, performed worst in all the tools diagnosed by different criteria. Although OSTA and BMI were much simpler, which are involved in only two risk factors, compared to FRAX with >10 risk factors, they performed better than FRAX without BMD in each criterion. These results show that FRAX was primarily developed for predicting 10-year probability of fracture instead of OP and was not an established method for diagnosing OP in men, although it had been reported that FRAX without BMD might be an effective tool in screening for OP.27 Kanis et al28 previously reported that FRAX without BMD might be used to discriminate patients with low BMD, and 10% and 20% probability of a major fracture correspond to −1.5 SD and −2.8 SD, respectively. Therefore, whether FRAX could be used as a screening tool for predicting OP in men was unconfirmed.
This study suggested that with a cost of missing 0.1%–3.6% OP patients, BMI and OSTA could reduce 40.0%–42.6% of participants in BMD screening tests. Based on horizontal comparison of various diagnostic criteria, sensitivity, OP missed, and BMD measurement saved for BMI were significantly better when the worst hip was set as the diagnostic criteria. In this criterion there were no statistical differences of the AUC between BMI (0.824) and OSTA (0.804) for predicting OP (p=0.41) and both yielded good assessment ability. The results were consistent with the study purpose that elderly males should receive appropriate treatment (age ≤65 years with BMI <24.7 or age >65 years with BMI <22.5).
OSTA was developed to assess multiple clinical risk factors associated with bone loss and OP for postmenopausal Asian women. In many studies, the OSTA was a well-performed tool for predicting OP in postmenopausal women.29 In this study, the sensitivity of OSTA for estimating OP in men was acceptable (83.3%) missing only 0.8% OP participants, and negative prediction (98.6%) was high in the worst hip criteria. The results were similar to the previous study that OSTA index might be an effective tool for primary OP (femoral neck site by DXA) in elderly males. It was worth mentioning that the prevalence rate of OP in men was not related to age, which was different with previous studies about postmenopausal women.11,26,30 Steuart et al designed a study that involved 518 elderly males to evaluate OST in identifying OP and found that an OST index of 6 or lower yielded the AUC of 0.67, a sensitivity of 82.6%, and a specificity of 33.6%, which was similar to this study.31 OSTA was a screening tool for OP associated with age and weight, and this study suggested that age was a clinical risk factor of OP in elderly males according to worst hip criteria, whereas it had a limiting value in the WHO criteria. Thus, further studies on the value of OSTA for identifying OP in the elderly male population remain to be performed.
Many studies have shown that BMI is a protective factor in the occurrence and development of OP and have also proved that BMI not only reduces the incidence of OP but also provides reference for prevention and early diagnosis of OP.17,18,32 It is accepted that high BMI can reduce bone reabsorption and stimulate bone formation. In this study, the AUCs of BMI in different criteria (lumbar spine, 0.801; femoral neck, 0.815; total hip, 0.880; worst hip, 0.824, and WHO, 0.808) performed the best. BMI was the optimal tool for estimating OP in all of these tools. In the worst hip criteria, the sensitivity and specificity were 84.8% and 64.4%, respectively. High sensitivity was more significant than specificity to reduce missed diagnosis. It is not necessary that a risk assessment tool has both high sensitivity and high specificity if the tool is free and noninvasive. The primary purpose of a screening tool is to identify most patients at risk, among which BMD can be used to obtain a definite diagnosis. It is generally believed that BMI is a protective factor in men. The increased muscle mass can reduce bone loss and the skeletal muscle loss will lead to a decrease in BMD. Muscle atrophy and muscle dysfunction can promote the loss of bone mass and degradation of bone strength. In some studies, BMD at the lumbar spine and hip sites and BMI are closely related, and BMI >30 kg/m2 delays the incidence of osteopenia by 5 years (at the spine) and 9 years (at the femoral neck).33,34 Results in a recent study of US older adults show a protective, cross-sectional association between BMI and OP, which is consistent with our results.35 However, few studies have focused on the association between elderly male OP and BMI, further investigation should be performed on a larger scale.
The strengths of this study include the following: it is a cross-sectional study, not retrospective; the subjects were healthy elderly males; questionnaire data were collected from three different community health service centers; BMD measurements were taken by the same operator and machine; strict inclusion and exclusion criteria to exclude the effects of other factors were imposed; and the results have certain reference value for OP diagnosis, help physicians in primary hospitals or community health service centers to discover OP population and reduce misdiagnosis rate.
However, the demographic of the study may be different from the actual demographic profile of Beijing. BMD could only reflect ~70% of bone strength; hence, it is not the best examination method for bone quality in clinic. Causal correlations should not be assessed based upon cross-sectional data, regardless of the sample size and accuracy. Whether the subjects will suffer from fractures years later is unconfirmed, and it needs long-term follow-up. It will be a significant evidence for FRAX in predicting 10-year fracture risk.
Conclusion
The validation of three clinical tools in predicting primary OP was compared and found suitable thresholds to omit BMD testing. The results showed that BMI and OSTA performed better than FRAX without BMD, and BMI was the most valuable tool for identifying primary OP in men. To benefit in terms of cost and reduction of unnecessary radiation exposure, we suggest men aged >65 years with BMI <22.5 kg/m2 or <65 years with BMI >24.7 kg/m2 should have a BMD screening test.
Acknowledgment
The study was funded by the Capital Health Project (Z131100006813040), Beijing, People’s Republic of China.
Disclosure
The authors report no conflicts of interest in this work.
References
Cummings SR, Melton LJ. Epidemiology and outcomes of osteoporotic fractures. Lancet. 2002;359(9319):1761–1767. | ||
Inderjeeth C, Smeath A. Bones beyond 70-insights into osteoporosis management in the elderly. Aust Fam Physician. 2010;39(10):767–772. | ||
Drake MT, Murad MH, Mauck KF, et al. Clinical review. Risk factors for low bone mass-related fractures in men: a systematic review and meta-analysis. J Clin Endocrinol Metab. 2012;97(6):1861–1870. | ||
Melton LR, Khosla S, Achenbach SJ, O’Connor MK, O’Fallon WM, Riggs BL. Effects of body size and skeletal site on the estimated prevalence of osteoporosis in women and men. Osteoporos Int. 2000;11(11):977–983. | ||
Haentjens P, Magaziner J, Colon-Emeric CS, et al. Meta-analysis: excess mortality after hip fracture among older women and men. Ann Intern Med. 2010;152(6):380–390. | ||
Kanis JA. Assessment of fracture risk and its application to screening for postmenopausal osteoporosis: synopsis of a WHO report. WHO Study Group. Osteoporos Int. 1994;4(6):368–381. | ||
Looker AC, Melton LR, Borrud LG, Shepherd JA. Lumbar spine bone mineral density in US adults: demographic patterns and relationship with femur neck skeletal status. Osteoporos Int. 2012;23(4):1351–1360. | ||
Watts NB, Adler RA, Bilezikian JP, et al; Endocrine Society. Osteoporosis in men: an Endocrine Society clinical practice guideline. J Clin Endocrinol Metab. 2012;97(6):1802–1822. | ||
Kanis JA, Oden A, Johnell O, et al. The use of clinical risk factors enhances the performance of BMD in the prediction of hip and osteoporotic fractures in men and women. Osteoporos Int. 2007;18(8):1033–1046. | ||
Chao AS, Chen FP, Lin YC, Huang TS, Fan CM, Yu YW. Application of the World Health Organization fracture risk assessment tool to predict need for dual-energy X-ray absorptiometry scanning in postmenopausal women. Taiwan J Obstet Gynecol. 2015;54(6):722–725. | ||
Kanis JA, McCloskey EV, Harvey NC, Johansson H, Leslie WD. Intervention thresholds and the diagnosis of osteoporosis. J Bone Miner Res. 2015;30(10):1747–1753. | ||
Koh LK, Sedrine WB, Torralba TP, et al; Osteoporosis Self-Assessment Tool for Asians (OSTA) Research Group. A simple tool to identify Asian women at increased risk of osteoporosis. Osteoporos Int. 2001;12(8):699–705. | ||
Richy F, Gourlay M, Ross PD, et al. Validation and comparative evaluation of the osteoporosis self-assessment tool (OST) in a Caucasian population from Belgium. QJM. 2004;97(1):39–46. | ||
Adler RA, Tran MT, Petkov VI. Performance of the osteoporosis self-assessment screening tool for osteoporosis in American men. Mayo Clin Proc. 2003;78(6):723–727. | ||
Chen S, Chen Y, Cheng C, Hwang H, Chen C, Lin M. Comparisons of Different Screening Tools for Identifying Fracture/Osteoporosis Risk Among Community-Dwelling Older People. MEDICINE. 2016;95(20):e3415. | ||
Zha XY, Hu Y, Pang XN, Chang GL, Li L. Diagnostic value of osteoporosis self-assessment tool for Asians (OSTA) and quantitative bone ultrasound (QUS) in detecting high-risk populations for osteoporosis among elderly Chinese men. J Bone Miner Metab. 2015;33(2):230–238. | ||
Bergkvist D, Hekmat K, Svensson T, Dahlberg L. Obesity in orthopedic patients. Surg Obes Relat Dis. 2009;5(6):670–672. | ||
Saarelainen J, Kiviniemi V, Kroger H, et al. Body mass index and bone loss among postmenopausal women: the 10-year follow-up of the OSTPRE cohort. J Bone Miner Metab. 2012;30(2):208–216. | ||
Kanis JA, Johnell O, Oden A, Johansson H, McCloskey E. FRAX and the assessment of fracture probability in men and women from the UK. Osteoporos Int. 2008;19(4):385–397. | ||
Greiner M, Pfeiffer D, Smith RD. Principles and practical application of the receiver-operating characteristic analysis for diagnostic tests. Prev Vet Med. 2000;45(1–2):23–41. | ||
Li N, Ou P, Zhu H, Yang D, Zheng P. Prevalence rate of osteoporosis in the mid – aged and elderly in selected parts of China. Chin Med J (Engl). 2002;115(5):773–775. | ||
Si L, Winzenberg TM, Jiang Q, Chen M, Palmer AJ. Projection of osteoporosis-related fractures and costs in China: 2010–2050. Osteoporos Int. 2015;26(7):1929–1937. | ||
Looker AC, Melton LR, Harris TB, Borrud LG, Shepherd JA. Prevalence and trends in low femur bone density among older US adults: NHANES 2005–2006 compared with NHANES III. J Bone Miner Res. 2010;25(1):64–71. | ||
Johnell O, Kanis JA, Oden A, et al. Predictive value of BMD for hip and other fractures. J Bone Miner Res. 2005;20(7):1185–1194. | ||
Kanis JA, McCloskey EV, Johansson H, Oden A, Melton LR, Khaltaev N. A reference standard for the description of osteoporosis. Bone. 2008;42(3):467–475. | ||
Looker AC, Borrud LG, Dawson-Hughes B, Shepherd JA, Wright NC. Osteoporosis or low bone mass at the femur neck or lumbar spine in older adults: United States, 2005–2008. NCHS Data Brief. 2012;(93):1–8. | ||
Compston J, Bowring C, Cooper A, et al. Diagnosis and management of osteoporosis in postmenopausal women and older men in the UK: National Osteoporosis Guideline Group (NOGG) update 2013. Maturitas. 2013;75(4):392–396. | ||
Kanis JA, Harvey NC, Johansson H, Oden A, Leslie WD, McCloskey EV. FRAX and fracture prediction without bone mineral density. Climacteric. 2015;18(suppl 2):2–9. | ||
Rud B, Hilden J, Hyldstrup L, Hrobjartsson A. Performance of the osteoporosis self-assessment tool in ruling out low bone mineral density in postmenopausal women: a systematic review. Osteoporos Int. 2007;18(9):1177–1187. | ||
Ma Z, Yang Y, Lin J, et al. BFH-OST, a new predictive screening tool for identifying osteoporosis in postmenopausal Han Chinese women. Clin Interv Aging. 2016;11:1051–1059. | ||
Steuart RJ, Lazzari AA, Teves QD, Desale S, Howard R, Kerr GS. Validation of the osteoporosis self-assessment tool in US male veterans. J Clin Densitom. 2014;17(1):32–37. | ||
Lin J, Ma Z, Fei Q, et al. [Association of body mass index and male primary osteoporosis]. Zhonghua Yi Xue Za Zhi. 2014;94(33):2593–2596. Chinese. | ||
Soltani A, Larijani B, Khashayar P, Rezaei HM, Fakhari S. The relationship between anthropometric parameters and bone mineral density in an Iranian referral population. Acta Med Iran. 2014;52(7):505–510. | ||
Sadatsafavi M, Moayyeri A, Wang L, Leslie WD; Manitoba Bone Density Program. Heteroscedastic regression analysis of factors affecting BMD monitoring. J Bone Miner Res. 2008;23(11):1842–1849. | ||
Lloyd JT, Alley DE, Hawkes WG, Hochberg MC, Waldstein SR, Orwig DL. Body mass index is positively associated with bone mineral density in US older adults. Arch Osteoporos. 2014;9:175. |
 © 2018 The Author(s). This work is published and licensed by Dove Medical Press Limited. The
full terms of this license are available at https://www.dovepress.com/terms
and incorporate the Creative Commons Attribution
- Non Commercial (unported, 3.0) License.
By accessing the work you hereby accept the Terms. Non-commercial uses of the work are permitted
without any further permission from Dove Medical Press Limited, provided the work is properly
attributed. For permission for commercial use of this work, please see paragraphs 4.2 and 5 of our Terms.
© 2018 The Author(s). This work is published and licensed by Dove Medical Press Limited. The
full terms of this license are available at https://www.dovepress.com/terms
and incorporate the Creative Commons Attribution
- Non Commercial (unported, 3.0) License.
By accessing the work you hereby accept the Terms. Non-commercial uses of the work are permitted
without any further permission from Dove Medical Press Limited, provided the work is properly
attributed. For permission for commercial use of this work, please see paragraphs 4.2 and 5 of our Terms.