Back to Journals » Clinical Ophthalmology » Volume 15
Comparison of the Structure and Function of the Retina and the Optic Nerve in Patients with a History of Multiple Sclerosis-Related Demyelinating Retrobulbar Optic Neuritis Treated and Not Treated with Systemic Steroid Therapy
Authors Nowacka B ![]() , Lubiński W
, Lubiński W ![]()
Received 29 March 2021
Accepted for publication 4 May 2021
Published 1 June 2021 Volume 2021:15 Pages 2253—2261
DOI https://doi.org/10.2147/OPTH.S309975
Checked for plagiarism Yes
Review by Single anonymous peer review
Peer reviewer comments 2
Editor who approved publication: Dr Scott Fraser
Barbara Nowacka, Wojciech Lubiński
2nd Department of Ophthalmology, Pomeranian Medical University, Szczecin, Poland
Correspondence: Wojciech Lubiński
2nd Department of Ophthalmology, Pomeranian Medical University, Powstańców Wlkp. 72, Szczecin, 70-111, Poland
Tel +48 91 466 12 93
Email [email protected]
Purpose: To compare the structure and function of the retina and the optic nerve in patients with a history of multiple sclerosis (MS)-related demyelinating retrobulbar optic neuritis treated and not treated with systemic steroid therapy.
Patients and Methods: Thirty-two eyes of 32 MS patients with a past single episode of MS-related demyelinating retrobulbar ON were divided into 2 groups: S(+) consisting of 16 patients treated with intravenous methylprednisolone at a dose of 1g/day for 3 days during the acute stage of ON and S(-) consisting of 16 patients who did not receive any treatment. The following examinations were performed: distance best-corrected visual acuity (DBCVA) (Snellen), slit-lamp examination of the anterior and posterior segment of the eye (90D Volk lens), visual field analysis (Carl Zeiss Humphrey 750 Visual Field Analyzer, 24-2, W-W), macular thickness in the foveal (RT1) and parafoveal region (RT2), as well as peripapillary retinal nerve fiber layer thickness (RNFL) in the temporal, superior, nasal and inferior quadrants (Carl Zeiss Cirrus HD-OCT), assessment of the bioelectrical function of the visual pathway with an emphasis on the optic nerve – pattern visual evoked potentials (PVEP) and of macular ganglion cells and cone photoreceptors – pattern electroretinogram (PERG) (Roland Consult).
Results: No statistically significant differences were observed between the investigated groups in terms of DBCVA, mean deviation of visual field macular (RT1, RT2) and RNFL thickness in the temporal, superior, nasal and inferior quadrants, as well as of the bioelectrical function (PVEP, PERG).
Conclusion: The application of steroid therapy should be considered on an individual basis and not as a routine treatment for each patient.
Keywords: demyelinating optic neuritis, multiple sclerosis, steroids, perimetry, OCT, PERG, PVEP
Introduction
Demyelinating retrobulbar optic neuritis (ON) is an inflammatory condition that typically causes acute unilateral vision loss, relative afferent pupillary defect and pain with eye movement, with normal fundus examination. It is closely linked to multiple sclerosis (MS) and may be the first manifestation of this systemic disease. The pathogenesis of MS-related demyelinating ON is not well understood. It is probably caused by delayed type IV hypersensitivity reaction induced by activated peripheral T-cells which release cytokines and other inflammatory mediators.1,2 Permanent visual deficit in demyelinating ON is a result of axonal loss in the optic nerve and retina and a conduction block caused by the demyelination of the optic nerve.3,4 Initially, the result of the Optic Neuritis Treatment Trial (ONTT) showed that the final values of visual acuity and visual field recovery do not dependent on steroid treatment; however, intravenous methylprednisolone administration (1 g per day for 3 days), followed by oral prednisone (1 mg per kilogram per day for 11 days) improves the speed of recovery.5,6 Oral prednisone alone was an ineffective treatment and increased the risk of new episodes of optic neuritis.6 The effectiveness of steroids in the treatment of MS-related demyelinating ON was investigated in later studies. The results were concluded in the meta-analysis demonstrating that the comparison of treatment with intravenous methylprednisolone alone and placebo revealed no superiority in terms of visual acuity and contrast sensitivity at six months and at one year.7 Currently, treatment with 1 g intravenous methylprednisolone for 3 days is recommended only to patients with severe or bilateral vision loss to increase the speed of visual recovery, or to patients with two or more white matter lesions on magnetic resonance imaging (MRI) in order to reduce the risk of conversion to MS within the first two years.6–8 However, many ophthalmologists and neurologists still routinely treat MS-related demyelinating ON with intravenous methylprednisolone. As treatment with steroids is not free from side effects (most common include mood changes, facial flushing, sleep disturbances, weight gain, dyspepsia),6 we decided to compare long-term visual, structural and bioelectrical outcome from the retina and the optic nerve in patients with a history of MS-related demyelinating retrobulbar ON treated and not treated with intravenous steroid therapy in the acute phase. To the best of our knowledge, this is the first study that provides a comparison of multiple parameters such as best-corrected visual acuity, perimetry, optical coherence tomography and electrophysiological test results in these patients.
Patients and Methods
A retrospective analysis of data from our neuro-ophthalmological outpatient clinic from 32 eyes of 32 MS patients with a past single episode of demyelinating retrobulbar ON was performed. The diagnosis of MS was made in neurology department based on actual (for the time of examination) McDonald criteria. Additional diagnostic tests were performed as needed, including the examination of cerebrospinal fluid, AQP4 and MOG antibodies. The patients were referred to our clinic for follow-up from neurological and other ophthalmological clinics. The subjects were divided into 2 groups: the S(+) group consisted of 16 patients (4 males, 12 females) aged 34.4±9.2 years, treated with intravenous methylprednisolone at a dose of 1g/day for 3 days during the acute stage of ON and the S(-) group consisted of 16 patients (1 male, 15 females) aged 37.1±12.1 years who did not receive any treatment. The time between ON and the examination was almost the same in both groups and equal to 5.4±7.8 years in the S(+) group and 5.5±7.6 years in the S(-) group. All participants had had an established diagnosis of MS for 5.3±6.0 years in the S(+) group and 5.2±5.0 years in the S(-) group based on clinical features and white matter lesions in MRI. For the evaluation of the structure and function of the retina and the optic nerve in each eye enrolled in the study, the following examinations were performed: distance best-corrected visual acuity (DBCVA) (Snellen), slit-lamp examination of the anterior and posterior segment of the eye (90D Volk lens), visual field analysis (Carl Zeiss Humphrey 750 Visual Field Analyzer, 24–2, W-W), macular thickness in the foveal (RT1) and parafoveal region (RT2), as well as peripapillary retinal nerve fiber layer thickness (RNFL) in the temporal, superior, nasal and inferior quadrants (Carl Zeiss Cirrus HD-OCT), assessment of the bioelectrical function of the visual pathway with an emphasis on the optic nerve – pattern visual evoked potentials (PVEP) and of the macular ganglion cells and cone photoreceptors – pattern electroretinogram (PERG) (Roland Consult). The PVEP and PERG parameters were according to the current standards of International Society for Clinical Electrophysiology of Vision (ISCEV).9
For pattern visual evoked potentials (PVEP), monocular stimulation with central fixation was used without pupil dilation. The appropriate refraction correction was applied for a distance of 1 meter. The electrodes used for recordings: an active gold disk electrode placed on the scalp over the visual cortex at Oz, a reference gold disc electrode placed at Fz, and a ground gold disc electrode at Fpz on the forehead. The acceptable electrode impedance: <5 kΩ. Stimulus parameters: black and white reversing checkerboard with two check sizes equal to 0°16′ and 1°4′, with the luminance of the white elements of 120 cd/m2, and the contrast between black and white squares of 97%. Parameters of the recording system: amplifier range: ±100 μV/div; filters: 1–100 Hz; sweep time: 300ms, and artifact rejection threshold: 95%. Two trials of 100 artifact-free sweeps for each check size were obtained and averaged off-line. The analysis included the amplitude and the latency of the P100 wave.
For pattern electroretinogram (PERG), monocular stimulation with central fixation was used without pupil dilation. The appropriate refraction correction was applied for a distance of 0.5 meters. The electrodes used for recordings: an active DTL thread electrode positioned above the upper margin of the lower eyelid in contact with the cornea, a reference gold disc electrode placed on the skin near the ipsilateral outer canthus of the examined eye, and a ground gold disc electrode placed on the forehead (Fpz). Acceptable electrode impedance: <5 kΩ. Stimulus parameters: black and white reversing checkerboard of 1° check size, with the luminance of the white elements of 120 cd/m2, and the contrast between black and white squares of 97%. Parameters of the recording system: amplifier sensitivity: 20µV/div; filters: 1–100 Hz; notch filters: off; sweep time: 250ms (time base: 25 ms/div); and artifact rejection threshold: 95% (for the amplifier range of ±100µV). Two trials of 100 artifact-free sweeps were obtained and averaged off-line. The analysis included the amplitude and the peak time of the P50 wave and the amplitude of the N95 wave.
The Shapiro–Wilk test was used to evaluate the normality of the distribution of the analyzed parameters. Except for the distance best-corrected visual acuity (DBCVA), all analyzed parameters were consistent with a normal distribution. The comparison of parameters between groups was performed using Student’s t-test for normally distributed or the Mann–Whitney U-test for non-normally distributed data. The results were considered statistically significant at p <0.05. Data are presented as mean ± standard deviation (SD).
The Ethics Committee of the Pomeranian Medical University approved the project. The study conformed to the tenets of the Declaration of Helsinki in all respects. All patients have provided written informed consent for the medical history data analysis and case details to be published. All patients data ware covered confidentiality.
Results
Distance Best-Corrected Visual Acuity
The mean DBCVA was equal to 0.99±0.03 (Snellen) in the S(+) group and did not differ significantly from 0.91±0.25 obtained in the S(-) group (p=0.50). In the S(+) group, all except one patient – 15/16 (93.8%) had full (1.0 in Snellen) DBCVA, while in the S(-) group, full DBCVA was observed for only one person less – 14/16 (87.5%).
Perimetry
The mean deviation (MD), which gives overall information on the total amount of visual field loss, was equal to −1,57±0.9 dB in the S(+) group and −1,99±2.1 dB in the S(-) group. These results did not differ significantly between the investigated groups (p=0.52) and the mean values were within normal limits which typically are described from 0 dB to −2 dB.
Optical Coherence Tomography
Retinal thickness at the foveal and the parafoveal regions did not differ significantly between the investigated groups and was equal, respectively, to RT1: S(+) 249.9±22.7 µm vs S(-) 241.8±12.2 µm (p=0.23); RT2: S(+) 298.9±21.2 µm vs S(-) 293.5±12.8 µm (p=0.39). In both groups, mean values were within the normal limits described in the manual for the Cirrus HD-OCT: RT1: 220.5–294.8 µm, RT2: 292.4–341.9 µm. Also, no statistically significant changes between the S(+) and the S(-) group were found in RNFL thickness: RNFL-T: S(+) 52.5±14.4 µm vs S(-) 47.1±9.7 µm (p=0.22); RNFL-S: S(+) 93.3±11.1 µm vs S(-) 97.5±9.7 µm (p=0.75); RNFL-N: S(+) 63.4±7.0 µm vs S(-) 66.4±9.1 µm (p=0.31); RNFL-I: S(+) 103.6±17.8 µm vs S(-) 100.3±14.6 µm (p=0.57); As for macular thickness, in both groups mean RNFL thickness was within normal values described in the manual for the Cirrus HD-OCT: RNFL-T: 45.1–82.2 µm; RNFL-S: 88.9–136.7 µm; RNFL-N: 50.0–86.2 µm; RNFL-I: 89.4–138.3 µm. The comparison of RT and RNFL thickness between the investigated groups is presented in Figure 1.
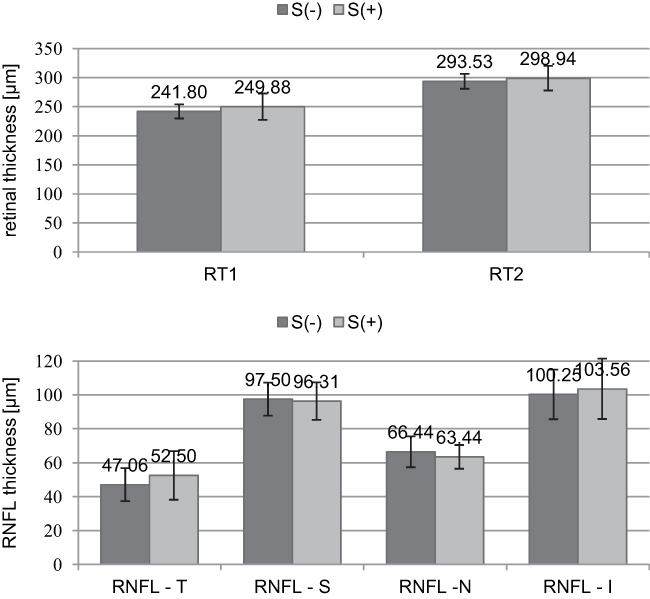 |
Figure 1 The comparison of the retinal thickness in the fovea (RT1) and parafoveal region (RT2), as well as of the retinal nerve fiber layer thickness in the temporal, superior, nasal and inferior quadrant (RNFL-T, RNFL-S, RNFL-N, RNFL-I) between group S(-) and S(+). Note: The differences were statistically insignificant (p>0.05). |
Pattern Visual Evoked Potentials
In both investigated groups, mean P100 amplitudes (A) were similar regardless of stimulation check size: 1°4ʹ: S(+) 7.4±4.2 µV vs S(-) 7.4±3.8 µV (p=0.99) and 0°16ʹ: S(+) 6.5±3.4 µV vs S(-) 6.3±3.7 µV (p=0.89). In the S(+) group, mean P100 latencies (L) were a little prolonged in comparison to the S(-) group but did not achieve the level of statistical significance. The results of LP100 were as follows: 1°4ʹ: S(+) 139.5±27.9 ms vs S(-) 127.3±18.7 ms (p=0.17) and 0°16ʹ: S(+) 143.1±19.0 ms vs S(-) 135.3±20.6 ms (p=0.31). The mean AP100 obtained in both groups were within normal limits of our laboratory, while latencies were markedly delayed (norms: 1°4ʹ AP100: 3.4–28.2 µV, 0°16ʹ AP100: 5.9–28.1 µV, 1°4ʹ LP100: 93.5–113.9 ms, 0°16ʹ LP100: 100.4–116.8 ms). The percentage of abnormal AP100 in comparison to the norms were as follows: 15.4% in S(+) and 12.5% in S(-) for 1°4ʹ check size, while 38.5% in S(+) and 56.3% in S(-) for 0°16ʹ checkerboard. Most of the patients had prolonged LP100 in both groups, slightly more frequently in the S(+) group: 84.6% in S(+) and 75% in S(-) for 1°4ʹ check size, 100% in S(+) and 75% in S(-) for 0°16ʹ checkerboard. The results of PVEP examinations are summarized in Figure 2.
 |
Figure 2 The comparison of mean PVEP P100-wave amplitudes (A) and latencies (L) at the 1°04ʹ and 0°16ʹ checkerboard check size between group S(-) and S(+). Note: The differences were statistically insignificant (p>0.05). |
Pattern Electroretinogram
The mean AP50 and AN95 in the S(+) group were 4.6±1.4 µV and 6.6±2.7 µV, while in the S(-) group 5.5±1.8 µV and 8.15±2.3 µV, respectively. The mean P50 implicit times (IT) were almost the same in both groups and equaled 48.9±1.5 ms for the S(+) group and 49.1±3.5 ms for the S(-) group. The comparison of PERG results obtained from the S(+) and S(-) group did not reveal any statistically significant differences (for AP50: p=0.20, for AN95: p=0.14, for IT P50: p=0.83), although the S(+) group produced mean results of AP50 and AN95 below our laboratory norms: AP50: 5.3–17.9 µV, AN95: 7.5–23.2 µV, IT P50: 46.5–55.8 ms. The percentages of abnormal AP50 and AN95 in comparison to norms were higher in the S(+) group and for P50 equaled: 70% in the S(+) group and 40% in the S(-) group, for N95: 70% in the S(+) group and 46.7% in the S(-) group. Analysis of IT P50 revealed that none of the patients in the S(+) group and only one patient in the S(-) group achieved results prolonged in comparison to the norms. The results of PERG examinations are summarized in Figure 3.
 |
Figure 3 The comparison of mean PERG P50- and N95-wave amplitudes and P50-wave implicit times between group S(-) and S(+). Note: The differences were statistically insignificant (p>0.05). |
Case
Optic neuritis is an inflammatory condition of the optic nerve characterized by a sudden onset of unilateral visual loss and eye pain with a normal optic nerve appearance in the fundus examination, usually affecting young females. Demyelination associated with MS is the most common cause. Gadolinium contrast-enhanced magnetic MRI of the brain and orbits show hyperintense white matter abnormalities of the brain and contrast enhancement of the optic nerve. However, as ON may precede MS, MRI changes of the brain may not be present at the beginning. Visual evoked potentials have an important role in evaluating patients with suspected ON and often show a loss of P100 response in the acute phase, even when MRI of the brain and optic nerve is normal.
A healthy 24-year-old female patient was admitted to our outpatient clinic with the following symptoms in the left eye: blurred vision, dark spot in the center of the visual field, reduced saturation of red color and ocular pain with movement. Best-corrected visual acuity in the left eye equaled 0.8 (Snellen), while in the right eye 1.0. A relative afferent pupillary defect (RAPD) was observed in the left eye. The anterior and posterior segments of the eye were normal in ophthalmoscopy. At the baseline, additional tests revealed in the left-eye borderline macular thickness and decreased inferiorly RNFL thickness in OCT, prolonged and decreased P100 wave with normal PERG recordings. As no pathological changes in the white and gray matter of the brain were observed, steroid treatment was not implemented. Two years after the episode of demyelinating ON, MS was diagnosed on the basis of clinical symptoms and changes in MRI. At this point DBCVA was 1.0 in both eyes, RAPD was absent, the anterior and posterior segments of the eye were normal. A slight decrease in macular and RNFL thickness was observed, while PVEP recordings returned to normal values and PERG remained stable Figure 4 shows the results of OCT and electrophysiological recordings of this patient.
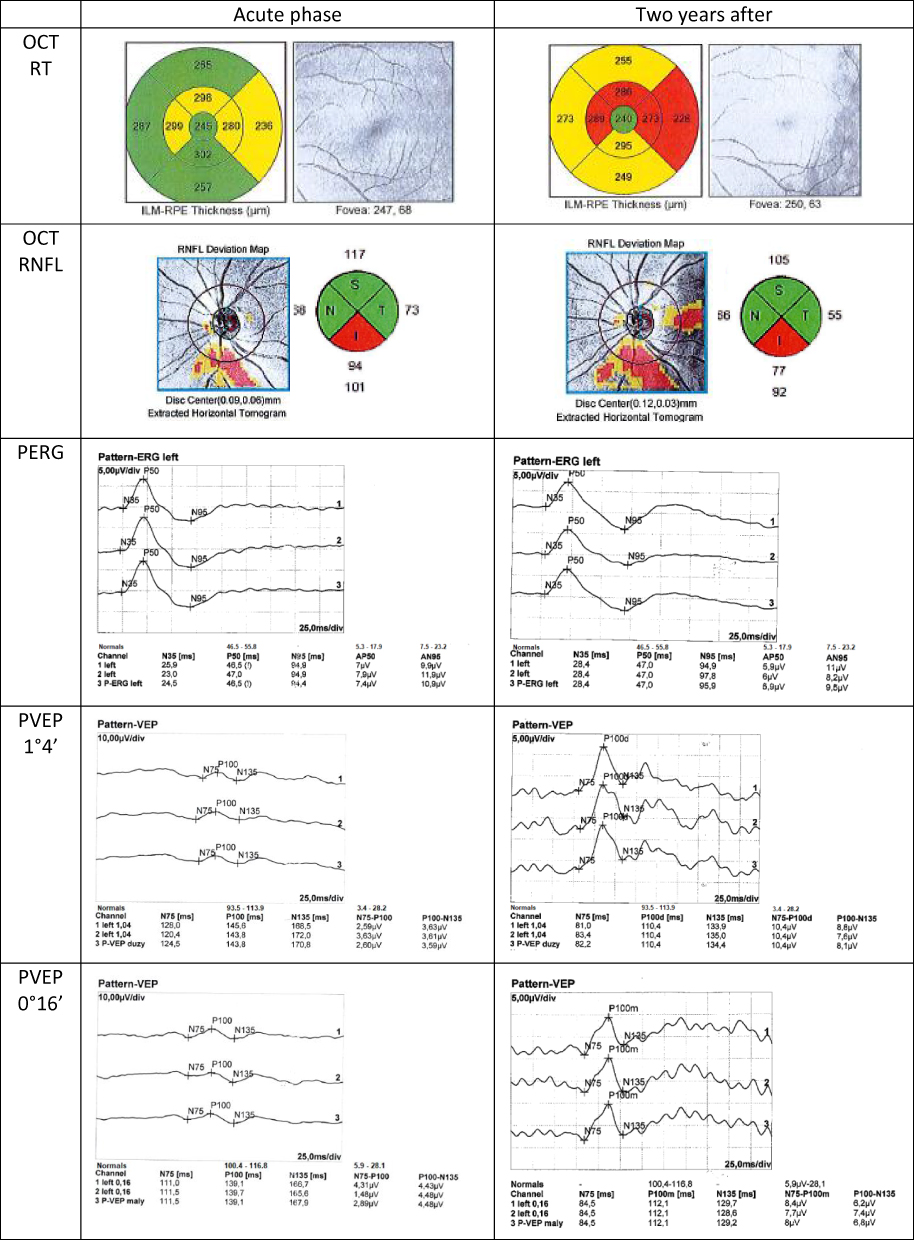 |
Figure 4 The results of macular (RT) and retinal nerve fiber layer (RNFL) thickness in optical coherence tomography (OCT), and pattern electroretinogram (PERG) and visual evoked potentials (PVEP) recordings from the patient’s left eye, with the history of not-treated demyelinating ON at the acute phase and 2 years later. |
Discussion
The results of the present study strongly suggest that not all patients with MS-related demyelinating ON should be treated with intravenous steroids at the acute phase. The comparison of functional (DBCVA, visual field, PVEP, PERG) and structural (macular and RNFL thickness) long-term outcomes revealed no statistically significant difference regardless of intravenous steroid treatment. Also, results of previous studies have only shown that intravenous steroids might reduce the risk of the conversion of demyelinating ON to MS within the first two years in patients with two or more white matter lesions on MRI6 and were effective in improving only short-term visual recovery.6–8 These observations reduce the number of patients who should be considered for steroid therapy to particular cases. Despite that, steroids are still routinely used by ophthalmologists and neurologists in every case of MS-related demyelinating ON. In present study, in both investigated groups, most of the patients had full visual acuity after the acute phase of the demyelinating ON. Also, the total amount of visual field loss (MD) in Humphrey perimetry did not reveal any statistically significant differences and the mean values were within normal limits in both investigated groups. This observation is consistent with previous reports which have found that visual function recovery in the course of demyelinating ON is observed spontaneously even without treatment and may continue to improve up to 1 year.2,10–13 Normal visual acuity, 1.0 according to Snellen, requires less than one-half of normal foveal axons, so despite the return of visual acuity, optic atrophy to at least some degree may follow, and almost always follows an attack of optic neuritis.14,15 The results of OCT studies indicate the thinning of RNFL and subsequently, the macula (as a result of ganglion cell loss secondary to axonal damage) is present in up to 85% of patients with demyelinating ON.16–20 These abnormalities may be also seen in patients with MS who do not have a clinical history of ON resulting from axonal loss due to demyelination.21 In our study, the results of mean RNFL and macular thickness measurements were within normal limits; however, their values were closer to the lower limit of the norm for Carl Zeiss Cirrus HD-OCT (Figure 1). It is possible that macular and RNFL thickness in our patients was better before demyelinating ON, and we only registered subsequent loss of RNFL or macular ganglion cell in comparison to the baseline, but not to the norms. However, this was not the objective of this study.
To the best of our knowledge, our study is the first one to analyze simultaneously PVEP and PERG recordings obtained from eyes with past demyelinating ON in patients treated or not treated with intravenous steroids during the acute phase. The pattern visual evoked potential recordings in demyelinating ON, as a biomarker of central nervous system demyelination, have been investigated several times. In our study, the comparison of P100 amplitudes and latencies in the S(-) and S(+) groups did not reveal any significant differences (Figure 2). However, the mean P100 latencies were markedly delayed in both groups in comparison to our normal laboratory values and suggest persistent demyelination of the optic nerve. It is known from the literature that PVEP responses remain delayed in most patients, even with visual recovery.22–24 At one year 80–90% will be abnormal and at two years – about 35% will return to normal,12,13,22 as it happened in the presented case (Figure 4). A delay in the P100 wave of PVEP is the electrophysiological manifestation of slowed conduction in the optic nerve as a result of axonal demyelination.16 Our results suggest that steroid treatment in the acute phase has no significant impact on the long-term bioelectrical function of the optic nerve measured with PVEP. The pattern electroretinogram is not routinely used in the course of demyelinating ON. Nonetheless, it may provide useful information describing a retinal defect in MS. The comparison of PERG results obtained from the S(+) and S(-) groups did not reveal any statistically significant differences, although the S(+) group achieved mean results of P50 and N95 amplitudes below our laboratory norms, and S(-) was close to the lower limit of normal. This may indicate coexisting damage to ganglion cells in these patients, which is probably a result of partial retrograde axonal degeneration. Recently, Janaky et al25 investigated PERG recordings in MS patients with and without a history of ON, and found a significant decrease in P50 and N95 amplitudes in both groups as compared to the controls. Earlier studies also reported alteration of various PERG parameters in eyes with a history of demyelinating ON; however, there was no information about possible steroid treatment in the acute phase and the contralateral eyes of MS patients served as a control group, which might affect comparative analysis results.26–28 Additionally to other tests, PERG analysis can offer valuable data to help the localization of the defects along the visual pathway after demyelinating ON.
Conclusion
The results of our study indicate that there is no statistically significant difference in the function and structure of the retina and the optic nerve in long-term observation of eyes with a history of demyelinating ON treated or not treated with intravenous steroids. Therefore, the application of steroid therapy should be considered on an individual basis and not as a routine treatment for all patients.
Disclosure
The authors report no conflicts of interest in this work.
References
1. Optic Neuritis Study Group. The Clinical Profile of Optic Neuritis: Experience of the Optic Neuritis Treatment Trial.Arch Ophthalmol. 1991;109(12):1673-1678. doi:10.1001/archopht.1991.01080120057025
2. Dooley MC, Foroozan R. Optic neuritis. J Ophthalmic Vis Res. 2010;5:182–187.
3. Jirawuthiworavong GV, Pecha J, Bindiganavile SH, Bhat N, Lee AG. Demyelinating optic neuritis. Available from: https://eyewiki.aao.org/Demyelinating_Optic_Neuritis.
4. Plant GT. Optic neuritis and multiple sclerosis. Curr Opin Neurol. 2008;21:16–21. doi:10.1097/WCO.0b013e3282f419ca
5. Beck RW. The optic neuritis treatment trial. Arch Ophthalmol. 1988;106:1051. doi:10.1001/archopht.1988.01060140207023
6. Beck RW, Cleary PA, Anderson MM
7. Gal RL, Vedula SS, Beck R. Corticosteroids for treating optic neuritis. Cochrane Database Syst Rev. 2012;4:CD001430.
8. Beck RW, Cleary PA, Trobe JD, et al. The effect of corticosteroids for acute optic neuritis on the subsequent development of multiple sclerosis. The Optic Neuritis Study Group. N Engl J Med. 1993;329:1764–1769. doi:10.1056/NEJM199312093292403
9. Robson AG, Nilsson J, Li S, et al. ISCEV guide to visual electrodiagnostic procedures. Doc Ophthalmol. 2018;136:1–26. doi:10.1007/s10633-017-9621-y
10. Shams PN, Plant GT. Optic neuritis: a review. Int MS J. 2009;16:82–89.
11. Voss E, Raab P, Trebst C, Stangel M. Clinical approach to optic neuritis: pitfalls, red flags and differential diagnosis. Ther Adv Neurol Disord. 2011;4:123–134. doi:10.1177/1756285611398702
12. Mehrotra A, Jaffery N, Saxena R, Menon V. Comparative evaluation of megadose methylprednisolone with dexamethasone for treatment of primary typical optic neuritis. Indian J Ophthalmol. 2007;55:355–359. doi:10.4103/0301-4738.33821
13. Sethi H, Sharma P, Tandon R, Khokhar S, Menon V. Visual outcome after intravenous dexamethasone therapy for idiopathic optic neuritis in an Indian population: a clinical case series. Indian J Ophthalmol. 2006;54:177–183. doi:10.4103/0301-4738.27069
14. Cleary PA, Beck RW, Bourque LB, et al. Visual symptoms after optic neuritis. Results from the Optic Neuritis Treatment Trial. J Neuroophthalmol. 1997;17:18. doi:10.1097/00041327-199703000-00004
15. Miller NR, Newman NJ, Biousse V, Kerrison JB. Walsh and Hoyt’s Clinical Neuro-Ophthalmology. Philadelphia: Lippincott, Williams and Wilkins; 2005.
16. Klistorner A, Arvind H, Nguyen T, et al. Axonal loss and myelin in early ON loss in postacute optic neuritis. Ann Neurol. 2008;64:325. doi:10.1002/ana.21474
17. Costello F, Coupland S, Hodge W, et al. Quantifying axonal loss after optic neuritis with optical coherence tomography. Ann Neurol. 2006;59:963. doi:10.1002/ana.20851
18. Trip SA, Schlottmann PG, Jones SJ, et al. Retinal nerve fiber layer axonal loss and visual dysfunction in optic neuritis. Ann Neurol. 2005;58:383. doi:10.1002/ana.20575
19. Fisher JB, Jacobs DA, Markowitz CE, et al. Relation of visual function to retinal nerve fiber layer thickness in multiple sclerosis. Ophthalmology. 2006;113:324. doi:10.1016/j.ophtha.2005.10.040
20. de Seze J, Blanc F, Jeanjean L, et al. Optical coherence tomography in neuromyelitis optica. Arch Neurol. 2008;65:920. doi:10.1001/archneur.65.7.920
21. Yeh EA, Marrie RA, Reginald YA, et al. Functional-structural correlations in the afferent visual pathway in pediatric demyelination. Neurology. 2014;83:2147. doi:10.1212/WNL.0000000000001046
22. Brusa A, Jones SJ, Plant GT. Long-term remyelination after optic neuritis: a 2-year visual evoked potential and psychophysical serial study. Brain. 2001;124:468. doi:10.1093/brain/124.3.468
23. Hickman SJ, Toosy AT, Miszkiel KA, et al. Visual recovery following acute optic neuritis–a clinical, electrophysiological and magnetic resonance imaging study. J Neurol. 2004;251:996. doi:10.1007/s00415-004-0477-1
24. Celesia GG, Kaufman DI, Brigell M, et al. Optic neuritis: a prospective study. Neurology. 1990;40:919. doi:10.1212/WNL.40.6.919
25. Janáky M, Jánossy Á, Horváth G, Benedek G, Braunitzer G. VEP and PERG in patients with multiple sclerosis, with and without a history of optic neuritis. Doc Ophthalmol. 2017;134:185–193. doi:10.1007/s10633-017-9589-7
26. Fraser CL, Holder GE. Electroretinogram findings in unilateral optic neuritis. Doc Ophthalmol. 2011;123:173–178. doi:10.1007/s10633-011-9294-x
27. Garcia-Martin E, Pueyo V, Ara JR, et al. Effect of optic neuritis on progressive axonal damage in multiple sclerosis patients. Mult Scler. 2011;17:830–837. doi:10.1177/1352458510397414
28. Parisi V, Manni G, Spadaro M, et al. Correlation between morphological and functional retinal impairment in multiple sclerosis patients. Invest Ophthalmol Vis Sci. 1999;40:2520–2527.
 © 2021 The Author(s). This work is published and licensed by Dove Medical Press Limited. The
full terms of this license are available at https://www.dovepress.com/terms
and incorporate the Creative Commons Attribution
- Non Commercial (unported, 3.0) License.
By accessing the work you hereby accept the Terms. Non-commercial uses of the work are permitted
without any further permission from Dove Medical Press Limited, provided the work is properly
attributed. For permission for commercial use of this work, please see paragraphs 4.2 and 5 of our Terms.
© 2021 The Author(s). This work is published and licensed by Dove Medical Press Limited. The
full terms of this license are available at https://www.dovepress.com/terms
and incorporate the Creative Commons Attribution
- Non Commercial (unported, 3.0) License.
By accessing the work you hereby accept the Terms. Non-commercial uses of the work are permitted
without any further permission from Dove Medical Press Limited, provided the work is properly
attributed. For permission for commercial use of this work, please see paragraphs 4.2 and 5 of our Terms.