Back to Journals » Psychology Research and Behavior Management » Volume 12
Comparison Of The Children Neuropsychological And Behavior Scale And The Griffiths Mental Development Scales When Assessing The Development Of Children With Autism
Authors Li HH ![]() , Feng JY, Wang B
, Feng JY, Wang B ![]() , Zhang Y, Wang CX, Jia FY
, Zhang Y, Wang CX, Jia FY
Received 3 August 2019
Accepted for publication 25 September 2019
Published 16 October 2019 Volume 2019:12 Pages 973—981
DOI https://doi.org/10.2147/PRBM.S225904
Checked for plagiarism Yes
Review by Single anonymous peer review
Peer reviewer comments 2
Editor who approved publication: Dr Igor Elman
Hong-Hua Li,1 Jun-Yan Feng,1 Bing Wang,1 Yu Zhang,1 Cheng-Xin Wang,1 Fei-Yong Jia1,2
1Department of Developmental and Behavioral Pediatrics, The First Hospital of Jilin University, Changchun, Jilin 130021, People’s Republic of China; 2Neurological Research Center of the First Hospital of Jilin University, Changchun, People’s Republic of China
Correspondence: Fei-Yong Jia
Department of Developmental and Behavioral Pediatrics, The First Hospital of Jilin University, Changchun, Jilin 130021, People’s Republic of China
Tel +86-0431-88783846
Email [email protected]
Background: The newly revised Children Neuropsychological and Behavior Scale (CNBS-R2016) is a diagnostic assessment tool widely used in China to assess the developmental level of children aged 0 to 6 years. The purpose of this study was to determine whether the effectiveness of developmental assessment in children with autism spectrum disorder (ASD) by the CNBS-R2016 was consistent with that of the Griffiths Mental Development Scales for China (GDS-C).
Methods: In total, 139 children with ASD were recruited in this study. The Autism Behavior Checklist (ABC) and the Childhood Autism Rating Scale (CARS) were used to measure ASD severity. All subjects were evaluated with both the CNBS-R2016 and GDS-C. To determine the consistency between the CNBS-R2016 and GDS-C, Pearson correlation coefficients and Bland-Altman plots were computed. The GDS-C was used as a reference assessment, and the performance of the CNBS-R2016 was analyzed with receiver operating curves.
Results: No significant difference was found between the proportions of developmental delays detected by the CNBS-R2016 subscales and the corresponding GDS-C subscales. The CNBS-R2016 Communication Warning Behavior subscale quotients and the total ABC and CARS scores were significantly and positively correlated. The general and subscale quotients of the CNBS-R2016 and the corresponding quotient of the GDS-C were also significantly and positively correlated. The area under all the curves of the CNBS-R2016 was above 0.8 according to the results of the GDS-C (general or subscale quotient <70 indicates a developmental delay), and Bland-Altman plots showed no systemic bias between the two scales.
Conclusion: The CNBS-R2016 and GDS-C tests showed good consistency in the developmental assessment of children with ASD. In addition, the CNBS-R2016 allows the simultaneous assessment of autism symptoms and the developmental level. Therefore, the CNBS-R2016 is worthy of clinical application in children aged 0–6 years.
Keywords: autism spectrum disorders, Children Neuropsychological and Behavior Scale, Griffiths Mental Development Scales, developmental assessment, children
Introduction
Autism spectrum disorder (ASD) is a neurodevelopmental disorder that presents in early childhood and is characterized by sociocommunicative dysfunction, restricted interests, and repetitive and stereotypical behaviors. The prevalence of ASD has increased dramatically in recent decades, from 1 in 5,000 children in 1975 to 1 in 59 children in 2014 in America;1 the current worldwide prevalence is close to 1%.2 ASD often coexists with a variety of other developmental disorders, and 31% of children with ASD demonstrate comorbid intellectual disabilities (IDs).1 Speech and language problems are the main reasons that encourage caregivers of children with ASD to initially seek treatment.3 Gardner et al showed that the lower the adaption skills of children with ASD are, the higher the ASD severity and the greater the level of support required.4 The dual diagnosis of ASD and IDs can affect the services these children receive and ultimately their treatment outcomes.5 Children with ASD and missed diagnoses of comorbid ID may have worse developmental outcomes.6 Children with ASD and low developmental levels may need more intensive interventions to improve their developmental progress.7 Therefore, before children diagnosed with ASD receive treatment, intellectual and language development levels should be routinely evaluated to improve the multidimensional evaluation and diagnosis and to formulate a customized educational and behavioral intervention plan for these children. The goal is to reduce maladaptive behavior while developing life skills and normalizing functionality as much as possible.
A comprehensive psychological developmental assessment of children requires the evaluation of a broad range of behaviors, including motor, language, social, and cognitive traits. The Griffiths Mental Development Scales (GMDS) is a diagnostic measure that has been used extensively in many countries and has excellent psychometric properties.8,9 In 2006, the second edition of the GMDS was revised and renamed the Griffiths Mental Development Scales-Extended Revised (GMDS-ER).10 The GMDS-ER contains six separate subscales: Locomotor (A), Personal-Social (B), Language (C), Eye-Hand Coordination (D), Performance (E), and Practical Reasoning (F).10 Tso et al conducted a cross-cultural comparison of the Chinese version of the GMDS, and the results showed that the Griffiths Mental Development Scales for China (GDS‐C) was adapted to the local Chinese culture and was suitable for the assessment of children aged 0–8 years in China.11 However, the GDS-C scales are available only for evaluation by psychologists or clinicians with formal training. Furthermore, the GDS-C scales require at least one and a half hours for assessing a preschooler.
As an alternative to the GDS-C, the Children Neuropsychological and Behavior Scale (CNBS) is a diagnostic assessment tool developed by the Capital Institute of Pediatrics in China that is widely used in China to assess the developmental level of children aged 0 to 4 years.12 It includes five separate subscales: Gross Motor, Personal-Social, Language, Fine Motor, and Adaptive Behavior. The CNBS was restandardized in 2005 and completed in 2016 and was renamed the Children Neuropsychological and Behavior Scale-Revision 2016 (CNBS-R2016); the new version was shown to have adequate reliability.13 The age of assessment for the CNBS-R2016 was extended to 6 years, and an independent subscale, Communication Warning Behavior, was added to assess autism symptoms. After formal training, a psychologist can complete the CNBS-2016 in 30 to 50 mins.
Four of the subscales in the two tests correspond to one another. The Gross Motor, Personal-Social, Language and Fine Motor subscales of the CNBS-R2016 correspond to subscales A to D, respectively, of the GMDS. The Adaptive Behavior subscale of the CNBS-R2016 measures skills that are the forerunners of future “intelligence”. Therefore, it corresponds to subscales E and F in the GMDS. In addition, the classification of and statistics for the developmental level of children are similar in these two scales, which is another reason the two scales can be compared, as was done in the current study.
The GMDS has a wide range of clinical applications, such as the evaluation of the impact of epilepsy on cognitive competence,14 the impact of antiepileptic drugs on the cognitive development of offspring,15 the impact of congenital heart disease surgery on the outcome of infant neurodevelopment16 and the prediction of later developmental problems.17,18 In addition, previous research has proven that the Chinese version of the GMDS, which was renamed the GDS-C, is adapted to local Chinese culture.11 Therefore, the GDS-C can be used as a reference assessment to evaluate the performance of new revisions of the CNBS.
To date, no study has compared the results of the CNBS-R2016 and the GDS-C tests in a given child with ASD. The purpose of this study was to determine whether the effectiveness of developmental assessment in children with ASD by the CNBS-R2016 was consistent with that of the GDS-C.
Methods
Study Design
This cross-sectional investigation was approved by the Ethics Committee of the First Hospital of Jilin University. Written informed consent was obtained from the parents or legal guardians of the children with ASD prior to participation. This study was conducted in accordance with the Declaration of Helsinki.
Participants
The subjects were part of a research study in China entitled “Early diagnosis and nutritional intervention in children with autism spectrum disorders”, funded by the National Key Research and Development Program of China. After evaluation by at least 2 psychologists or developmental pediatricians in the First Hospital of Jilin University through a series of structured interviews conducted according to the Diagnostic and Statistical Manual of Mental Disorders (DSM-5) criteria, 139 children fulfilling the criteria for ASD were included in this study. These subjects also completed assessments of autism symptom severity and developmental level at the training center. The mean age of the children was 49.9±12.3 months. The study group included 114 boys and 25 girls, and the age ranged from 25 months to 76 months. Subjects with Fragile X syndrome, Rett syndrome, genetic metabolic disorder, deficits in motor functioning (e.g., cerebral palsy) and other neurological disorders (e.g., epilepsy, tuberous sclerosis) were excluded from this study.
Measurements
Assessment Of Autism Symptoms
The symptoms of the children with ASD were assessed according to the Autism Behavior Checklist (ABC) and the Childhood Autism Rating Scale (CARS) by a developmental pediatrician.19,20 The ABC score for typically developing children should be <53, and the CARS score should be <30. The higher the scores on the two scales, the more severe the autism symptoms.
Assessment Of Mental Development
Two diagnostic mental development scales (CNBS-R2016 and GDS-C) were used in this study. Three psychologists who had undergone formal training in these two tests and had obtained evaluation qualification certificates participated in this study. Prior to the study, the evaluators conducted conformance tests using the GDS-C and CNBS-R2016, and the intragroup correlation coefficient was above 0.9. To reduce the impact of environmental factors on the test results, the test was conducted in a room in the training center that was familiar to the children. The GDS-C and CNBS-R2016 tests were performed in random sequences. The two tests for the same child with ASD were completed by the same evaluator within 1 week, and the original score was recorded.
The mean of the general quotient and the five subscale quotients of the CNBS-R2016 is 100. A general or subscale quotient less than 70 points [< 2 standard deviations (SDs)] indicates a developmental delay, a quotient between 70 and 79 points is slightly below the threshold for developmental delay, and a quotient greater than or equal to 80 points indicates no delay.13 For the new subscale of Communication Warning Behavior, a quotient less than 7 points indicates typical development, a quotient between 7 and 12 points indicates a need for follow-up, a quotient between 12 and 30 points indicates a risk of communication and interaction disorder, and a quotient greater than 30 points indicates a high suspicion of ASD.13 The mean of the general quotient and the six subscale quotients of the GDS-C is 100 points, and the SD is 15 points. A general or subscale quotient less than 2 SDs below the mean (<70) indicates significant delay, a quotient between 1 SD and 2 SDs below the mean (70–85) indicates a mild delay, and a quotient equal to or greater than 85 points (≥85) indicates no delay.21 Each child with ASD was classified according to the SD as having significant delay (< −2 SDs) to mild or no delay (> −2 SDs).
Statistical Analyses
SPSS statistical software 22.0 (IBM Corp., Armonk, NY) was used to analyze the data. The Kolmogorov–Smirnov test was used to determine the distribution of the analyzed variable before analysis. Continuous variables are described as the means ± SDs, and categorical variables are described as frequencies and percentages. A chi-square test was performed to test for differences in the proportions of categorical variables between two groups. The Pearson correlation coefficient was calculated to evaluate the correlation between the two tests. The same statistical method was also used to test the correlation between the Communication Warning Behavior score of the CNBS-R2016 subscale and the total ABC and CARS scores. A Pearson correlation coefficient > 0.8 is considered an extremely strong correlation, a coefficient between 0.6 and 0.8 is considered a strong correlation, a coefficient between 0.4 and 0.6 is considered a moderate correlation, a coefficient between 0.2 and 0.4 is considered a weak correlation, and a coefficient between 0.0 and 0.2 is considered a very weak correlation.22 The performance of the CNBS-R2016 was determined using a receiver operating characteristic (ROC) curve by calculating the area under the ROC curve using the GDS-C general or a subscale quotient cut-off of 70 (mean −2 SDs) to identify a developmental delay. Bland-Altman plots were also drawn to analyze the agreement between the two tests. All comparisons used 2-sided tests, and a p value <0.05 was considered statistically significant.
Results
Characteristics Of The Study Population
The characteristics of the study population are presented in Table 1. In total, 139 children were recruited for the current study. The mean age of the children with ASD was 49.9±12.3 months, and the male-to-female ratio was 4.6:1.
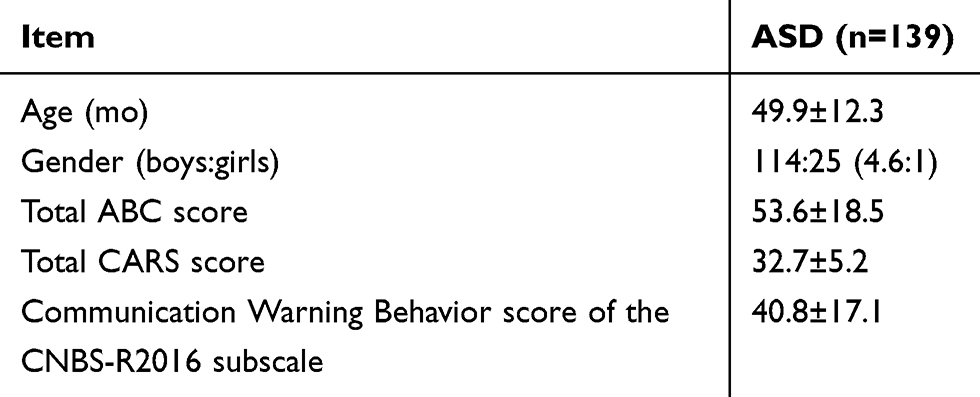 |
Table 1 Characteristics Of The Children With ASD Included In The Study (mean ± SD) |
Correlation Coefficients Of The Two Tests
Correlation coefficients were obtained between the general and subscale quotients of the CNBS-R2016 and their corresponding GDS-C quotients. The correlations between the general and subscale quotients of the Gross Motor, Personal-Social, Language and Fine Motor subscales were high and significant, with a Pearson correlation coefficient > 0.8. The correlations of the quotient of the CNBS-R2016 Adaptive Behavior subscale to the corresponding quotient of the GDS-C Performance and Practical Reasoning subscale were significant, with a Pearson correlation coefficient between 0.5 and 0.8. These findings are presented in Table 2. There was a significant positive correlation between the CNBS-R2016 Communication Warning Behavior subscale quotient and the total ABC score (r = 0.821, p < 0.001) and the total CARS score (r = 0.734, p < 0.001).
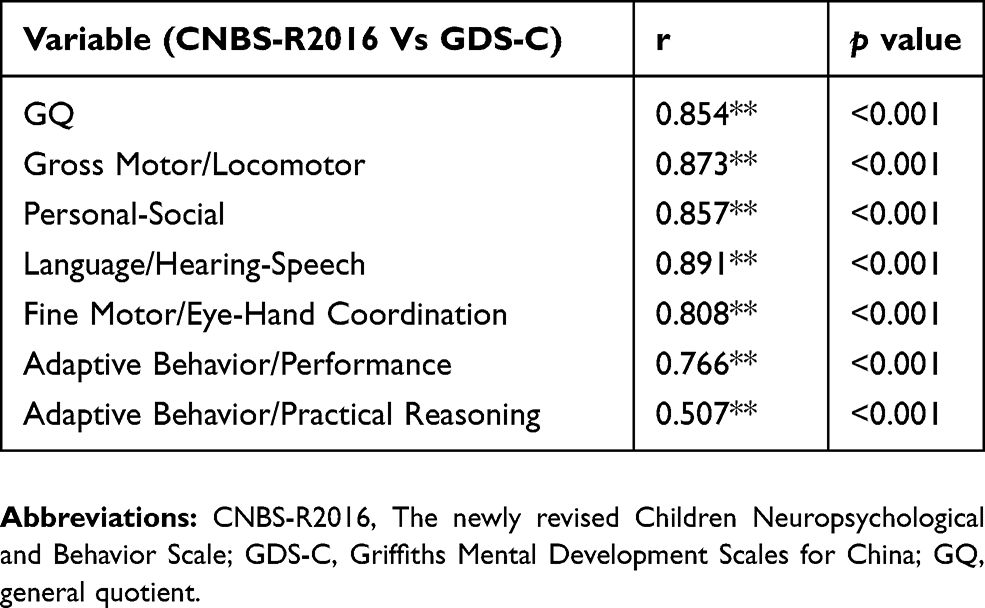 |
Table 2 Correlation Between The CNBS-R2016 And Its Corresponding GDS-C Scales |
GDS-C And CNBS-R2016 Scores In Children With ASD
We evaluated the cognitive and behavioral development of children with ASD using both the GDS-C and CNBS-R2016 tests. The mean ± SD of the developmental quotients of the GDS-C and CNBS-R2016 are listed in Table 3. A general or subscale quotient −2 SDs below the mean was considered to indicate a developmental delay. The percentages of children exhibiting delays in different domains of the CNBS-R2016 and GDS-C are shown in Table 4. Due to their low developmental levels and limited language abilities, only 77 (55%) children has measurable scores in the Practical Reasoning area; the remaining 62 (45%) children scored zero in this area. The percentages of a developmental delay in two or more domains of the CNBS-R2016 and GDS-C were 68.3% and 67.6%, respectively. As shown in Table 4, the percentages of children with developmental delays in the Gross Motor, Personal-Social, Language, and Fine Motor subscales and in two or more domains of the scales did not differ significantly between the two tests. The percentage of a developmental delay according to the CNBS-R2016 general quotient was significantly lower than that determined by the GDS-C (55.4% vs 67.6%, respectively, p < 0.05).
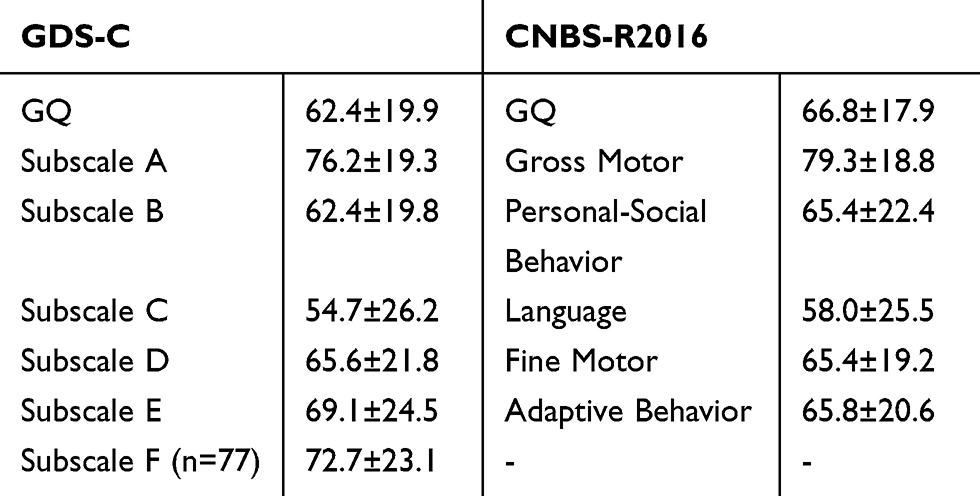 |
Table 3 General And Subscale Quotients Of The GDS-C And CNBS-R2016 (mean±sd) |
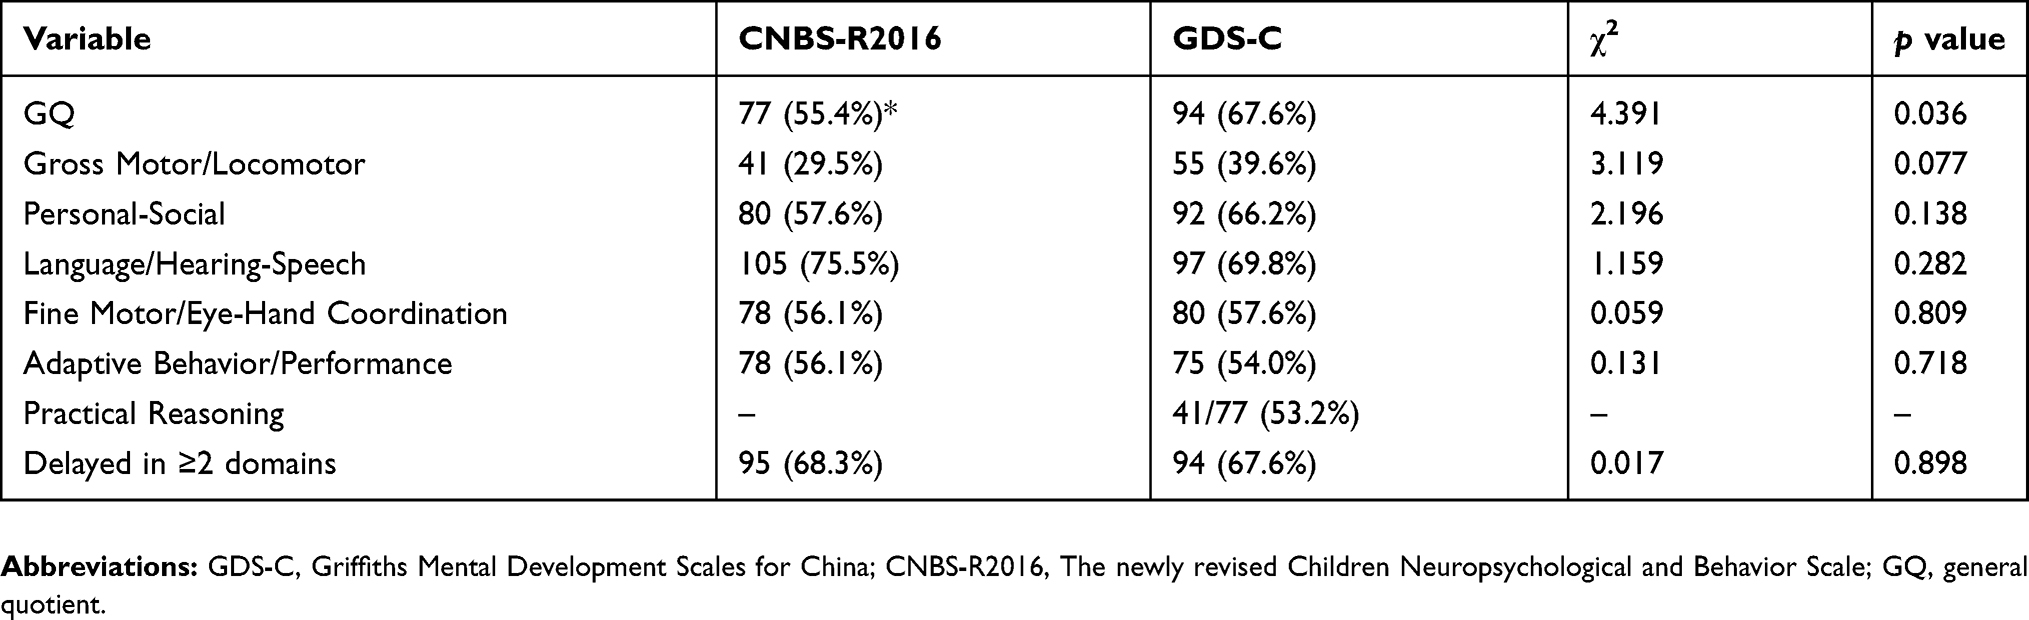 |
Table 4 Number Of Children With A Developmental Delay According To The General And Subscale Quotients Of The CNBS-R2016 And GDS-C (n, %) |
The ROC Curve And Bland-Altman Plots
The area under the ROC curve for discriminating children with a developmental delay according to the general or subscale quotient of the CNBS-R2016 from those without a developmental delay using the GDS-C general or subscale quotient cut-off of 70 (mean −2 SDs) as a standard is shown in Figure 1. The area under the curve (AUC) of all regions (Figure 1A–F) was approximately 0.9, which means that the CNBS-2016 could accurately detect the developmental delay in each area.
 |
Figure 1 ROC curve for discriminating children with ASD and developmental delay according to the CNBS-R2016 general or subscale quotient from those without a developmental delay using the GDS-C general or subscale quotient cut-off of 70 (mean −2 SDs) as a standard. (A) ROC curve of the CNBS-R2016 general quotient using the GDS-C general quotient cut-off of 70 as a standard. (B) ROC curve of the CNBS-R2016 gross motor quotient using the GDS-C subscale A quotient cut-off of 70 as a standard. (C) ROC curve of the CNBS-R2016 Personal-Social quotient using the GDS-C subscale B quotient cut-off of 70 as a standard. (D) ROC curve of the CNBS-R2016 Language quotient using the GDS-C subscale C quotient cut-off of 70 as a standard. (E) ROC curve of the CNBS-R2016 Fine Motor quotient using the GDS-C subscale D quotient cut-off of 70 as a standard. (F) ROC curve of the CNBS-R2016 Adaptive Behavior quotient using the GDS-C subscale E quotient cut-off of 70 as a standard. |
To examine the existence of systematic bias in the comparison between the CNBS-R2016 general or subscale quotients and the corresponding quotients of the GDS-C, Bland-Altman plots were created, as shown in Figure 2. These plots did not show any such bias in any area (Figure 2A–F).
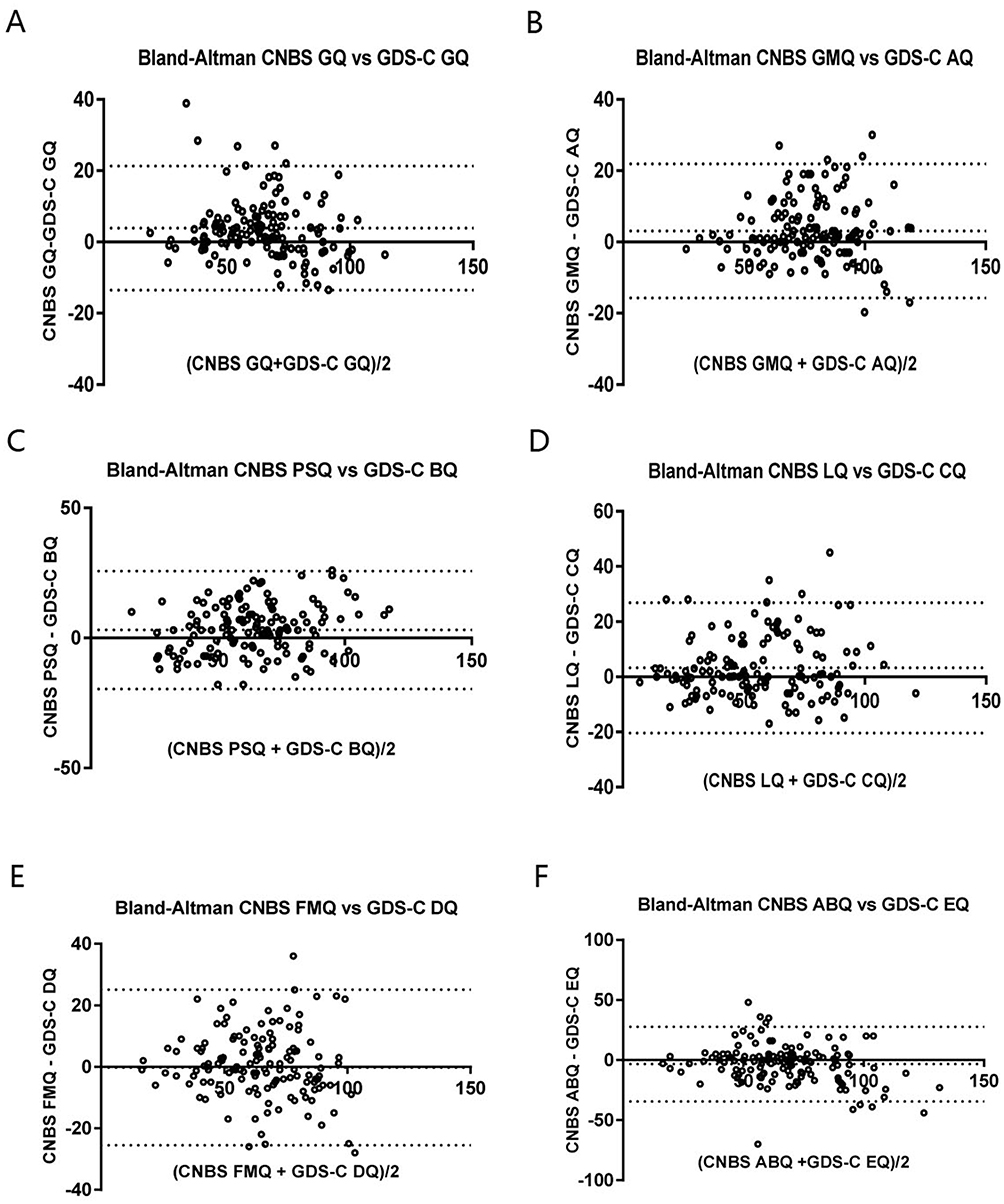 |
Figure 2 Bland-Altman plots generated to compare the average CNBS-R2016 and GDS-C quotients to their differences. The limits of agreement (95% CI, ie, mean ± 1.96 SDs) are shown by dotted lines. (A) Comparison of the CNBS-R2016 general quotient (GQ) and the GDS-C GQ. Mean difference: 3.9 (95% CI −13.5 to 21.3). (B) Comparison of the CNBS-R2016 Gross Motor quotient (GMQ) and the GDS-C subscale A quotient (AQ). Mean difference: 3.1 (95% CI −15.7 to 21.9). (C) Comparison of the CNBS-R2016 Personal-Social quotient (PSQ) and the GDS-C subscale B quotient (BQ). Mean difference: 3.1 (95% CI −19.6 to 25.7). (D) Comparison of the CNBS-R2016 Language quotient (LQ) and the GDS-C subscale C quotient (CQ). Mean difference: 3.3 (95% CI −20.4 to 26.9). (E) Comparison of the CNBS-R2016 Fine Motor quotient (FMQ) and the GDS-C subscale D quotient (DQ). Mean difference: −0.2 (95% CI −25.5 to 25.1). (F) Comparison of the CNBS-R2016 Adaptive Behavior quotient (ABQ) and the GDS-C subscale E quotient (EQ). Mean difference: −3.3 (95% CI −34.4 to 27.8). |
Discussion
The objective of this study was to determine whether the effectiveness of developmental assessment in children with ASD using the CNBS-R2016 was consistent with that of the GDS-C. It is important to accurately measure and diagnose developmental delays in children with ASD given both the high comorbidity of these disorders and the influence of delays on a child’s prognosis.23,24 In terms of describing the developmental level of children with ASD, our results showed that the proportion and distribution of the two tests for the detection of developmental delays in different domains in children with ASD are basically consistent. According to the assessment results of the CNBS-R2016 and GDS-C, nearly 70% of the children with ASD had developmental delays in two or more domains, consistent with Fombonne.25 In addition, approximately 70% of the children showed developmental delays on the Hearing-Speech and Personal-Social subscales, while the proportion of children that manifested developmental delays on the Locomotor and Performance subscales was relatively small, indicating a characteristic cognitive profile of children with ASD. The imbalance in the distribution of developmental delays across the five subscales of the CNBS-R2016 test also verified this cognitive profile. Sociocommunicative dysfunction is a core symptom of ASD and is often accompanied by impaired language ability. The relative strengths of individuals with ASD are gross motor and visual perception abilities. Visuospatial skills are tested in the Performance subscale of the GDS-C and in the Adaptive Behavior subscale of the CNBS-R2016, which may explain the low percentage of children in this study that showed developmental delays in these two subscales. Some research has also demonstrated this profile.26,27 In contrast, the proportion of children with developmental delays in all domains of the two tests was lower than that described by Guo et al (in which the proportion of children with a delay in each domain was above 70%),28 possibly due to the sample size and age ranges of the subjects.
Although there was no difference in the ability of the CNBS-R2016 and GDS-C to identify developmental delays in the aspects of language, personal-social, adaptive behavior skills, gross and fine motor abilities in children with ASD, if the general quotients of the two tests were used to identify the proportion children with ASD with a general developmental delay, the CNBS-R2016 would have identified a lower proportion of the sample than the GDS-C. This finding may be because the CNBS-R2016 is a localized assessment tool, and some items more closely reflect the local culture; therefore, this tool may test the optimal ability of the children. This finding may also be related to the sample size; thus, further in-depth study is needed. One result that warrants attention is that there was a nearly trend-level difference in the percentage of children classified as having a delay in gross motor or locomotor skills by the two measures, with the GDS-C catching more of these types of delays. The reason for this result may be that the GDS-C is both more appropriate to the culture of the children tested (and thus potentially catching more true delays) and more sensitive to gross motor skills, and consequently, it does a better job of measuring motor functioning.
In addition, our results suggested that the two tests had the same significance for all subscales analyzed for a given child with ASD. There was a significant positive correlation between the general and subscale quotients of the CNBS-R2016 and the corresponding quotients of the GDS-C. The area under all the curves of the CNBS-R2016 was approximately 0.9 for discriminating children with a developmental delay from children without a delay using the GDS-C general or subscale quotient cut-off of 70 as a standard. Additionally, the Bland-Altman plots showed no systemic bias between the two scales. These results support good consistency between the CNBS-R2016 and GDS-C scales.
To date, we have not found any research on the consistency between the CNBS-R2016 and GDS-C. Some research has been performed on the value of the GMDS for predicting later developmental problems. Squarza et al conducted a study on early developmental level and cognitive outcomes in 99 children with an extremely low birth weight, and the results showed that the lower the GMDS score was at 1 year, the more severe the cognitive impairment was at school age, indicating a high predictive power of the GMDS.29 This predictive power increased with increasing age at assessment.17,18 The results of the current study showed that the CNBS-R2016 and GDS-C have good consistency, indicating that the CNBS-R2016 may also have good value for predicting later developmental problems in children. More importantly, the CNBS-R2016 contains a Communication Warning Behavior subscale. Our results showed a significant positive correlation between the Communication Warning Behavior subscale quotient and the ABC and CARS total scores, indicating good consistency between the Communication Warning Behavior subscale, the ABC, and the CARS. Therefore, when the CNBS-R2016 is performed to evaluate the developmental level of children, it can also be used to assess autism symptoms. Moreover, CNBS-R2016 is a localized assessment tool, so it is easier to carry out formal training in China. Compared to GDS-C, it is a briefer measure of developmental assessment for young children, and thus demonstrates strong clinical practicability.
Although our results are promising, the study does have some limitations. First, the two tests were carried out only one week apart; because the evaluators were not blinded, they may be biased in their expectations of child performance at the second testing session. The children may also have recall bias for the two tests are similar. Second, while the sample size was reasonably large, due to the small number of females, it was not possible to examine differences by sex. Third, the age range of the sample was quite large, yet differences in measure performance by age were not able to be examined. It is possible that measures may perform slightly differently across the age span. Fourth, this study included only Chinese samples, so the results cannot be generalized beyond a Chinese sample. All are areas for future directions, in addition to exploration of the utility of the CNBS-R2016 in predicting future outcomes for young children.
Conclusion
The CNBS-R2016 and GDS-C tests show good consistency in the developmental assessment of children with ASD. In addition, the CNBS-R2016 can be used to assess autism symptoms while assessing the developmental level. Therefore, the CNBS-R2016 is worthy of clinical application in children aged 0–6 years in China.
Abbreviations
ASD, Autism spectrum disorder; IDs, Intellectual disabilities; GMDS, Griffiths Mental Development Scales; GMDS-ER, Griffiths Mental Development Scales-Extended Revised; GDS‐C, Griffiths Mental Development Scales for China; CNBS, Children Neuropsychological and Behavior Scale; CNBS-R2016, Children Neuropsychological and Behavior Scale-Revision 2016; DSM-5, Diagnostic and Statistical Manual of Mental Disorders; ABC, Autism Behavior Checklist; CARS, Childhood Autism Rating Scale; SD, Standard deviation; ROC curves, Receiver operating characteristic curves; AUC, Area under curve.
Acknowledgments
The authors thank the patients and their parents for their participation.
Disclosure
The authors report no conflicts of interest in this work.
References
1. Baio J, Wiggins L, Christensen DL, et al. Prevalence of autism spectrum disorder among children aged 8 years - autism and developmental disabilities monitoring network, 11 Sites, United States, 2014. MMWR Surveill Summ. 2018;67(6):1–23. doi:10.15585/mmwr.ss6706a1
2. American Psychiatric Association. Diagnostic and Statistical Manual of Mental Disorders.
3. Wei SH, Cao J, Mi T, Feng JR, Liao J. Development of social skills in children with autism spectrum disorder and related influencing factors. Zhongguo Dang Dai Er Ke Za Zhi. 2019;21(1):77–81.
4. Gardner LM, Campbell JM, Keisling B, Murphy L. Correlates of DSM-5 autism spectrum disorder levels of support ratings in a clinical sample. J Autism Dev Disord. 2018;48(10):3513–3523. doi:10.1007/s10803-018-3620-z
5. Rivard M, Terroux A, Mercier C, Parent-Boursier C. Indicators of intellectual disabilities in young children with autism spectrum disorders. J Autism Dev Disord. 2015;45(1):127–137. doi:10.1007/s10803-014-2198-3
6. Miller LE, Burke JD, Robins DL, Fein DA. Diagnosing autism spectrum disorder in children with low mental age. J Autism Dev Disord. 2019;49(3):1080–1095. doi:10.1007/s10803-018-3810-8
7. Hinnebusch AJ, Miller LE, Fein DA. Autism spectrum disorders and low mental age: diagnostic stability and developmental outcomes in early childhood. J Autism Dev Disord. 2017;47(12):3967–3982. doi:10.1007/s10803-017-3278-y
8. Amod Z, Cockcroft K, Soellaart B. Use of the 1996 griffiths mental development scales for infants: a pilot study with a black, south African sample. J Child Adolesc Ment Health. 2007;19(2):123–130. doi:10.2989/17280580709486647
9. Griffiths R. The Griffiths Mental Development Scales from Birth to 2 Years, Manual, the 1996 Revision. Henley: Association for Research in Infant and Child Development, Test agency; 1996.
10. Luiz D, Barnard A, Knoesen N, et al. Griffiths Mental Development Scales: Extended Revised. Two to Eight Years. Analysis Manual. Oxford, UK: Hogrefe; 2006.
11. Tso WWY, Wong VCN, Xia X, et al. The Griffiths Development Scales‐Chinese (GDS‐C): a crosscultural comparison of developmental trajectories between Chinese and British children. Child Care Health Dev. 2018;44(3):378–383. doi:10.1111/cch.12548
12. Zhang JJ, Gao ZM, Xue H, Zhang CR, Zeng Y, Mao YY. The study of developmental diagnostic scale of children aged 0–4 years. Chin J Child Health Care. 1997;5(3):144–147.
13. Jin CH. Children Neuropsychological and Behavior Scale, Revision 2016. Beijing: Beijing press; 2016.
14. Randò T, Baranello G, Ricci D, et al. Cognitive competence at the onset of West syndrome: correlation with EEG patterns and visual function. Dev Med Child Neurol. 2005;47(11):760–765. doi:10.1017/S0012162205001593
15. Bromley RL, Mawer G, Love J, et al. Liverpool and Manchester Neurodevelopment Group: early cognitive development in children born to women with epilepsy: a prospective report. Epilepsia. 2010;51(10):2058–2065. doi:10.1111/j.1528-1167.2010.02668.x
16. Dittrich H, Bührer C, Grimmer I, Dittrich S, Abdul-Khaliq H, Lange PE. Neurodevelopment at 1 year of age in infants with congenital heart disease. Heart. 2003;89(4):436. doi:10.1136/heart.89.4.436
17. Chaudhary T, Walch E, Herold B, et al. Predictive and concurrent validity of standardized neurodevelopmental examinations by the Griffiths scales and Bayley scales of infant development II. Klin Padiatr. 2013;225(1):8–12. doi:10.1055/s-0032-1331169
18. Doyle LW, Davis PG, Schmidt B, Anderson PJ. Cognitive outcome at 24 months is more predictive than at 18 months for IQ years at 8–9 years in extremely low birth weight children. Early Hum Dev. 2012;88(2):95–98. doi:10.1016/j.earlhumdev.2011.07.013
19. Rellini E, Tortolani D, Trillo S, Carbone S, Montecchi F. Childhood autism rating scale (CARS) and autism behavior checklist (ABC) correspondence and conflicts with DSM-IV criteria in diagnosis of autism. J Autism Dev Disord. 2004;34(6):703–708. doi:10.1007/s10803-004-5290-2
20. Schopler E, Reichler RJ, DeVellis RF, Daly K. Toward objective classification of childhood autism: Childhood Autism Rating Scale (CARS). J Autism Dev Disord. 1980;10(1):91–103. doi:10.1007/BF02408436
21. Cirelli I, Bickle GM, Tolsa JF. Comparison of Griffiths-II and Bayley-II tests for the developmental assessment of high-risk infants. Infant Behav Dev. 2015;41:17–25. doi:10.1016/j.infbeh.2015.06.004
22. Evans JD. Straightforward Statistics for the Behavioral Sciences. Pacific Grove, CA: Brooks/Cole Publishing; 1996.
23. Lai MC, Lombardo MV, Baron-Cohen S. Autism. Lancet. 2014;383(9920):896–910. doi:10.1016/S0140-6736(13)61539-1
24. Mukherjee SB. Autism spectrum disorders-diagnosis and management. Indian J Pediatr. 2017;84(4):307–314. doi:10.1007/s12098-016-2272-2
25. Fombonne E. The prevalence of autism. JAMA. 2003;289(1):87–89. doi:10.1001/jama.289.1.87
26. Ousley O, Cermak T. Autism spectrum disorder: defining dimensions and subgroups. Curr Dev Disord Rep. 2014;1(1):20–28. doi:10.1007/s40474-013-0003-1
27. Sandberg AD, Nydén A, Gillberg C, Hjelmquist E. The cognitive profile in infantile autisma study of 70 children and adolescents using the Griffiths Mental Development Scale. Br J Psychol. 1993;84(Pt 3):365–373. doi:10.1111/j.2044-8295.1993.tb02488.x
28. Guo M, Zhu J, Yang T, et al. Vitamin A and viamin D deficiencies exacerbate symptoms in children with autism spectrum disorders. Nutr Neurosci. 2018;16:1–11. doi:10.1080/1028415X.2018.1558762
29. Squarza C, Picciolini O, Gardon L, et al. Seven years cognitive functioning and early assessment in extremely low birth weight children. Front Psychol. 2017;8:1257. doi:10.3389/fpsyg.2017.01257
 © 2019 The Author(s). This work is published and licensed by Dove Medical Press Limited. The
full terms of this license are available at https://www.dovepress.com/terms
and incorporate the Creative Commons Attribution
- Non Commercial (unported, 3.0) License.
By accessing the work you hereby accept the Terms. Non-commercial uses of the work are permitted
without any further permission from Dove Medical Press Limited, provided the work is properly
attributed. For permission for commercial use of this work, please see paragraphs 4.2 and 5 of our Terms.
© 2019 The Author(s). This work is published and licensed by Dove Medical Press Limited. The
full terms of this license are available at https://www.dovepress.com/terms
and incorporate the Creative Commons Attribution
- Non Commercial (unported, 3.0) License.
By accessing the work you hereby accept the Terms. Non-commercial uses of the work are permitted
without any further permission from Dove Medical Press Limited, provided the work is properly
attributed. For permission for commercial use of this work, please see paragraphs 4.2 and 5 of our Terms.