Back to Journals » Clinical Ophthalmology » Volume 14
Comparison of Macular Pigment Optical Density in Glaucoma Patients and Healthy Subjects – A Prospective Diagnostic Study
Authors Bruns Y ![]() , Junker B, Boehringer D, Framme C, Pielen A
, Junker B, Boehringer D, Framme C, Pielen A ![]()
Received 23 July 2019
Accepted for publication 27 February 2020
Published 1 April 2020 Volume 2020:14 Pages 1011—1017
DOI https://doi.org/10.2147/OPTH.S224259
Checked for plagiarism Yes
Review by Single anonymous peer review
Peer reviewer comments 2
Editor who approved publication: Dr Scott Fraser
Yannick Bruns,1,* Bernd Junker,1,* Daniel Boehringer,2 Carsten Framme,1 Amelie Pielen1
1University Eye Hospital, Hannover Medical School, Hannover 30625, Germany; 2Clinic for Ophthalmology, University of Freiburg Faculty of Medicine, Freiburg 79106, Germany
*These authors contributed equally to this work
Correspondence: Yannick Bruns
University Eye Hospital, Hannover Medical School, Carl-Neuberg-Str. 1, Hannover 30625, Germany
Tel +4915117677363
Email [email protected]
Purpose: To evaluate the relationship between macular pigment optical density (MPOD) and glaucoma.
Methods: Forty-three patients with an established glaucoma diagnosis (25 females, 18 males, mean age 70 (range 34– 84)) and 43 healthy controls (28 females, 15 males, mean age 62 (range 30– 87)) were included in this prospective diagnostic case-control study. All subjects underwent detailed eye examination including ophthalmoscopy, best-corrected visual acuity, biomicroscopy, measurement of the axial length of the eye, objective refraction, lens status, central foveal thickness on spectral-domain optical coherence tomography (SD-OCT). In all glaucoma patients, a visual field assessment and a measurement of the retinal nerve fibre layer (RNFL) on SD-OCT were done. MPOD was determined using the macula pigment module of the Spectralis HRA+OCT (Heidelberg Engineering GmbH, Heidelberg, Germany) at 0.51°, 1.02° and 1.99° retinal eccentricity using two-wavelength autofluorescence imaging.
Results: In the glaucoma group, the median of the visual field mean defect was 5.1 db (quartiles 3.0 and 13.5) and the mean RNFL-thickness global was 65.9 μm (SD ± 16.1). Median MPOD measured at 0.51°, 1.02° and 1.99° retinal eccentricity in the glaucoma group was 0.42 DU, 0.34 DU and 0.13 DU, in the control group 0.40 DU, 0.35 DU and 0.12 DU respectively. There was no statistically significant difference of median MPOD between glaucomatous and control eyes (p=0.510, 0.735, 0.481). No significant relation between MPOD at 1.02 retinal eccentricity and the presence of glare symptoms was found (p=0.948). However, age seems to correlate with median MPOD measured at 1.02 retinal eccentricity (p=0.017).
Conclusion: There was no evidence for lower MPOD levels in our glaucoma patients; lower MPOD was not related to the presence of glare symptoms. However there seems to be a positive correlation between age and MPOD at 1.02° retinal eccentricity. To further investigate the relation between glare reported by glaucoma patients and glare disability linked to lower MPOD levels, additional studies are necessary that include both detailed inquiry of the quality of glare and a glare quantification and precise analysis of MPOD levels in glaucoma patients.
Keywords: glaucoma, macular pigment optical density, glare, case-control study
Introduction
Macular pigment (MP) mainly consists of the three carotenoids lutein, zeaxanthin and mesozeaxanthin.1 Those carotenoids are said to prevent the retina from oxidative stress and damage by binding free oxygen radicals and they are able to reduce phototoxic damage to the retina by absorbing short wavelength light.2,3 The supplementation of these carotenoids has been shown in various studies to have an impact on the density of MP.4–6
MP was found in high concentrations in photoreceptor axons and in inner plexiform layers of the central fovea.7 MP is arranged in a symmetric circle around the central fovea and its concentration declines exponentially to optically undetectable levels with further eccentricity.8
Studies suggest declining levels of MP optical density (MPOD) with age and a positive relation to central foveal thickness.9,10 Additionally, MPOD seems to be positively correlated with the occurrence of diabetes and high body mass index.11,12
In addition to the mentioned protective feature, MP plays an important role in visual performance, especially under glare conditions.13,14 Studies have shown, that higher MPOD might be linked to decreased glare disability.15
Glaucoma affects more than 60 million people worldwide and is one of the world’s leading causes of blindness.16 In the course of the disease progressive retinal ganglion cell death can lead to irreversible vision loss.17 Patients suffering from glaucoma often report increasing disability glare with the progression of visual field defects.18 The cause of glare symptoms in glaucoma subjects is still poorly understood but the presence of glare in both glaucoma patients and subjects with lower MPOD might suggest a possible relation. Other glare-related diseases like age-related macular degeneration (AMD) and retinitis pigmentosa (RP) have already been screened for differing MPOD values. Only for AMD lower MPOD could be determined, in RP no difference was found.19,20
A study by Igras et al investigating the relationship between MPOD and chronic open angle glaucoma detected lower values for MPOD in the presence of glaucoma compared to controls.21 Our purpose in the present study is to verify these findings using the new macula pigment module of the Spectralis HRA+OCT 1.9.10.0 (Heidelberg Engineering GmbH, Heidelberg, Germany) in glaucoma patients and healthy controls and also to analyze further factors that are said to be linked to lower MPOD values.
Materials and Methods
Subjects
Forty-three patients with an established glaucoma diagnosis and forty-three controls were included in this prospective diagnostic case-control study. All patients gave their written informed consent and the procedures adhered to the tenets of the Declaration of Helsinki. Ethical approval was obtained from the Ethics Committee of Hannover Medical School (Ethics number 2601–2015). Inclusion criteria for the presence of glaucoma were a cup to disc ratio ≥0.5 as well as measurable visual field defects matching the typical glaucoma pattern. Exclusion criteria in both groups included a visual acuity <0.3 (decimal), the supplementation of lutein, zeaxanthin, mesozeaxanthin or carotenoids and the presence or history of macular retinal pathology.
All subjects underwent a detailed eye examination including biomicroscopy, best-corrected visual acuity (VA), ophthalmoscopy, measurement of the axial length of the eye, objective refraction, lens status, central foveal thickness on spectral-domain optical coherence tomography (SD-OCT), retinal nerve fibre layer (RNFL) analysis on SD-OCT (glaucoma group only) and visual field assessment (glaucoma group only). Axial length was determined with the IOL Master Advanced Technology V. 7.7.2.0242 (Carl Zeiss, Jena, Germany), objective refraction using the autorefractor Topcon KR-800S (TOPCON Deutschland GmbH, Willich, Germany). Visual field assessment was done using the Haag-Streit Octopus 900 G1-program (HAAG-STREIT DEUTSCHLAND GmbH, Wedel, Germany). The Heidelberg Spectralis HRA+OCT (Heidelberg Engineering GmbH, Heidelberg, Germany) was used for the measurement of the central foveal thickness and the RNFL thickness.
Additionally, demographic information of each subject was acquired including age, gender, body mass index (BMI), year of glaucoma diagnosis, previous and current glaucoma therapy, highest measured intraocular pressure, family history of glaucoma, presence of subjective glare symptoms (Do you suffer from glare? Yes or no?), history of smoking in packyears and the presence of diabetes mellitus.
Measurement of MPOD
MPOD measurement was performed in one eye per patient after pupil dilation. The right eye of each patient was selected if both eyes were eligible. If the right eye did not match the inclusion criteria, the left eye was examined. MPOD was determined using the macula pigment module of the Spectralis HRA+OCT (Heidelberg Engineering GmbH, Heidelberg, Germany) and the included Spectralis Viewing Module 6.3.4.0. With this device we measured MPOD at 0.51°, 1.02° and 1.99° retinal eccentricity using two-wavelength autofluorescence imaging which is further described in detail elsewhere.22,23 Different images were captured using wavelengths of 488nm (blue, well absorbed by MP) and 514nm (green, not well absorbed by MP). From this data MPOD maps could be generated by digital subtraction of both measurements and MPOD, expressed in optical density units (DU), was calculated using Heidelberg Eye Explorer software (HeyEx Software Version 1.9.10.0). Poor-quality maps were excluded from the analysis.
Statistical Analysis
Descriptive data are presented as median/quartiles for continuous factors and as percentages for non-continuous data. We used ANOVA to compare continuous baseline data and chi-square tests for non-continuous data between the study groups.
We fitted several linear regression models to assess the correlation between the pigmentation of the macula lutea (MPOD) and the covariates under investigation.
We performed logistic regression for the binary endpoint glare sensitivity analogously.
We visualized selective associations from the models by means of box-and-whiskers plots.
We used the R platform for all calculations.24
Results
In this study 43 glaucoma patients and 43 healthy controls were included. In the glaucoma group, most cases were chronic open angle glaucoma (n=33) while 6 cases of normal-tension glaucoma and 4 cases of pigment dispersion glaucoma were included. In this group 41.8% were male (n=18), in the control group 34.9% (n=15) were male. The study population characteristics can be found in Table 1. For age, gender, BMI, lens status, CFT and axial length there was no difference between the two groups (Table 1). Glaucoma patients presented a significantly decreased VA, a higher percentage of pseudophakic eyes and an altered cup-disc-ratio (CDR) compared to controls (Table 1).
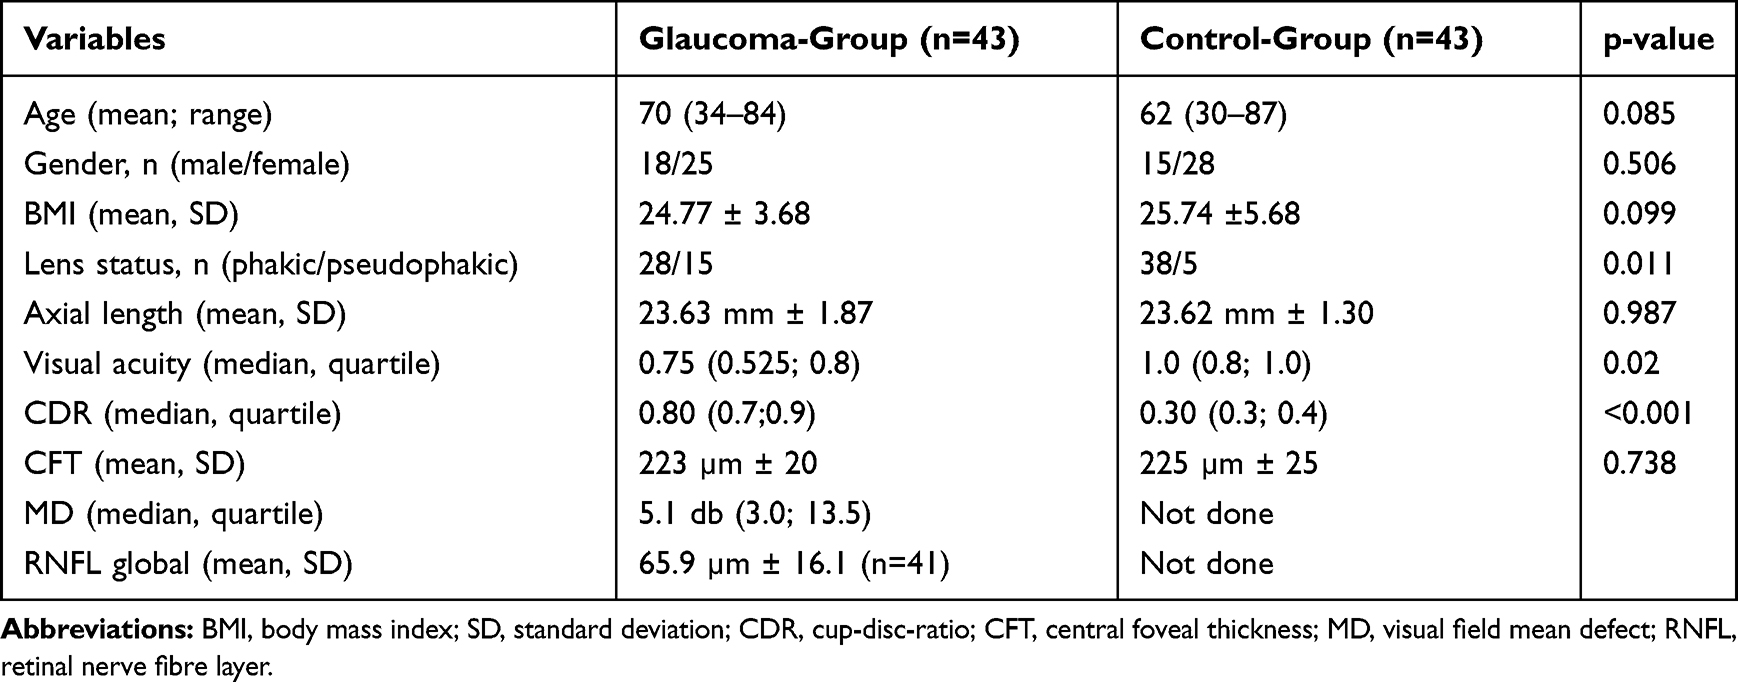 |
Table 1 Characteristics of the Study Population |
In both groups, similar amounts of subjects reported glare symptoms (glaucoma: n=24; controls: n=26). In the glaucoma group 32 subjects had their right eye, 11 subjects their left eye examined. In the controls 22 right eyes and 21 left eyes were tested. 13 of the glaucoma patients and 9 controls reported a regular smoking habit with more than 10 packyears. Diabetes mellitus was present in 6 patients of the glaucoma group and in 5 controls.
Median MPOD measured at 0.51°, 1.02° and 1.99° retinal eccentricity in the glaucoma group was 0.42 DU, 0.34 DU and 0.13 DU, in the control group 0.40 DU, 0.35 DU and 0.12 DU respectively. In a multifactorial linear model, there was no statistically significant difference of median MPOD between glaucomatous and control eyes (p=0.510, 0.735, 0.481). In this model, gender, lens status and VA also had no statistically significant effect on MPOD at all measured retinal eccentricities (Table 2). Lens status and VA were included as co-factors in this analysis because of the differences between the study groups. However, age seems to correlate with median MPOD measured at 1.02 retinal eccentricity (p=0.017). This is shown in Figure 1.
 |
Table 2 Three Multiple Linear Regression Models to Assess the Correlation Between Presence of Glaucoma, Age, Sex, Lens Status, MPOD at 0.51°, 1.02° and 1.99° Retinal Eccentricity |
 |
Figure 1 Correlation of average macular pigment optical density (MPOD) at 1.02° retinal eccentricity, glaucoma disease and age. MPOD is positively correlated with age (see Table 2). |
In a second multifactorial linear model the correlation between glare and the variables median MPOD at 1.02° retinal eccentricity, age, gender, lens status, visual acuity and the presence of glaucoma disease was analyzed (Table 3). Only the visual acuity has a statistically significant effect (p = 0.0254) on the presence of glare with an odds ratio of 0.011 (the better the VA the higher the absence of glare). Glaucoma could not be linked to a higher number of subjects suffering glare in our population (p=0.267). In both glaucoma and control group the presence of glare symptoms is not statistically significantly correlated with MPOD. Figure 2 shows the data for 1.02° eccentricity as an example.
 |
Table 3 Logistic Regression Model to Assess the Correlation of Glare Symptoms with the Co-Variates Glaucoma, Age, Sex, Lens Status, MPOD at 1.02° Retinal Eccentricity |
 |
Figure 2 Correlation of av. MPOD 1.02°, glaucoma disease and glare symptoms. No statistically significant correlation between glare symptoms and MPOD at 1.02° retinal eccentricity in both groups. |
Discussion
The two wavelengths method is well-recognized as a tool to precisely measure MPOD levels and has been used in previous studies for analyzing MPOD.25–27 Findings of a different study by Igras et al using heterochromatic flicker photometry showed significantly lower levels of MPOD in glaucoma patients.21 Though median MPOD levels measured at 0.51° retinal eccentricity in our setting (0.35 DU) are comparable to obtained levels at the same retinal eccentricity in their study (0.36 DU), an association between the presence of glaucoma and MPOD could not be confirmed.
We excluded the supplementation of lutein, zeaxanthin or mesozeaxanthin, which is known to effect MPOD, in both groups, thus not influencing the outcome of our measures.5 Unlike the previously mentioned study, dietary carotenoid intake in general was also considered an exclusion criterion. Other potentially influencing factors like age, gender, diabetes mellitus and smoking habit did not show statistically significant differences between both groups.
Hammond et al described a possible relation between MPOD and BMI.12 Obese subjects tended to have reduced MPOD, possibly either due to reduced intake of lutein and zeaxanthin or adipose tissue competing with the retina for uptake of carotenoids. Given this possible relation the BMI of all subjects was determined in our study and there was no statistically significant difference between both groups. Analysis showed no correlation between MPOD and BMI as a covariate.
The impact of subjects age on MPOD has been investigated in various studies. While Bone et al found no significant correlation between age and MPOD in donor eyes using high performance liquid chromatography, studies performed by Beatty et al suggested a negative correlation between MPOD and age using heterochromatic flicker photometry.28,29 In contrast, we found an age-related increase in MPOD at 1.02° eccentricity within our study population, but not at 0.51° and 1.99°.
The glare hypothesis of Stringham et al suggests a relation between MPOD and the presence of glare symptoms.15 Glare disability at 440nm and 460nm appeared to correlate significantly with lower levels of MPOD, while wavelengths of 550nm and 620nm did not. This effect was explained with the relatively higher absorption of wavelength within the range of 400 to 500nm in MP. In our study this statistically significant correlation could not be reproduced. One explanation might be the difference in the inquiry of glare symptoms. In this study, the presence of glare symptoms was determined by asking the subjects if they suffered from glare symptoms in their daily routine. No quantification or particular differentiation of glare disability in dependence on varying wavelengths were made. Another major difference between the study of Stringham et al and our study design was the different degree of retinal eccentricity where MPOD was measured. Stringham et al chose 0°, 2°, 4°, 6° and 8° retinal eccentricity including ranges where MPOD decreases to very low levels. Because of those very low MPOD levels we did not measure MPOD beyond 2° of retinal eccentricity.
The potential role of MPOD as protection of the retina from oxidative damage by filtering potential actinic light makes the relation between lower MPOD and higher glare disability due to a reduced filtering a reasonable explanation. This relation has also been shown in the studies of Hammond et al and Putnam/Bassi.30,31
In our study a similar number of subjects in the glaucoma and in the control group suffered from glare symptoms. Given the above-mentioned relation between disability glare and MPOD, the similar presence of glare symptoms in both groups could be caused by the similar levels of MPOD in both groups.
Shortcomings of our study are the limited number of subjects and the non-quantification of disability glare.
In conclusion, there was no evidence for lower MPOD levels and no increased glare disability in our glaucoma patients. However there seems to be a positive correlation between age and MPOD at 1.02° eccentricity. Lens status and VA, which were significantly different between the study groups, had no effect on MPOD levels at all eccentricities. To further investigate the relation between glare reported by glaucoma patients and glare disability linked to lower MPOD levels, additional studies are necessary that include both detailed inquiry of the quality of glare and a glare quantification and precise analysis of MPOD levels in glaucoma patients.
Ethics Approval
The procedures adhered to the tenets of the Declaration of Helsinki. Ethical approval was obtained from the Ethics Committee of Hannover Medical School (Ethics number 2601-2015).
Informed Consent
Written informed consent was obtained from all individual participants included in the study.
Disclosure
Amelie Pielen reports grants from Niedersachsen Vorab, during the conduct of the study. The authors declare that they have no other conflicts of interest in this work.
References
1. Snodderly DM, Auran JD, Delori FC. The macular pigment. II. Spatial distribution in primate retinas. Invest Ophthalmol Vis Sci. 1984;25(6):674–685.
2. Schalch W. Carotenoids in the retina–a review of their possible role in preventing or limiting damage caused by light and oxygen. EXS. 1992;62:280–298. doi:10.1007/978-3-0348-7460-1_29
3. Khachik F, Bernstein PS, Garland DL. Identification of lutein and zeaxanthin oxidation products in human and monkey retinas. Invest Ophthalmol Vis Sci. 1997;38(9):1802–1811.
4. Connolly EE, Beatty S, Thurnham DI, et al. Augmentation of macular pigment following supplementation with all three macular carotenoids: an exploratory study. Curr Eye Res. 2010;35(4):335–351. doi:10.3109/02713680903521951
5. Ma L, Liu R, Du JH, et al. Lutein, zeaxanthin and meso-zeaxanthin supplementation associated with macular pigment optical density. Nutrients. 2016;8(7):426. doi:10.3390/nu8070426
6. Bone RA, Landrum JT, Dixon Z, et al. Lutein and zeaxanthin in the eyes, serum and diet of human subjects. Exp Eye Res. 2000;71(3):239–245. doi:10.1006/exer.2000.0870
7. Beatty S, Boulton M, Henson D, et al. Macular pigment and age related macular degeneration. Br J Ophthalmol. 1999;83(7):867–877. doi:10.1136/bjo.83.7.867
8. Hammond BR, Wooten BR, Snodderly DM. Individual variations in the spatial profile of human macular pigment. JOSA A. 1997;14(6):1187–1196. doi:10.1364/JOSAA.14.001187
9. Obana A, Gohto Y, Tanito M, et al. Effect of age and other factors on macular pigment optical density measured with resonance Raman spectroscopy. Graefes Arch Clin Exp Ophthalmol. 2014;252(8):1221–1228. doi:10.1007/s00417-014-2574-x
10. Van der Veen R, Ostendorf S, Hendrikse F, Berendschot T. Macular pigment optical density relates to foveal thickness. Eur J Ophthalmol. 2008;19(5):836–841. doi:10.1177/112067210901900524
11. Dharmadhikari S, Lohiya K, Chelkar V, et al. Magnitude and determinants of glaucoma in type II diabetics: a hospital based cross-sectional study in Maharashtra, India. Oman J Ophthalmol. 2015;8(1):19–23. doi:10.4103/0974-620X.149858
12. Hammond BR, Ciulla TA, Snodderly DM. Macular pigment density is reduced in obese subjects. Invest Ophthalmol Vis Sci. 2002;43(1):47–50.
13. Nolan JM, Loughman J, Akkali MC, et al. The impact of macular pigment augmentation on visual performance in normal subjects: COMPASS. Vision Res. 2011;51(5):459–469. doi:10.1016/j.visres.2010.12.016
14. Loughman J, Akkali MC, Beatty S, et al. The relationship between macular pigment and visual performance. Vision Res. 2010;50(13):1249–1256. doi:10.1016/j.visres.2010.04.009
15. Stringham JM, Hammond BR. The glare hypothesis of macular pigment function. Optom Vis Sci. 2007;84(9):859–864. doi:10.1097/OPX.0b013e3181559c2b
16. Quigley HA, Broman AT. The number of people with glaucoma worldwide in 2010 and 2020. Br J Ophthalmol. 2006;90(3):262–267. doi:10.1136/bjo.2005.081224
17. Gupta N, Yücel YH. Glaucoma as a neurodegenerative disease. Curr Opin Ophthalmol. 2007;18(2):110–114. doi:10.1097/ICU.0b013e3280895aea
18. Nelson P, Aspinall P, O’Brien C. Patients’ perception of visual impairment in glaucoma: a pilot study. Br J Ophthalmol. 1999;83(5):546–552. doi:10.1136/bjo.83.5.546
19. Raman R, Biswas S, Vaitheeswaran K, Sharma T. Macular pigment optical density in wet age-related macular degeneration among Indians. Eye. 2012;26(8):1052–1057. doi:10.1038/eye.2012.86
20. Alexander KR, Kilbride PE, Fishman GA, Fishman M. Macular pigment and reduced foveal short-wavelength sensitivity in retinitis pigmentosa. Vision Res. 1987;27(7):1077–1083. doi:10.1016/0042-6989(87)90022-8
21. Igras E, Loughman J, Ratzlaff M, et al. Evidence of lower macular pigment optical density in chronic open angle glaucoma. Br J Ophthalmol. 2013;97(8):994–998. doi:10.1136/bjophthalmol-2013-303153
22. Trieschmann M, Beatty S, Nolan JM, et al. Changes in macular pigment optical density and serum concentrations of its constituent carotenoids following supplemental lutein and zeaxanthin: the LUNA study. Exp Eye Res. 2007;84(4):718–728. doi:10.1016/j.exer.2006.12.010
23. Trieschmann M, Heimes B, Hense HW, Pauleikhoff D. Macular pigment optical density measurement in autofluorescence imaging: comparison of one- and two-wavelength methods. Graefes Arch Clin Exp Ophthalmol. 2006;244(12):1565–1574. doi:10.1007/s00417-006-0289-3
24. R Core Team. R: A language and environment for statistical computing. R foundation for statistical computing, Vienna, Austria. 2016;https://www.R-project.org/.
25. Zeimer MB, Spital G, Heimes B, et al. Macular telangiectasia–changes in macular pigment optical density during a 5-year follow-up. Retina. 2014;34(5):920–928. doi:10.1097/IAE.0000000000000023
26. Zeimer MB, Krömer I, Spital G, et al. Macular telangiectasia: patterns of distribution of macular pigment and response to supplementation. Retina Phila Pa. 2010;30(8):1282–1293. doi:10.1097/IAE.0b013e3181e096dd
27. Dietzel M, Zeimer M, Heimes B, et al. The ringlike structure of macular pigment in age-related maculopathy: results from the Muenster Aging and Retina Study (MARS). Invest Ophthalmol Vis Sci. 2011;52(11):8016–8024. doi:10.1167/iovs.11-7610
28. Bone RA, Landrum JT, Fernandez L, Tarsis SL. Analysis of the macular pigment by HPLC: retinal distribution and age study. Invest Ophthalmol Vis Sci. 1988;29(6):843–849.
29. Beatty S, Murray IJ, Henson DB, et al. Macular pigment and risk for age-related macular degeneration in subjects from a Northern European population. Invest Ophthalmol Vis Sci. 2001;42(2):439–446.
30. Hammond BR, Fletcher LM, Elliott JG. Glare disability, photostress recovery, and chromatic contrast: relation to macular pigment and serum lutein and zeaxanthin. Invest Ophthalmol Vis Sci. 2013;54(1):476–481. doi:10.1167/iovs.12-10411
31. Putnam CM, Bassi CJ. Macular pigment spatial distribution effects on glare disability. J Optom. 2015;8(4):258–265. doi:10.1016/j.optom.2014.12.004
 © 2020 The Author(s). This work is published and licensed by Dove Medical Press Limited. The
full terms of this license are available at https://www.dovepress.com/terms
and incorporate the Creative Commons Attribution
- Non Commercial (unported, 3.0) License.
By accessing the work you hereby accept the Terms. Non-commercial uses of the work are permitted
without any further permission from Dove Medical Press Limited, provided the work is properly
attributed. For permission for commercial use of this work, please see paragraphs 4.2 and 5 of our Terms.
© 2020 The Author(s). This work is published and licensed by Dove Medical Press Limited. The
full terms of this license are available at https://www.dovepress.com/terms
and incorporate the Creative Commons Attribution
- Non Commercial (unported, 3.0) License.
By accessing the work you hereby accept the Terms. Non-commercial uses of the work are permitted
without any further permission from Dove Medical Press Limited, provided the work is properly
attributed. For permission for commercial use of this work, please see paragraphs 4.2 and 5 of our Terms.