Back to Journals » Infection and Drug Resistance » Volume 11
Comparison of five commonly used automated susceptibility testing methods for accuracy in the China Antimicrobial Resistance Surveillance System (CARSS) hospitals
Authors Zhou ML ![]() , Wang Y
, Wang Y ![]() , Liu C, Kudinha T
, Liu C, Kudinha T ![]() , Liu X, Luo Y, Yang QW, Sun H, Hu J, Xu YC
, Liu X, Luo Y, Yang QW, Sun H, Hu J, Xu YC ![]()
Received 27 February 2018
Accepted for publication 15 May 2018
Published 30 August 2018 Volume 2018:11 Pages 1347—1358
DOI https://doi.org/10.2147/IDR.S166790
Checked for plagiarism Yes
Review by Single anonymous peer review
Peer reviewer comments 3
Editor who approved publication: Dr Joachim Wink
Menglan Zhou,1–3 Yao Wang,1,3 Chang Liu,1–3 Timothy Kudinha,4 Xiaolin Liu,5,6 Yanping Luo,7 Qiwen Yang,1,3,6 Hongli Sun,1,3,6 Jihong Hu,8 Ying-Chun Xu1,3,6
1Department of Clinical Laboratory, Peking Union Medical College Hospital, Peking Union Medical College, Chinese Academy of Medical Sciences, Beijing, China; 2Graduate School, Peking Union Medical College, Chinese Academy of Medical Sciences, Beijing, China; 3Beijing Key Laboratory for Mechanisms Research and Precision Diagnosis of Invasive Fungal Diseases, Beijing, China; 4Department of Clinical Laboratory, Charles Sturt University, Leeds Parade, Orange, New South Wales, Australia; 5National Health and Family Planning Commission Expert Committee for Clinical Use of Antibiotics and Assessment of Bacterial Resistance, Beijing, China; 6Quality Management Center of China Antimicrobial Resistance Surveillance System (CARSS), Beijing, China; 7Department of Clinical Laboratory, Chinese PLA General Hospital, Beijing, China; 8National Center for Clinical Laboratories, Beijing Hospital, National Center of Gerontology, Beijing, China
Objective: The objective of this study was to evaluate the performance of five commonly used automated antimicrobial susceptibility testing (AST) systems in China (Vitek 2, Phoenix, Microscan, TDR, and DL).
Materials and methods: Two “unknown” isolates, S1 (ESBL-producing Escherichia coli) and S2 (KPC-producing Klebsiella pneumoniae), were sent to 886 hospitals in China for identification and AST. Using broth microdilution method (BMD) as gold standard, minimum inhibitory concentrations (MICs) were determined.
Results: Most hospitals (392, 46.1%) used Vitek 2, followed by 16% each for Phoenix, Microscan, and DL systems, and 5.9% (50) used TDR system. MICs of 22 antimicrobials were evaluated for two study isolates plus three ATCC strains. Individual susceptibility results for three ATCC strains (n=1581) were submitted by 780 (91.2%) hospitals. For each AST system, 8.7% (6/69) to 13.0% (33/253) reported MICs outside the expected range for several drugs. For the two study isolates, TDR and DL systems performed the worst in MIC determination and susceptibility categorization of cefazolin and cefepime, while the Microscan system had difficulties in susceptibility categorization for aztreonam and ertapenem. Categorical agreements were >90% for most antimicrobials tested for both the isolates, among which, using BMD, no essential agreements were noted for ampicillin, piperacillin, cefazolin, cefuroxime, ceftriaxone, and trimethoprim/sulfamethoxazole. All AST systems except Vitek 2 showed unacceptable VMEs for cefazolin (S1 and S2) and major errors for ceftazidime, cefepime, and aztreonam (isolate S1), while Vitek 2 showed a high VME rate for cefepime (10.0%) and meropenem (6.2%) for S2.
Conclusion: None of the five automated systems met the criteria for acceptable AST performance, but Vitek 2 provided a relatively accurate and conservative performance for most of the antimicrobials.
Keywords: automated susceptibility testing, accuracy, evaluation, CARSS
Introduction
Global antimicrobial surveillance programs have provided important epidemiological and antimicrobial susceptibility data for bacterial infections.1,2 In August 2005, the multicentre nationwide China Antimicrobial Resistance Surveillance System (CARSS), which analyzes routine antimicrobial susceptibility data from participating hospitals and develops a quarterly report, was established. Since then, the program has provided important information on the antimicrobial susceptibility patterns of common clinical bacteria in China. Of late, the CARSS program has experienced a dramatic increase in the number of participating hospitals, which currently stands at 1427 in 31 provinces. However, this increase has brought challenges to the program, including concerns about the quality of data submitted by the hospitals due to differences in antimicrobial susceptibility testing (AST) methods and standards.
The choice of which AST method to use in clinical laboratories is mainly dependent on financial resources, labor efficiency, and workload of the laboratory itself.3 Other considerations include cost of equipment and reagents, ease of performance of the technique, flexibility in selection of drugs for testing, maneuverability of automated or semi-automated devices, and the veracity of the methodology.4 In addition, due to the increase in incidence and severity of bacterial infections, the need for more rapid and accurate methods for AST has never been greater.5 To this end, the development of a fully automated AST system is a major advancement, which significantly reduces scientists’ hands-on time, turnaround time, and variability, by using a standard operating procedure.6 Currently, there are five commonly used AST systems in China, including Vitek 2 (bioMérieux, Marcy-l’Étoile, France), Phoenix (Becton Dickinson Diagnostics, Sparks, MD, USA), MicroScan (Beckman Coulter, Brea, CA, USA), Tiandiren (Mindray TianDiRen, Changsha, China), and Dier (Zhuhai DL, Zhuhai, China). Therefore, to ensure accuracy and comparability of antimicrobial susceptibility data collected in the CARSS program, we studied the distribution and use of automated AST systems at each participating hospital.
Specifically, we evaluated the performance of five AST systems in CARSS participating hospitals, by using minimum inhibitory concentration (MIC) determination of several antimicrobials (including β-lactams, aminoglycosides, macrolides, lincosamides, quinolones, glycopeptides, and sulfonamides), against two isolates (Escherichia coli and Klebsiella pneumoniae), to monitor and improve the accuracy of the susceptibility data.
Materials and methods
Study design
This study evaluated the performance of five commonly used automated AST systems in China, including Vitek 2 (bioMérieux), Phoenix (Becton Dickinson Diagnostics), MicroScan (Beckman Coulter), TDR (Mindray TianDiRen) and DL (Zhuhai DL), among 886 hospitals in the CARSS program (2015–2016). MICs for two “unknown” isolates determined by each of the AST systems were compared with the reference method, broth microdilution method (BMD; Clinical Laboratory Standards Institute [CLSI]), which was only performed at three central laboratories – Peking Union Medical College Hospital (PUMCH), National Center for Clinical Laboratories, and Chinese PLA General Hospital.7
Test organisms
As part of a series of studies designed to ensure uniformity and quality of AST results for the CARSS program, two Gram-negative “unknown” isolates, named S1 (extended-spectrum beta-lactamase [ESBL]-producing E. coli) and S2 (carbapenemase-producing K. pneumoniae), obtained from routinely cultured bacteria at one of the central laboratories (PUMCH, Beijing, China), were copied and concurrently sent to 886 hospitals in 31 provinces of China (Figure 1) for identification and AST. The study was carried out in accordance with the institute’s guidelines and procedures, including ethics approval by the Human Research Ethics Committee and obtaining written informed consent from the patients involved. Each participating hospital was directed to use the most commonly used automated AST system, including relevant quality control (QC) strains, on the two isolates. Results were to be reported within a specified time period. QC strains used for BMD at the central laboratories were the CLSI-recommended American Type Culture Collection (ATCC) strains; E. coli ATCC 25922, E. coli ATCC 35218, and Pseudomonas aeruginosa ATCC 27853.
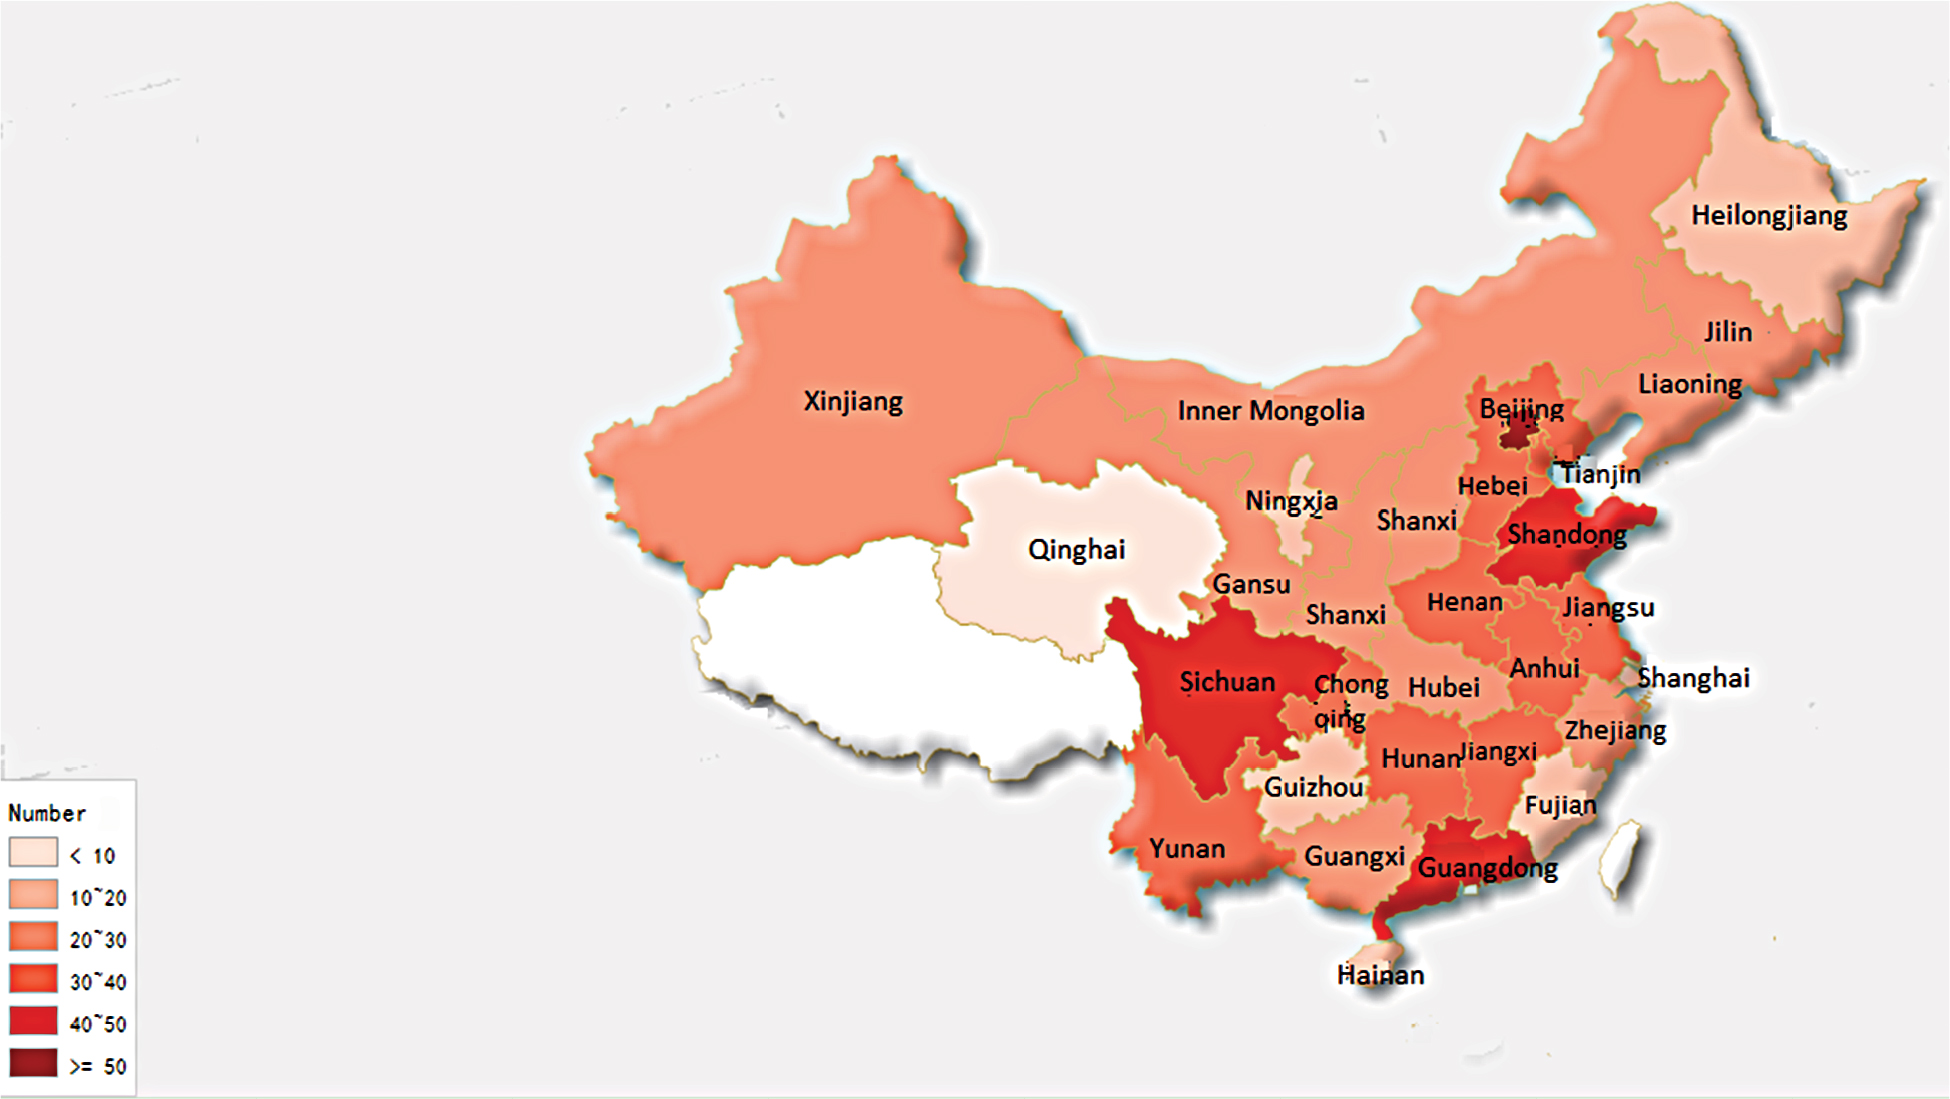 | Figure 1 Geographic distribution of participating hospitals in the China Antimicrobial Resistance Surveillance System (CARSS) study. |
MIC determination
MICs of several antimicrobial drugs against each of the two “unknown” isolates were determined at each participating hospital using the available AST system, as per manufacturers’ instructions.6 BMD MIC testing was performed in the three central laboratories according to the latest CLSI guidelines, using in-house prepared panels.7 The panels were incubated at 35°C in ambient air and read manually following 16–20 hours of incubation. The MIC of each antimicrobial agent was defined as the lowest concentration that inhibited visible growth of the organism.
Data analysis
Due to differences in CLSI versions used in each AST system, all data from each hospital were imported into WHONET 5.6 software and interpreted according to CLSI 2017 breakpoints at PUMCH, to ensure uniformity.8 BMD results were considered the reference standard. Essential agreement (EA) was defined as percentage of MICs within a single doubling dilution of the corresponding BMD result. Categorical agreement (CA) was the proportion of isolates classified in the same susceptibility category by BMD and the method under evaluation. AST error rates were calculated and reported as follows: very major error (VME, false susceptible result or an inability to detect resistance); major error (ME, false “resistant” result); and minor error (mE, an intermediate result reported as either susceptible or resistant and vice versa). According to CLSI recommendations, the acceptable inter-method VME, ME, and mE rates are 1.5%, 3%, and 10%, respectively.9
Results
An overwhelming majority (96.0%; 851/886) of the hospitals returned results within the specified time frame, among which 392 (46.1%) used Vitek 2, and 146 (17.2%), 133 (15.6%), 130 (15.3%), and 50 (5.9%) used Phoenix, Microscan, DL, and TDR systems, respectively (Table S1). The remaining 35 (4.0%) hospitals did not return results on time and were excluded. Both the “unknown” isolates were correctly identified by all the participating hospitals. Based on the antibiotics tested by each system, 22 antibiotics (Table 1) were analyzed. However, due to differences in AST cards, not all drugs were reported by each system. For example, susceptibilities to amoxicillin/clavulanic acid (AMC), cefotetan (CTT), ertapenem (ETP), imipenem (IPM), and nitrofurantoin (NIT) were not reported by TDR system; susceptibilities to cefuroxime (CXM), CTT, ETP, tobramycin (TOB), and NIT were not reported by Phoenix system; and susceptibilities to CTT, ETP, and TOB were not reported by DL system.
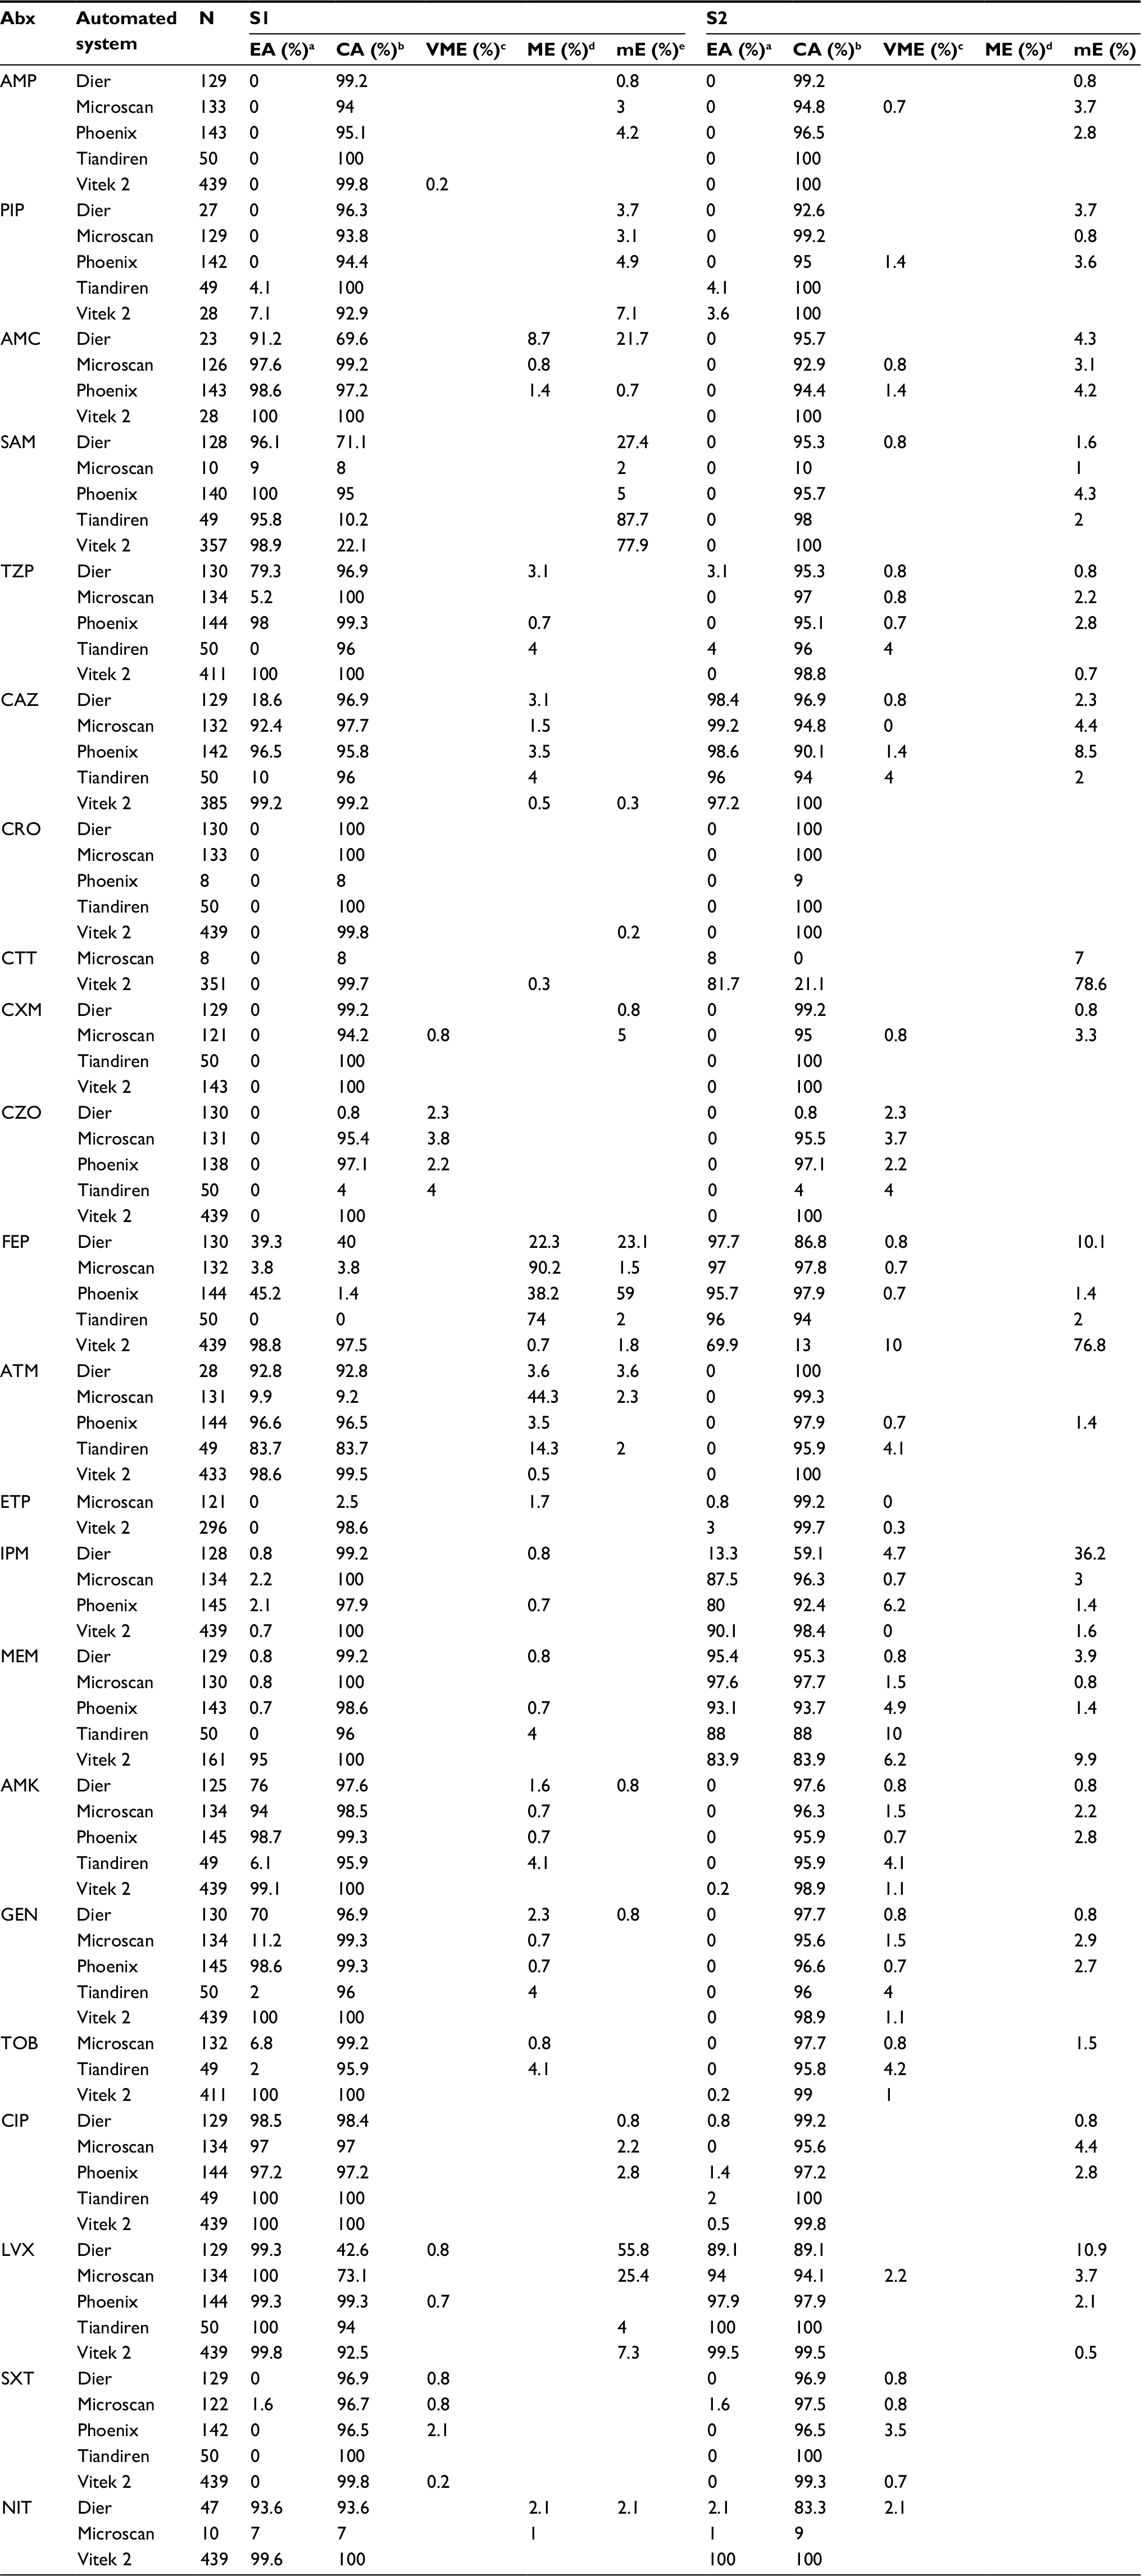
 | Table 1 Susceptibility results of three quality control strains for each antibiotic reported by five individual automated systems as interpreted by CLSI 2017 Notes: aTotal number of individual susceptibility results obtained from hospitals for three QC strains for each antibiotic tested. bSusceptibility category not determinable: as interpreted using CLSI 2017 breakpoints. Abbreviations: CLSI, Clinical Laboratory Standards Institute; MIC, minimum inhibitory concentration; AMP, ampicillin; PIP, piperacillin; AMC, amoxicillin/clavulanic acid; SAM, ampicillin/sulbactam; TZP, piperacillin/tazobactam; CZO, cefazolin; CXM, cefuroxime; CAZ, ceftazidime; CRO, ceftriaxone; FEP, cefepime; CTT, cefotetan; ATM, aztreonam; ETP, ertapenem; IPM, imipenem; MEM, meropenem; AMK, amikacin; GEN, gentamicin; TOB, tobramycin; CIP, ciprofloxacin; LVX, levofloxacin; SXT, trimethoprim/sulfamethoxazole; NIT, nitrofurantoin; QC, quality control. |
Susceptibility results of QC strains reported by five automated systems using CLSI 2017 breakpoints
In total, 1581 individual MIC results for three ATCC strains were submitted by 780 (91.2%; 780/851) hospitals, with one (121, 14.2%), two (517, 60.5%) or three (142, 16.6%) ATCC strain results at the same time; the remaining 71 (8.3%) hospitals did not report any QC results due to various reasons (data not shown). The reported MICs were analyzed according to the CLSI 2017 M100S document.8 For the three QC strains reported in the study, only drugs with specified MIC reference ranges as per the CLSI 2017 document8 were analyzed. Most results were from Vitek 2 which was used by more laboratories (Table S2). Likewise, the least number (4.4%, 69) of results came from the TDR system. About 50% of the results were from Phoenix, Microscan, and DL systems, averaging 15.9% each (range 14.4%–17.3%).
Overall, results outside the reference MIC range for the three ATCC strains were reported in about 10.3% of the cases (range 8.7%–13.0%) in the five systems; highest (13.0%) was in Microscan, and the lowest (8.7%) in TDR (Table S3). The TDR system performed the best in accurately determining MIC values of the QC strains, with expected MIC values in 64.7% (11/17) of the cases (Tables S4–S8). The highest rate of MICs outside the reference range for the three ATCC strains was observed in trimethoprim/sulfamethoxazole (SXT) (3.6%; range, 2.3% [Phoenix] to 6.1% [Microscan]; Tables 1 and S3–S8). However, most MIC results from the AST systems were categorized as “not determinable” as the MICs given were not a specific value and thus could not be discriminated using the CLSI 2017 breakpoints. This was especially common in amikacin (AMK) (≥92.2% in each of the five systems), piperacillin/tazobactam (TZP) (≥90.2% in each), gentamicin (GEN) (≥92.6% in each), cefazolin (CZO) (≥85.8% in each), cefepime (FEP) (≥85.7%) and ciprofloxacin (CIP) (≥ 85.7% in each; Tables 1 and S4–S8).
Susceptibilities by BMD at central laboratories
Contrary to the poor performance of the AST systems in MIC determination of the three QC strains, the BMD method yielded excellent results, with all MICs (100%) in the expected reference ranges. Moreover, MICs of the two study isolates (S1 and S2) for several antimicrobials, as performed by each of the three central laboratories, were 100% in agreement (Table S9). S1 showed susceptibility or intermediate susceptibility to most of the antimicrobials except ampicillin (AMP), piperacillin (PIP), CZO, CXM, ceftriaxone (CRO), CIP, levofloxacin (LVX), and SXT, while S2 exhibited resistance to all the antibiotics, with intermediate susceptibility to only CTT.
Comparison of susceptibility profiles of the two study isolates for five automated systems
MICs of the two study isolates (S1 and S2) were interpreted and categorized using CLSI 2017 breakpoints via WHONET 5.6, a Windows-based database software.8 Data were analyzed and presented as percentages except in instances when the numbers were low (<10) (Table 2). Apart from the three commonly used susceptibility categories of resistant (R), intermediate susceptible (I), and susceptible (S), three additional categories of “R?”, “S?” and “non-susceptible (NS)” were generated. This was because the MICs given by each automated system could not be classified precisely as R/I/S according to CLSI 2017 breakpoints, mainly due to the drawbacks of the system itself.
 | Table 2 Antimicrobial susceptibility profiles of two CARSS isolates (S1 and S2) for five individual automated systems as per CLSI 2017 guidelines Notes: aDier and Tiandiren systems performed poorly in MIC categorization of CZO for both S1 and S2 isolates, with ≥92% of the results categorized as “R?.” bThe Microscan system had difficulties in susceptibility categorization of ETP, followed by ATM, for isolate S1, with 95.9% (116/121) and 43.5% (57/131) of the results categorized as “S?” when applying the CLSI 2017 breakpoints. cThe Phoenix system had overall lower percentages of uncategorized MICs for each antibiotic. About 53% (9/17) and 23.5% (4/17) of the antimicrobials tested had various uncategorized problems for both S1 and S2 isolates, respectively. Bold text represents the percentages of MICs that could not be classified precisely by each system. Abbreviations: CARSS, China Antimicrobial Resistance Surveillance System; CLSI, Clinical Laboratory Standards Institute; R, resistant; I, intermediate susceptible; S, susceptible; NS, non-susceptible; Abx, antibiotic; AMP, ampicillin; PIP, piperacillin; AMC, amoxicillin/clavulanic acid; SAM, ampicillin/sulbactam; TZP, piperacillin/tazobactam; CAZ, ceftazidime; CTT, cefotetan; CXM, cefuroxime; CZO, cefazolin; FEP, cefepime; ATM, aztreonam; ETP, ertapenem; IPM, imipenem; MEM, meropenem; AMK, amikacin; GEN, gentamicin; CIP, ciprofloxacin; LVX, levofloxacin; SXT, trimethoprim/sulfamethoxazole; NIT, nitrofurantoin; MIC, minimum inhibitory concentration. |
For instance, ≥92% of the results from hospitals using the DL and TDR systems reported an MIC of >4 for CZO on isolate S1, leading to the category of “R?” as per the CLSI 2017 breakpoints of “S≤16, R≥32”. Likewise, 14.6%, 24%, 4.5%, and 1.4% of the results from hospitals using DL, TDR, Microscan, and Phoenix systems, respectively, reported an MIC of ≤8 or ≤4 for FEP on isolate S1, which was categorized as “S?” as per CLSI 2017 breakpoints of “S≤2, R≥16.” And finally, for MIC results categorized as “NS” by CLSI 2017 breakpoints, the MICs were all reported as “> susceptible cut-off value” due to system inability to differentiate between “I” and “R.” For example, the CLSI 2017 breakpoints for NIT are “S≤32, R≥128,” yet 14.6% (7/48) of the DL system results were reported as MIC of >32 for isolate S2, which was consequently interpreted as “NS” (Table 2).
Overall, Vitek 2 performed the best as it correctly categorized MICs of most antibiotics tested (20/22; 90.9%) for isolate S1, followed by TDR (76.5%; 13/27). In contrast, Phoenix and Microscan systems only correctly categorized about 46% each of the antibiotics tested. For isolate S2, Vitek 2 (86.4%; 19/22) and TDR (82.4%; 14/17) systems still performed better than others (Table 2). For isolate S1, ESBL interpretation was reported in ≥83.6% of Microscan, DL, and Phoenix results, and only 18.0% of TDR users (Table S1).
Performance characteristics (MIC agreements and errors) amongst five automated systems
The overall performance characteristics of each AST system are shown in Table 3. For isolate S1, all systems showed a CA >90% for most of the antibiotics. Similar findings were reported for isolate S2, except for CZO (DL 0.8%, TDR 4%), FEP (Vitek 2 13.0%), and IPM (DL 59.1%). However, despite the above, considerable discrepancies in EA still existed. EAs were nearly zero for both the study isolates in all the AST systems for several antibiotics, though with high CA percentages (Table 3). For example, the MICs of these antibiotics were either too high (MIC >256 for AMP, PIP) or too low (MIC of 0.03 for ETP) for isolate S1, but still qualified the classification criteria, though the MIC could go beyond the concentration range within each automated AST system, leading to a relatively high CA along with an extremely low EA.
 | Table 3 Comparison of overall performance characteristics between each of the five automated systems and broth microdilution for the two CARSS isolates Notes: aEA (%), percentage of MICs within a single doubling dilution of the MIC result determined by BMD. bCA (%), percentage of isolates classified in the same susceptibility category by BMD and the method under evaluation. cVME (%), false susceptible result or an inability to detect resistance. dME (%), false “resistant” result. emE (%), an intermediate result reported as either susceptible or resistant and vice versa. Abbreviations: Abx, antibiotic; EA, essential agreement; CA, categorical agreement; VME, very major error; ME, major error; mE, minor error; AMP, ampicillin; PIP, piperacillin; AMC, amoxicillin/clavulanic acid; SAM, ampicillin/sulbactam; TZP, piperacillin/tazobactam; CAZ, ceftazidime; CRO, ceftriaxone; CTT, cefotetan; CXM, cefuroxime; CZO, cefazolin; FEP, cefepime; ATM, aztreonam; ETP, ertapenem; IPM, imipenem; MEM, meropenem; AMK, amikacin; GEN, gentamicin; TOB, tobramycin; CIP, ciprofloxacin; LVX, levofloxacin; SXT, trimethoprim/sulfamethoxazole; NIT, nitrofurantoin; MIC, minimum inhibitory concentration; BMD, broth microdilution method. |
Comparison of incidence of errors for the five automated systems
For isolate S1, notable VMEs were observed in CZO (DL 2.3%, TDR 4%, Microscan 3.8%, and Phoenix 2.2%) and SXT (Phoenix 2.1%). High rates of MEs were observed in AMC (DL 8.7%), TZP (DL 3.1%), ceftazidime (CAZ, 3.1%–4% in DL, TDR, and Phoenix), FEP (22.3%–90.2% each for all except Vitek), aztreonam (ATM) (3.6%–44.3% each for all except Vitek), AMK and TOB (TDR 4.1% each). No VMEs and MEs were observed in most antibiotics tested by Vitek 2, say for four antibiotics (≤0.7% each; Table 3). Nevertheless, substantial mEs were observed in Vitek (77.9%) for ampicillin/sulbactam (SAM), along with DL (27.4%) and TDR (87.7%) systems. Categorizing by antibiotics, mEs were observed for the DL system in the following: AMC (21.7%), FEP (23.1%), and LVX (55.8%). Further mEs were reported for FEP (59.0%, Phoenix) and LVX (25.4%, Microscan). To sum up, the five AST systems showed comparable performance with BMD in 12 of 22 (Vitek), 7 of 17 (Phoenix), 4 of 22 (Microscan), 2 of 17 (TDR), and 2 of 19 (DL) antibiotics tested by each system for isolate S1. CIP was the only drug that satisfied the CLSI standards by all AST systems, with an MIC of 8, which was categorized as “R” by CLSI breakpoints (Table 3).
The situation was a bit worse for isolate S2, which exhibited almost total resistance to the antibiotics tested and with high MICs. Although no MEs were observed, VME rates were worse compared with isolate S1. High rates of VMEs were observed with meropenem (MEM; Vitek 6.2%, TDR 10.0%, Phoenix 4.9%), IPM (Phoenix 6.2%, DL 4.7%), and CZO (2.2%–4.0% each for all except Vitek). Notably, Vitek 2 had the highest interpretive errors in FEP (10.0% VME and 76.8% mEs). Substantial VMEs were also observed for CAZ, ATM, AMK, GEN, and TOB (4.0%–4.2%) by TDR system, LVX (2.2%) by Microscan system, SXT (3.5%) by Phoenix system, and NIT (2.1%) by DL system. A high rate of mEs was also observed in the DL system for FEP (10.1%), IPM (36.2%), and LVX (10.9%), and in Vitek 2 for CTT (78.6%). Overall, only four (CAZ, IPM, LVX, and NIT) of 22, three (CAZ, FEP, and LVX) of 17, three (CAZ, FEP, and MEM) of 22, two (FEP and LVX) of 17, and two (CAZ and MEM) of 19 antibiotics tested by Vitek 2, Phoenix, Microscan, TDR and DL systems met the recommended standards by CLSI (Table 3).
Discussion
With the popularization of laboratory automation testing, more clinical laboratories in China are using commercial automated systems for AST. MIC determination is of great importance in the selection of antimicrobial therapy to guide the most appropriate dosing regimen.10 However, differences in instrument manufacturers, software versions, including the built-in susceptibility breakpoints edition, and even AST panels, could make a difference in MIC results.11 Therefore, it is imperative to evaluate the accuracy of commonly used susceptibility testing methods. The five automated systems evaluated in this study are market leaders in China and many other countries. To the best of our knowledge, this is the first and largest study evaluating the accuracy of these automated systems for susceptibility testing of two commonly encountered Enterobacteriaceae, with 851 participating hospitals and using the latest CLSI 2017 breakpoints.
This study highlights three important points. First, not all hospitals in China seem to fully understand and appreciate the importance of the internal QC for MIC determination. E. coli ATCC 25922, E. coli ATCC 35218, and P. aeruginosa ATCC 27853 are the most commonly used QC strains for antimicrobial testing in clinical microbiology laboratories. However, in the present study, 71 (8.3%) of the hospitals did not return any results of the QC strains. To figure out possible reasons, we contacted these laboratories and identified three main reasons, including lack of QC strains, and forgetting to perform the test or to upload the data. In addition, even for those laboratories that tested the QC strains, the results were barely satisfactory for all the five AST systems, with a considerable proportion of MICs that were outside the acceptable range and some cases of “not determinable” results, especially for AMK, CIP, CZO, FEP, GEN, SXT, and TZP. This may be due to failure by scientists to properly follow standardized procedures during a series of technological processes.12 Also, the instrument itself has its own detection limit which may contribute to the category of “not determinable.”11 All these findings reinforce the need to increase awareness on the importance of accurately performing susceptibility testing of QC strains before MIC testing in China. There is also an urgent need for continual improvement of individual instruments, including software upgrades to incorporate the latest antimicrobial breakpoints.
Second, our results reveal that the five automated AST systems commonly used in China, except Vitek 2, are not reliable for correctly categorizing susceptibility profiles for certain drugs (CZO and FEP: DL and TDR system; ATM and ETP: Microscan system; IPM: Phoenix system), leading to wrong classifications as “R?,” “S?,” and “NS,” which has not been previously reported. Possible explanations for this include the use of the unified latest 2017 CLSI breakpoints for MIC interpretation in the present study, instead of the corresponding breakpoints within each individual instrument. In fact, the breakpoint versions used in the five AST systems in the participating hospitals ranged from CLSI 2009 to CLSI 2016. In addition, in the past several years, CLSI has revised the breakpoints for several antimicrobial agents commonly tested against Gram-negative bacteria. This includes a revision of the breakpoints for Enterobacteriaceae for the antimicrobials ATM, CZO, FEP, CAZ, CRO, ETP, IPM, and MEM.13 These updates in CLSI versions may lead to differences in MIC interpretation. For example, since 2012, the susceptible breakpoint for ETP has gone through two significant changes, from ≤2 (CLSI 2010) to ≤0.25 (CLSI 2011), and is now coming to ≤0.5.14–16 For Microscan system, 95.9% (116/121) of the susceptibility results for ETP were categorized as “S?,” with 95.7% (111/116) exhibiting a MIC of ≤2, and 4.3% (5/116) with a MIC of ≤1, which can all be categorized as “S” when using the CLSI 2010 breakpoints instead of “S?” according to CLSI 2017 breakpoints. Thus, it is incumbent upon the instrument manufacturer to keep pace with the breakpoint updates and make relevant improvements such as extending the detection limit and verifying the performance of the AST system with the revised breakpoints internally, to avoid the problem of uncategorized results.11 In this regard, our study has provided a preliminary examination in the five automated AST systems for future advancement and verification.
Third, based on our study, none of the commercial testing methods met the standards for all the antimicrobial agents tested as per CLSI recommended performance standards for commercial AST systems, when compared to BMD (EA ≥90%, CA ≥90%, VME ≤1.5%, ME ≤3.0%, mE≤10.0%).9 Generally, the TDR system was the least reliable, with significant VMEs in CZO, CAZ, ATM, MEM, AMK, GEN, and TOB, which were well above the acceptable ranges. On the contrary, Vitek 2 performed best among the five systems, with the least incidence of errors except for a high VME rate of 10.0% and 6.2% against FEP and MEM for isolate S2, respectively, which is consistent with previous studies. Lat et al reported a VME rate of 67.0% and 27.0% for FEP and MEM, respectively, for K. pneumoniae carbapenemase (KPC)-producing K. pneumoniae by Vitek 2 system, in comparison with BMD.17 The problem with MEM is not unique to Vitek 2 as the MIC results from Microscan, Phoenix, and TDR systems also tended to be several dilutions lower than those of BMD, resulting in high rates of VME (1.5% vs 4.9% vs 10.0%). The same problem was observed in Phoenix and TDR systems for IPM. Moreover, all systems except Vitek 2 had considerable difficulty in MIC determination of CZO, with high VMEs for both ESBL-producing E. coli and KPC-producing K. pneumoniae. Although CZO has not been previously studied, problems concerning other third-generation cephalosporins such as cefotaxime, CAZ, and CRO have been reported previously,10,13 and thus we speculate that it could be extrapolated to CZO as well.
A possible reason for these discrepancies in susceptibility results among automated systems may be the inoculum size effect, as a smaller inoculum was used in the automated methods compared with the BMD reference method. Several studies with the Vitek 2 system have revealed false susceptibility rates for Enterobacteriaceae, which were suspected to be due to a low inoculum size.11,13,17 This problem has also been reported with the Microscan and Phoenix systems,18,19 leading to the conclusion that low inoculum size has a major influence on the outcome of these systems, with false susceptibilities being reported. As for TDR and DL systems that are mainly used in China, there are limited studies on their performance in susceptibility testing. Therefore, further studies are needed to determine possible reasons for poor performances.
Limitations
Study limitations include possible selection bias as only two species of Enterobacteriaceae with two types of resistant phenotypes were used in the study. And finally, for uniformity, only the latest CLSI 2017 breakpoints were used for data analysis.
Conclusion
In conclusion, our findings reveal substantial discordance in susceptibility results between the tested methods and BMD, with none satisfying the criteria for acceptable AST performance. Each system has inherent advantages and limitations, and the results varied widely by antimicrobial drugs, software versions, and cards used. However, Vitek 2 system seemed to provide a relatively accurate and conservative assessment of MICs for most antimicrobials except FEP and MEM. Standardized MIC testing procedures including QCs, as well as the timely update of the systems in keeping with the CLSI breakpoints, are crucially important as highlighted by this study. Our study suggests that whatever automated AST system is used, laboratories must supplementally use the reference BMD for problematic antimicrobials.
Acknowledgments
This work was supported by CAMS Innovation Fund for Medical Sciences (grant no. 2016-I2M-1-014), CAMS Initiative for Innovative Medicine (grant no. 2016-I2M-3-014), and Graduate Innovation Fund of Peking Union Medical College (grant no. 2017-1002-1-21). The funders had no role in study design, data collection and analysis, decision to publish, or preparation of the manuscript.
Disclosure
The authors report no conflicts of interest in this work.
References
Sader HS, Farrell DJ, Flamm RK, Jones RN. Antimicrobial susceptibility of Gram-negative organisms isolated from patients hospitalised with pneumonia in US and European hospitals: results from the SENTRY Antimicrobial Surveillance Program, 2009-2012. Int J Antimicrob Agents. 2014;43(4):328–334. | ||
Castanheira M, Griffin MA, Deshpande LM, Mendes RE, Jones RN, Flamm RK. Detection of mcr-1 among Escherichia coli clinical isolates collected worldwide as part of the SENTRY Antimicrobial Surveillance Program in 2014 and 2015. Antimicrob Agents Chemother. 2016;60(9):5623–5624. | ||
Rechenchoski DZ, Dambrozio AML, Vivan ACP, et al. Antimicrobial activity evaluation and comparison of methods of susceptibility for Klebsiella pneumoniae carbapenemase (KPC)-producing Enterobacter spp. isolates. Braz J Microbiol. 2017;48(3):509–514. | ||
Holland TL, Woods CW, Joyce M. Antibacterial susceptibility testing in the clinical laboratory. Infect Dis Clin North Am. 2009;23(4):757–790, vii. | ||
Gagliotti C, Sarti M, Sabia C, et al. Accuracy of automated and manual systems for susceptibility testing of Pseudomonas aeruginosa to piperacillin and piperacillin-tazobactam. New Microbiol. 2011;34(1):97–99. | ||
Mittman SA, Huard RC, Della-Latta P, Whittier S. Comparison of BD phoenix to vitek 2, microscan MICroSTREP, and Etest for antimicrobial susceptibility testing of Streptococcus pneumoniae. J Clin Microbiol. 2009;47(11):3557–3561. | ||
Clinical and Laboratory Standards Institute. Methods for Dilution Antimicrobial Susceptibility Tests for Bacteria that Grow Aerobically – Tenth Edition: Approved Standard M7-A10. CLSI, Wayne, PA, USA, 2015. Available from: https://clsi.org/standards/products/microbiology/documents/. | ||
Clinical and Laboratory Standards Institute. Clinical and Laboratory Standards Institute. Performance Standards for Antimicrobial Susceptibility Testing: Tween-seventh Informational Supplement M100-S27. CLSI, Wayne, PA, USA, 2017. Available from: https://clsi.org/standards/products/microbiology/documents/. | ||
Clinical and Laboratory Standards Institute. Clinical and Laboratory Standards Institute. Development of In Vitro Susceptibility Testing Criteria and Quality Control Parameters: Fourth Edition: Approved Standard M23-A4. CLSI, Wayne, PA, USA, 2016. Available from: https://clsi.org/standards/products/microbiology/documents/. | ||
Jang W, Park YJ, Park KG, Yu J. Evaluation of MicroScan WalkAway and Vitek 2 for determination of the susceptibility of extended-spectrum beta-lactamase-producing Escherichia coli and Klebsiella pneumoniae isolates to cefepime, cefotaxime and ceftazidime. J Antimicrob Chemother. 2013;68(10):2282–2285. | ||
Bulik CC, Fauntleroy KA, Jenkins SG, et al. Comparison of meropenem MICs and susceptibilities for carbapenemase-producing Klebsiella pneumoniae isolates by various testing methods. J Clin Microbiol. 2010;48(7):2402–2406. | ||
Jorgensen JH, Ferraro MJ. Antimicrobial susceptibility testing: a review of general principles and contemporary practices. Clin Infect Dis. 2009;49(11):1749–1755. | ||
Bobenchik AM, Deak E, Hindler JA, Charlton CL, Humphries RM. Performance of Vitek 2 for antimicrobial susceptibility testing of Enterobacteriaceae with Vitek 2 (2009 FDA) and 2014 CLSI breakpoints. J Clin Microbiol. 2015;53(3):816–823. | ||
Clinical and Laboratory Standards Institute. Clinical and Laboratory Standards Institute. Performance Standards for Antimicrobial Susceptibility Testing: Twentieth Informational Supplement M100-S20. CLSI, Wayne, PA, USA, 2010. Available from: https://clsi.org/standards/products/microbiology/documents/. | ||
Clinical and Laboratory Standards Institute. Clinical and Laboratory Standards Institute. Performance Standards for Antimicrobial Susceptibility Testing: Twenty-First Informational Supplement M100-S21. CLSI, Wayne, PA, USA, 2011. Available from: https://clsi.org/standards/products/microbiology/documents/. | ||
Clinical and Laboratory Standards Institute. Clinical and Laboratory Standards Institute. Performance Standards for Antimicrobial Susceptibility Testing: Twenty-Second Informational Supplement M100-S22. CLSI, Wayne, PA, USA, 2012. Available from: https://clsi.org/standards/products/microbiology/documents/. | ||
Lat A, Clock SA, Wu F, et al. Comparison of polymyxin B, tigecycline, cefepime, and meropenem MICs for KPC-producing Klebsiella pneumoniae by broth microdilution, Vitek 2, and Etest. J Clin Microbiol. 2011;49(5):1795–1798. | ||
Bratu S, Mooty M, Nichani S, et al. Emergence of KPC-possessing Klebsiella pneumoniae in Brooklyn, New York: epidemiology and recommendations for detection. Antimicrob Agents Chemother. 2005;49(7):3018–3020. | ||
Doern CD, Dunne WM Jr., Burnham CA. Detection of Klebsiella pneumoniae carbapenemase (KPC) production in non-Klebsiella pneumoniae Enterobacteriaceae isolates by use of the Phoenix, Vitek 2, and disk diffusion methods. J Clin Microbiol. 2011;49(3):1143–1147. |
 © 2018 The Author(s). This work is published and licensed by Dove Medical Press Limited. The
full terms of this license are available at https://www.dovepress.com/terms
and incorporate the Creative Commons Attribution
- Non Commercial (unported, 3.0) License.
By accessing the work you hereby accept the Terms. Non-commercial uses of the work are permitted
without any further permission from Dove Medical Press Limited, provided the work is properly
attributed. For permission for commercial use of this work, please see paragraphs 4.2 and 5 of our Terms.
© 2018 The Author(s). This work is published and licensed by Dove Medical Press Limited. The
full terms of this license are available at https://www.dovepress.com/terms
and incorporate the Creative Commons Attribution
- Non Commercial (unported, 3.0) License.
By accessing the work you hereby accept the Terms. Non-commercial uses of the work are permitted
without any further permission from Dove Medical Press Limited, provided the work is properly
attributed. For permission for commercial use of this work, please see paragraphs 4.2 and 5 of our Terms.