Back to Archived Journals » Open Access Medical Statistics » Volume 6
Comparison of empirical study power in sample size calculation approaches for cluster randomized trials with varying cluster sizes – a continuous outcome endpoint
Received 16 September 2015
Accepted for publication 13 January 2016
Published 25 February 2016 Volume 2016:6 Pages 1—7
DOI https://doi.org/10.2147/OAMS.S96508
Checked for plagiarism Yes
Review by Single anonymous peer review
Peer reviewer comments 3
Editor who approved publication: Dr Dongfeng Wu
Mavuto Mukaka,1,2 Lawrence H Moulton1
1Department of International Health, Bloomberg School of Public Health, Johns Hopkins University, Baltimore, MD, USA; 2Clinical Trials Support Group, Mahidol-Oxford Tropical Medicine Research Unit, Faculty of Tropical Medicine, Mahidol University, Bangkok, Thailand
Background: Cluster randomized trials (CRTs) are a popular trial design. In most CRTs, researchers assume equal cluster sizes when calculating sample sizes. When clusters vary, assuming equal sized clusters may result in low study power. There are two common approaches to sample size calculations for varying cluster sizes. One approach uses a harmonic mean (m̄H) of cluster sizes, while the other incorporates the squared coefficient of variation (cv2) of cluster sizes. We performed simulations to compare empirical power between the two methods as well as the arithmetic mean method for a continuous endpoint.
Study design: We considered cluster sizes that follow uniform distributions and performed 20,000 simulations under each scenario. Endpoints were analyzed using: 1) an individual-level linear regression model with Gaussian random intercepts for clusters; 2) an individual-level t-statistic with cluster-robust standard errors; 3) a generalized estimating equations (GEE) model with exchangeable correlation structure; and 4) a GEE model with independent correlation structure and robust standard errors.
Results: When the Gaussian random effects or the GEE model with exchangeable correlation structure was considered, the m̄H method had 80% power. The cv2 method had power of 85%–88%. However, when the data were analyzed using a t-statistic or the GEE model with independent correlation structure, the power of cv2 method was 80%. The m̄H method produced power of 71%–76%.
Conclusion: The performance of the sample size methods depends on the data analysis approaches. The degree of disparity in power depends also on the intracluster correlation coefficient. These findings emphasize the maxim that researchers should consider methods of analysis when designing CRTs to allow for appropriate sample size calculations.
Keywords: cluster randomized trial, varying cluster sizes, empirical power, harmonic mean, coefficient of variation, continuous endpoint
Introduction
Cluster randomized trial (CRT) designs are commonly used to evaluate the impact of health interventions between two or more treatments.1,2 In CRTs, groups of individuals are randomized to different treatments. The groups that are typically randomized are households, health centers, villages, and intensive care units to mention a few. The broad reasons for choosing a CRT design include the practical challenges of conducting the intervention at the individual level and the need to obtain cluster level information on the effect of an intervention.3
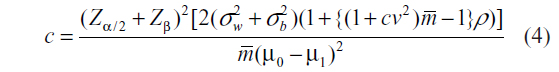
Researchers often assume an equal number of subjects within each cluster when calculating sample sizes for CRTs.4–7 In such cases, the required sample size for an individually randomized study design is simply multiplied by an inflation factor popularly known as design effect (DEff) to account for clustering in the sample size for a CRT.4 The elements of the inflation factor are the intracluster correlation coefficient (ICC), ρ, and the cluster size, m, DEff = (1+ (m – 1)ρ). The main advantage of this assumption is that it simplifies the calculations. In some cases, there are only slight differences in cluster sizes and the assumption of equal sized clusters may not be an issue. An arithmetic mean,  , of the cluster size is commonly used in place of the cluster size m in such scenarios. The DEff then becomes: (1 + ( – 1)ρ), where is the arithmetic mean of the cluster size. The sample size for assessing a difference in means between two treatment/intervention groups becomes:

where c is the total number of clusters, Zα/2 and Zβ are the standard normal values corresponding to the upper tail probabilities of α/2 and β, respectively; α is the two-sided significance level, and 1 – β is the study power, with β the probability of making type II error; μ0 and μ1 are the means in the control and intervention arms respectively; σw and σb are within cluster and between cluster standard deviations of the outcome, respectively.
However, it is very common to work with unequal cluster sizes in practice, such that the cluster sizes may vary considerably. In situations where all members of a cluster are studied, cluster sizes will more likely vary.1 A good example is randomizing health centers, where the interest is in the patients who are on antiretroviral therapy. Clearly, the numbers of antiretroviral therapy patients would vary from one health center to another. When cluster sizes vary, sample size calculations that assume equal cluster size and those that utilize the arithmetic mean cluster size may not yield sizes that have enough power to detect a desired effect.1,2,6–8 In general, this simplicity in sample size calculations is done at the expense of reduced study power when clusters vary.
Furthermore, a method of analysis of the endpoint may potentially have an impact on the power. For example, the data analyzed at individual level may not necessarily have the same power as cluster level summary analysis. Similarly, population-averaged estimates may not necessarily yield the same power as subject-specific estimates. In general, less attention is paid to the implication of the method of analysis of the primary endpoint on power and inference. In a 2004 review of CRTs, Varnell et al9 found that about 20.3% of the reviewed articles reported inappropriate analyses according to the study designs. A review of methods of analyses are present in a 2004 review by Murray et al.5 In general, researchers tend to focus only on cluster sizes, ICC, and the nature of outcome whether continuous or binary when making sample size calculations for CRTs. The statistical analysis section in study protocols often tends to state the methods of analysis that will be used based on what other publications have routinely outlined without further reflection on the study power. Ignoring the method of analysis at the design stage may result in study power implications during analysis.
For varying cluster sizes, there are two commonly used sample size calculation methods. One approach uses a harmonic mean of cluster sizes in the DEff instead of the arithmetic mean to calculate sample sizes.1 Let mi be the number of individuals in the ith cluster for i=1, 2, …, c, where c is the total number of clusters available for randomization. The harmonic mean of cluster sizes is:

That is, to calculate a harmonic mean, one first obtains the arithmetic mean of the reciprocal of each of the cluster sizes. Then, one takes the reciprocal of the resulting arithmetic mean.
Alternative studies of sample size calculations for CRTs with varying cluster sizes suggest using a modified DEff that includes the squared coefficient of variation of cluster sizes.6–8 The following DEff is used:

where cv is the coefficient of variation of cluster sizes and is the arithmetic mean of the cluster sizes. The cv of cluster sizes is the ratio of the standard deviation of the cluster sizes to the arithmetic mean () of the cluster sizes.6,7 Eldridge et al8 suggest ways of estimating the cv for this approach depending on the distribution of the cluster sizes.
We note that researchers have the liberty to choose one of the two methods of sample size calculations as long as they cite the appropriate reference. We also note that depending on the distribution of cluster sizes, these two sample size calculation methods may lead to different sample size estimates for the same scientific question and parameters. This suggests that one of the two methods may be underpowered or may provide a very conservative high power. In addition, the method of analysis is rarely considered when making sample size calculations. The rationale for this study was, therefore, to compare empirical power from these two sample size calculation approaches as well as the arithmetic mean method taking the methods of analysis into account, in order to provide informed guidance on their use in practice.
Methods
Simulations
A simulation study was performed in Stata 13 (StataCorp LP, College Station, TX, USA) to compare the empirical study power from the two sample size calculation approaches for CRTs with varying cluster sizes as well as the standard formula which factors the arithmetic mean into the DEff. In one set of simulations, we considered cluster sizes that follow a uniform distribution, U[10,100], giving a mean cluster size of 55, harmonic mean 38.3, variance of 675, and hence cv of cluster sizes is 0.47 (or cv2=0.22). In another set of simulations, we examined cluster sizes that follow a uniform distribution, U[5,100], resulting in an arithmetic mean cluster size of 52, harmonic mean of 31, variance of 752, which gives a cv of cluster sizes of 0.53 (or cv2=0.28). The uniform distribution was chosen so the results would be compared with previous researchers who had used the uniform distribution.6,7 The endpoint of interest was set to be a continuous outcome. In all the scenarios considered, the sample sizes were calculated to detect a change in mean of 15 units between the control and the intervention groups. The within cluster variance of the outcome was set at 2,000. The between cluster variances were varied to achieve the different ICC (ρ) levels ranging from 0.1 to 0.7. The wide range of ICC (ρ) used in these simulations are consistent with the literature.6,7 Nominal power was set at 80% and 5% type I error rate was allowed in sample size calculations. The following sample size formulas were used to calculate the number of clusters, c, per arm for the cv and harmonic mean methods, respectively:
and

In these simulations, clusters were randomized either to the treatment or control group. For comparison, we also calculated the sample size corresponding to cv2=0, that is, just using the arithmetic mean cluster size. We performed 20,000 simulations under each scenario being investigated.
Three commonly used methods of analysis in CRTs were used for outcome data analysis in these simulations. The three methods that were used to analyze the simulated data sets were: 1) an individual-level linear regression model with Gaussian random intercepts for clusters (estimated via maximum likelihood); 2) an individual-level t-statistic with cluster-robust standard errors to account for clustering, and 3) the generalized estimating equations (GEE) with exchangeable correlation structure. We also considered the GEE with independent correlation structure and robust standard errors. This GEE model specification is close to that producing the t-statistic with robust standard errors. The cluster-robust standard errors for the individual-level t-statistic method were estimated by decomposing the Huber–White matrix at cluster level (ie, using cluster level components) rather than using individual-level components.
Let yij denote the outcome of individual i in cluster j, i=1, 2, 3, …, n; j=1, 2, 3, …, k. The Gaussian random intercepts model is given as:

where u is the overall mean (a constant), αj is the cluster j effect, random, ~N(0, τ2), β1 is the treatment effect, eij~N (0, σ2), αj and eij are independent.
In this model, the standard error for the estimation of β is estimated via maximum likelihood estimation.
On the other hand, the model for the Student’s t-test with robust standard errors is specified as a linear regression model as:

where β0 is the overall mean (a constant), β1 is the treatment effect, eij~N(0, σ2).
In this model, the standard errors for the estimation of β are estimated using the Huber–White–Royall expression. This robust variance estimator in a cluster design with K clusters C1, C2, C3, ….. CK is given as:

where is  the conventional estimate of the variance and hj(c) is the contribution of the jth cluster to variance estimation.
The t-statistic was obtained as the ratio of the estimate of treatment effect to the clustered-robust standard errors. It should be noted that the t-test may also be obtained via cluster level summaries, however, such an approach discourages inclusion of covariates in the analysis.
Results
For the cluster sizes that follow a U[10,100], at all levels of the ICCs, the cv method resulted in the highest required sample sizes followed by the harmonic mean method and then finally the arithmetic mean method. When data were analyzed using the individual-level linear regression model with Gaussian random intercepts for clusters (estimated via maximum likelihood), the study power consistently remained around 80% for all levels of ICC (Figure 1). The same pattern was observed for those analyses performed using the GEE with exchangeable correlation structure (Figure 1). This was in agreement with the power input parameter in the sample size calculations, which was set at 80%. The arithmetic mean resulted in slight underpower yielding power of about 78%–79%, while the cv method had a conservatively high power of 85%–87%, substantially higher than what was optimally set in sample size calculations.
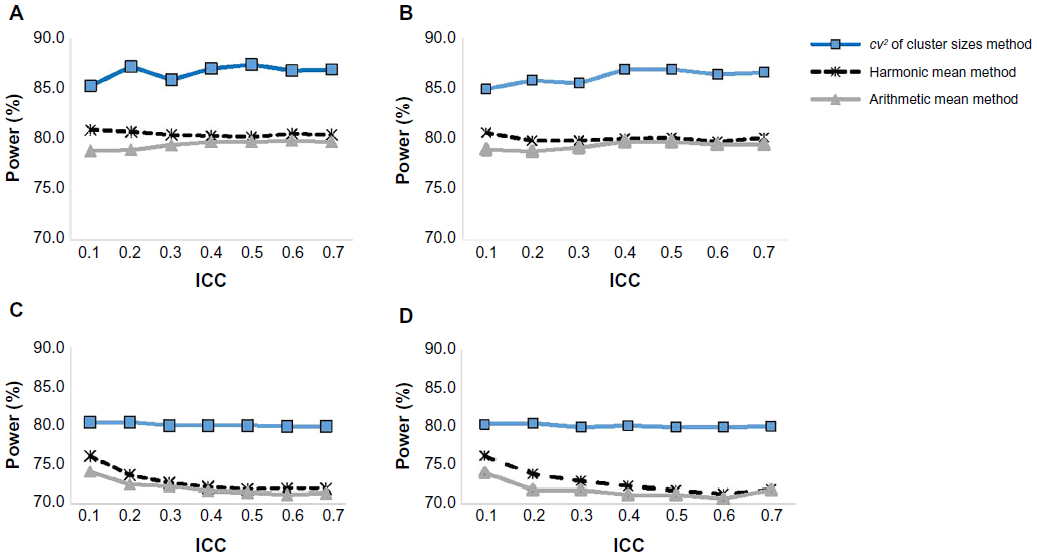 | Figure 1 Empirical power for the three sample size calculation methods and four different data analysis approaches over a range of ICCs, cluster sizes ~U[10,100]. |
On the other hand, when data were analyzed using the individual-level t-statistic or the GEE with independent correlation structure and with cluster-robust standard errors to account for clustering in either case, the study power from the cv method consistently remained around 80% for all levels of ICC (Figure 1). This was in agreement with the power input parameter in the sample size calculations, which was set at 80%. Both the harmonic mean and arithmetic mean sample size approaches resulted in substantially lower than the optimal 80% yielding power of about 70%–76% (Figure 1).
For the cluster sizes that follow a U[5,100], which gives higher cv, lower harmonic and arithmetic means, respectively than those of the U[10,100] distribution, we observed the similar patterns of power that depended on the method of analysis (Figure 2). Figure 2 presents the power trends for the three methods of analysis over a range of ICC for the cluster sizes that follow a U[5,100].
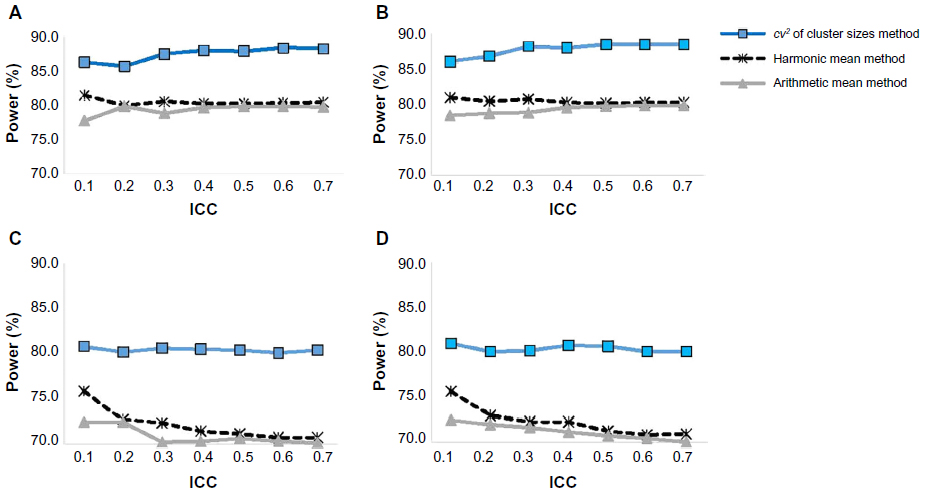 | Figure 2 Empirical power for the three sample size calculation methods and four different data analysis approaches over a range of ICCs, cluster sizes ~U[5,100]. |
The detailed summary of sample sizes and power for cluster sizes that follow a U[10,100] is presented in Table 1, according to the method of data analysis. At each ICC level, the cv2 method resulted in the highest required sample sizes, while the arithmetic mean method had the least. The harmonic mean method gives slightly higher sample sizes than the arithmetic mean method (Table 1).
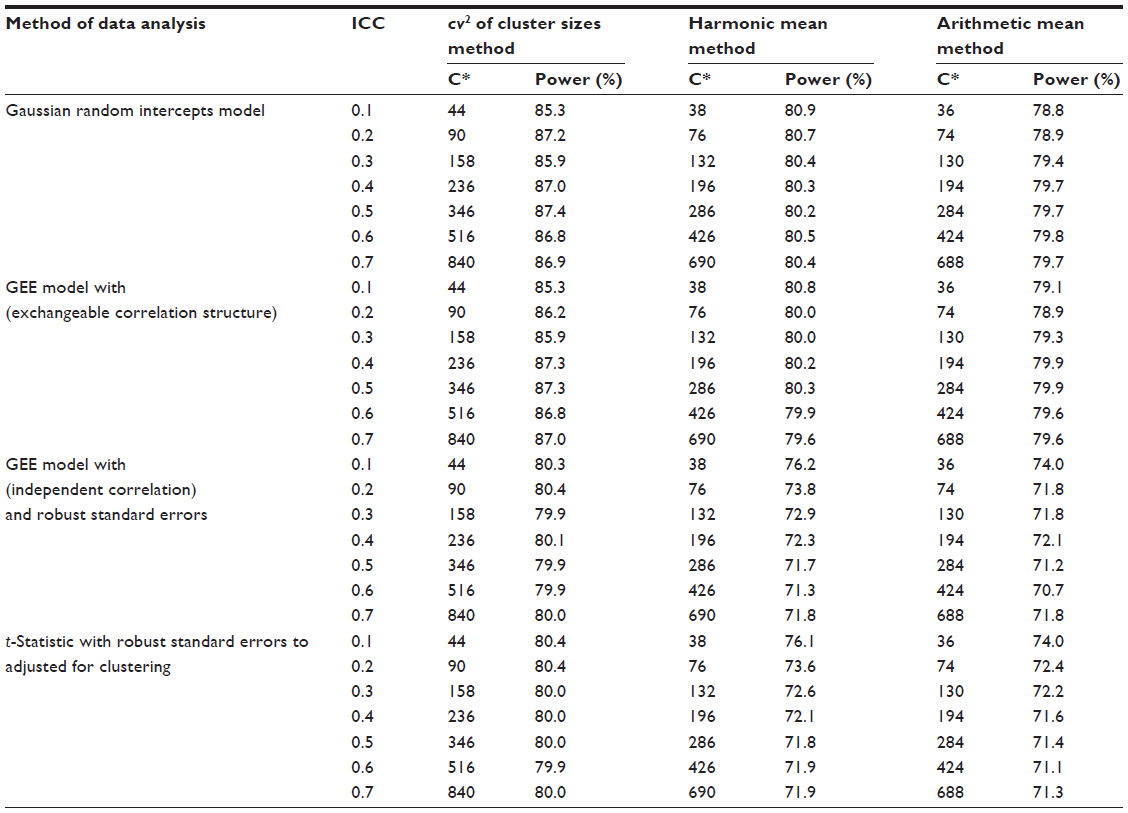 | Table 1 Empirical power of sample size approaches according to method of data analysis – cluster sizes ~U[10,100] based on 20,000 simulations |
Table 2 provides a comprehensive summary of the power findings for cluster sizes that follow a U[5,100], according to the method of data analysis and method of sample size calculation. The increased cv2 in the U[5,100] cluster size distribution compared with a U[10,100] resulted in a huge increase in the resulting sample sizes by this method than the respective increases for the harmonic and the arithmetic mean sample size calculation methods (Table 2).
Discussion
In this simulation work, it has been observed that the performance of the sample size calculation methods for CRTs with varying cluster sizes depends on the method of analysis. This is consistent with a recent discussion by Rutterford et al.10 When the random effects or the GEE model with exchangeable correlation structure was considered, sample sizes of H method yielded desired power to detect the difference in means between two groups. The cv2 method had very high power. This is consistent with the observation of Eldridge et al.8
However, when the data were analyzed using an individual-level t-statistic or the GEE model with independent correlation structure with clustered-robust standard errors in both cases, the empirical power of cv2 method was 80% as expected. The method produced empirical power, which is lower than expected under this setting. The power findings were of similar patterns for the two cvs that were considered. As expected, the sample size substantially increased with the increased cv.
The literature review for the sample size approaches considered in this study reveals that the sample size calculation methods for CRTs with varying cluster sizes work best depending on the data analysis method that is employed. The degree of disparity in power between the two sample size methods seems to depend not only on the method of analysis, but also on ICC (ρ). Sample sizes that use the arithmetic mean method were underpowered for the t-test, GEE, and random intercepts models. The arithmetic mean method is highly underpowered when a t-test or the GEE with independent correlation structure is used. The unacceptably observed low power of the arithmetic mean method in case of a t-test agrees with the observation of Manatunga et al.6 In this case, the harmonic mean method makes an important correction that retains the study power at 80%. Rutterford et al10 have recently discussed sample sizes for a wide range of CRT designs and have summarized the methods of data analysis under which the different sample size methods may be appropriate.
In summary, the H method is ideal for the random intercepts and the GEE models with exchangeable correlation structure. When the individual-level t-test or the GEE model with independent correlation structure with robust standard errors is the method of analysis of choice for a CRT, the use of the cv2 method should be encouraged. Despite its simplicity, the use of the arithmetic mean cluster size should be discouraged when cluster sizes are expected to vary. Moreover, a harmonic mean of cluster sizes can easily be estimated from the available clusters; and Eldridge et al8 provide suggestions for estimating the cv of cluster sizes.
Conclusion
The performance of the sample size methods depends on the method of data analysis. The degree of disparity in power depends also on the ICC. These simulation findings emphasize the fundamental principle that researchers should consider methods of analysis when designing CRTs to allow for appropriate sample size calculations. Moreover, it can be important to account for variability of cluster size. Alternatively, one can obtain a conservative estimate by employing a minimum cluster size in standard calculations.
Acknowledgment
This work was supported by the Johns Hopkins University Center for AIDS Research (Grant Number 1P30AI094189) from the National Institute of Allergy And Infectious Diseases.
Author contributions
MM: Substantial contributions to conception and design, analysis, and interpretation of data, drafting the article, and the final approval of the version to be published. LHM: Substantial contributions to conception and design, interpretation of data, drafting the article, revising it critically for important intellectual content, and the final approval of the version to be published.
Disclosure
The authors report no conflicts of interest in this work.
References
Hayes RJ, Moulton LH. Cluster Randomised Trials. Boca Raton: Chapman and Hall/CRC Press; 2009. | |
Eldridge S, Kerry S. A Practical Guide to Cluster Randomised Trials in Health Services Research. Chichester, UK: John Wiley and Sons, Ltd; 2012. | |
Moulton LH. Covariate-based constrained randomization of group-randomized trials. Clin Trials. 2004;1(3):297–305. | |
Donner A, Birkett N, Buck C. Randomization by cluster. Sample size requirements and analysis. Am J Epidemiol. 1981;114(6):906–914. | |
Murray DM, Varnell SP, Blitstein JL. Design and analysis of group-randomized trials: a review of recent methodological developments. Am J Public Health. 2004;94(3):423–432. | |
Manatunga A, Hudgens M, Chen S. Sample size estimation in cluster randomized studies with varying cluster size. Biom J. 2001;43:75–86. | |
Kang S, Ahn C, Jung S. Sample size calculation for dichotomous outcomes in cluster randomization trials with varying cluster size. Drug Inf J. 2003;37:109–114. | |
Eldridge SM, Ashby D, Kerry S. Sample size for cluster randomized trials: effect of coefficient of variation of cluster size and analysis method. Int J Epidemiol. 2006;35(5):1292–1300. | |
Varnell SP, Murray DM, Janega JB, Blitstein JL. Design and analysis of group-randomized trials: a review of recent practices. Am J Public Health. 2004;94(3):393–399. | |
Rutterford C, Copas A, Eldridge S. Methods for sample size determination in cluster randomized trials. Int J Epidemiol. 2015;44(3):1051–1067. |
 © 2016 The Author(s). This work is published and licensed by Dove Medical Press Limited. The
full terms of this license are available at https://www.dovepress.com/terms
and incorporate the Creative Commons Attribution
- Non Commercial (unported, 3.0) License.
By accessing the work you hereby accept the Terms. Non-commercial uses of the work are permitted
without any further permission from Dove Medical Press Limited, provided the work is properly
attributed. For permission for commercial use of this work, please see paragraphs 4.2 and 5 of our Terms.
© 2016 The Author(s). This work is published and licensed by Dove Medical Press Limited. The
full terms of this license are available at https://www.dovepress.com/terms
and incorporate the Creative Commons Attribution
- Non Commercial (unported, 3.0) License.
By accessing the work you hereby accept the Terms. Non-commercial uses of the work are permitted
without any further permission from Dove Medical Press Limited, provided the work is properly
attributed. For permission for commercial use of this work, please see paragraphs 4.2 and 5 of our Terms.