Back to Journals » Clinical Ophthalmology » Volume 17
Comparison of Corneal Power Difference Maps with Achieved Myopic Correction Using Scheimpflug Tomography After LASIK, PRK, and SMILE
Authors Moshirfar M ![]() , Harvey DH
, Harvey DH ![]() , Wang Q, Payne CJ
, Wang Q, Payne CJ ![]() , West DG
, West DG ![]() , Hoopes PC
, Hoopes PC ![]()
Received 29 April 2023
Accepted for publication 8 June 2023
Published 19 June 2023 Volume 2023:17 Pages 1717—1727
DOI https://doi.org/10.2147/OPTH.S419327
Checked for plagiarism Yes
Review by Single anonymous peer review
Peer reviewer comments 2
Editor who approved publication: Dr Scott Fraser
Majid Moshirfar,1– 3 Devon Hori Harvey,4 Qiancheng Wang,5 Carter J Payne,1,6 David G West,7 Phillip C Hoopes1
1Hoopes Vision Research Center, Hoopes Vision, Draper, UT, USA; 2John A. Moran Eye Center, University of Utah School of Medicine, Salt Lake City, UT, USA; 3Utah Lions Eye Bank, Murray, UT, USA; 4The Ohio State University College of Medicine, Columbus, OH, USA; 5Baylor College of Medicine, Houston, TX, USA; 6Department of Ophthalmology, George Washington University School of Medicine and Health Sciences, Washington, DC, USA; 7University of Utah School of Medicine, Salt Lake City, UT, USA
Correspondence: Majid Moshirfar, Hoopes Vision Research Center, 11820 South State St Ste 200, Draper, UT, 84020, USA, Tel +1 801 568-0200, Fax +1 415-476-0336, Email [email protected]
Purpose: To compare corneal power difference maps (∆maps) obtained from the Pentacam in patients with 1 year follow-up after LASIK, PRK, and SMILE with further stratification to low, moderate, and high myopia.
Patients and methods: This retrospective study was comprised of patients who had preoperative and 1-year postoperative power maps that were obtained–front sagittal (SagF), refractive power (RP), true net power (TNP), and total corneal refractive power (TCRP)–for evaluation. Measurements were recorded and compared at the 4mm, 5mm and 6mm pupil and apex zones. Comparisons were made between each specific power ∆map and the surgically induced refractive change (SIRC). Further analysis of the ∆maps was performed based on degree of myopia (high, moderate, and low). Correlation and agreement were also assessed with regression and limits of agreement (LoA).
Results: There were 172 eyes in the LASIK group, 187 eyes in the PRK group, and 46 eyes in the SMILE group. In the LASIK group, TNP ∆map at 5mm pupil zone had the least absolute mean difference with SIRC (0.007 ± 0.42D). In the PRK group, TNP ∆map at 5mm apex zone was most accurate compared to SIRC (0.066 ± 0.45D). In the SMILE group, TCRP ∆map at 4mm apex zone had the closest absolute value when compared to SIRC (0.011 ± 0.50D). There was good correlation and agreement for all three surgery groups, LASIK: r = 0.975, LoA − 0.83D to +0.83D, PRK: r = 0.96, LoA − 0.83D and +0.95D, and SMILE: r = 0.922, LoA − 0.97 D to +0.99D.
Conclusion: TNP ∆maps most accurately measured corneal power in the LASIK and PRK groups while TCRP ∆maps were most accurate in the SMILE group. The degree of myopia may change which ∆map is most accurate.
Keywords: corneal topography, refractive surgery, total corneal refractive power, TCRP, true net power, TNP, sagittal, SagF
Introduction
Measurements of corneal power are becoming more accurate and precise. Despite continued advancements in technology and research, discrepancies between devices and device settings still exist.1,2 Accurate measurements are important for several reasons including intraocular lens (IOL) power calculations, corneal refractive surgeries, orthokeratology, and fitting custom contact lenses.3,4 One unfavorable outcome that may be seen after cataract surgery following refractive surgery is “hyperopic surprise” which may be caused by inaccurate corneal power measurements.5
There are different methods to measure corneal power. One method is conventional keratometry using manual/automated keratometers or Placido disc-based topographers which all attempt to measure the corneal power by measuring the anterior corneal curvature and using the standard refractive index of the cornea (1.3375) to calculate the corneal power.6,7 This keratometric index is intended to represent both the anterior and posterior surfaces of the cornea but includes some assumptions: 1) the corneal thickness is constant, and 2) the ratio between the anterior and posterior surfaces is unchanged throughout.8 For patients without previous refractive surgery, this is an accurate method to calculate IOL power for cataract surgery.9 However, for patients who have received refractive surgery, the keratometric index is invalid given the change in corneal thickness and an alteration in the ratio between the anterior and posterior surfaces.10 One study showed that after surgical treatments for myopia, the anterior surface is altered; however, there are minimal changes in the posterior surface.4
Another method to measure corneal power involves taking into account the anterior and posterior curvatures to calculate true corneal power using clinical tools that employ strategies such as slit-scanning tomography, optical coherence tomography, and Scheimpflug imaging.1 The Pentacam (OCULUS, Wetzler, Germany) is a device that analyzes the anterior segment using a rotating Scheimpflug camera to produce power maps of the anterior and posterior cornea.7 It can measure several other biometrics of the anterior segment as well, including central corneal thickness and anterior chamber depth.11,12 The Pentacam produces 5 different maps that measure corneal power: sagittal curvature map of the front surface (SagF), refractive power (RP) map, true net power (TNP) map, equivalent k-readings (EKR) map, and total corneal refractive power (TCRP) map. Each of these maps take into account different aspects of corneal power.13 Differences maps (∆maps) assess change in corneal power and are produced by over-laying corneal power maps obtained at different time points.
The purpose of this study was to identify the most accurate corneal power ∆map based on 1-year postoperative tomographic changes in a sample of patients who achieved their attempted correction after refractive surgery. Accuracy was determined by matching corneal power ∆maps to the surgically induced refractive change (SIRC) in high myopia, moderate myopia, and low myopia patients after LASIK, PRK and SMILE surgeries.
Methods
This study was conducted at a corneal refractive research center and was approved by the Biomedical Research Alliance of New York institutional review board (#20-12-547-823). All participants gave informed consent. Patients with myopia or compound myopic astigmatism underwent either LASIK, PRK, or SMILE between June 2020 and March 2022. Inclusion criteria were: patient age of 18 or older and best-corrected visual acuity (BCVA) of 20/25 or better. Only patients with a pre-op and 1-year post-op tomography were included, and all image quality measurements for included patients were “OK”. Patients with various ocular diseases (age-related macular degeneration, keratoconus, glaucoma, cataract development, retinal detachments, etc.), systemic diseases (herpes infections, systemic lupus erythematosus, etc.), pregnancy, hyperopia with and without astigmatism, eyes with monovision, and patients requiring enhancements were excluded from the study. Patients were divided into 3 groups based on the surgery they received: 1) LASIK, 2) PRK, or 3) SMILE. They were further stratified based on the degree of manifest refraction spherical equivalent (MRSE): low myopia was defined as a pre-op MRSE of 0 to −2.99D, moderate myopia with a pre-op MRSE of −3 to −5.99D, and high myopia with a pre-op MSRE of −6 to −9D. All MRSE values were corrected for the corneal plane.
Pre-op and Post-op Evaluations
All patients underwent a standard pre-op examination including manifest refraction, uncorrected distance visual acuity, best corrected distance visual acuity, tonometry, slit-lamp exam and dilated fundus exam. In addition, subjects underwent tomography imaging to acquire specific corneal power ∆maps using SagF, RP, TNP, and TCRP. Standard post-op examinations were performed at 1 year that included parallel imaging assessments. All tomography data was imported from the Pentacam to EXCEL (Microsoft Corporation, Redmond, WA, USA) for further data analysis.
Surgical Technique
All surgeries were performed at a single site by one surgeon (MM). LASIK and PRK surgeries were performed using the WaveLight Allegretto Wave Excimer Laser System (Alcon Laboratories, Fort Worth, TX, USA), and flap creation was performed with the FS200 (Alcon Laboratories, Fort Worth, TX, USA) femtosecond laser. All LASIK and PRK eyes received an optical zone of 6.5mm and a blend zone to 9 mm. SMILE was performed using the Visumax 500 kHz femtosecond laser (Carl Zeiss Meditec, Jena, Germany) with all eyes receiving a 6.5mm optical zone with a 0.5mm transition zone. Details concerning the surgical techniques are reflected in the following references for LASIK,14 PRK,15 and SMILE.16
Assessment of Refractive Changes and Corneal Power
Measurements from the pre-op evaluation and 1-year post-op assessment were included for comparative analysis. All corneal power maps were obtained at diameters of 4mm, 5mm, and 6mm that were centered over the apex and repeated again centered over the pupil.
- SagF was measured based on the keratometric index of 1.3375 using the Gaussian optics formula K = (n-1)/r x 1000 where n is 1.3375 and r is the radius of the anterior corneal surface in millimeters (mm). This measurement is comparable to conventional keratometry.
- RP is based on the keratometric index 1.3375 and uses varying curvature values from the anterior surface to take into account the refractive effect of a sphere. The value is obtained through Snell’s law to convert curvature into power. Each curvature value corresponds with a specific focal length from which power can be derived: K = n/f where n is 1.3375 and f is the focal length.
- TNP calculates corneal power by aggregating the refractive power of both the anterior and posterior surfaces. This is calculated using the formula:
 where n0 = 1 (the refractive index of air), n1 = 1.376 (refractive index of corneal tissue), n2 = 1.336 (refractive index of aqueous humor), r1 is the anterior curvature in mm and r2 is the posterior curvature in mm.
To ensure accuracy of the Pentacam, the machine was calibrated weekly by a certified technician and bi-monthly by a manufacturer’s representative. SIRC was defined by subtracting the post-op MRSE from the pre-op MRSE. Corneal power ∆maps (TNP, TCRP, RP and SagF) were calculated by subtracting the pre-op corneal power map from the post-op corneal power map. All SIRC values were negative to compare with the negative corneal power ∆maps. Comparisons were made as SIRC minus corneal power ∆map.
Statistical Analysis
Minimum required sample size was calculated using PS Power and Sample Size Calculation Software (ver 3.1.6, Vanderbilt University, Nashville, TN, USA). Prior data from one study reported that the difference in corneal power ∆maps had a standard deviation of approximately 0.22D.17 Hence, if α = 5% and power (1- β) = 95% then a minimum sample of 43 eyes was needed to detect a difference of 0.125D between pairs within each surgery group.
Statistical analysis was performed with commercial software (SPSS ver. 29.0; SPSS Inc., Chicago, IL). Normality was assessed using the Shapiro–Wilk test. For samples with normal distribution, comparisons between SIRC and corneal power ∆maps were performed using a paired t-test with a P value of less than 0.05 for statistical significance. For samples with non-normal distributions, comparisons between SIRC and corneal power ∆maps were performed using a Wilcoxon Signed Rank test with a P value of less than 0.05 for statistical significance. Linear regression analyses and Bland-Altman plots were also used to assess agreement between SIRC and corneal power ∆maps. A P value of less than 0.05 was used for statistical significance. To reduce potential bias in our data set with inclusion of bilateral eyes, all analyzed groups were randomly divided into two subsets of unilateral eyes and results of each subset were compared. Only results that were congruent between randomized unilateral groups were reported in the bilateral analysis.
Results
A total of 405 eyes of 242 patients were included: 172 eyes of 95 patients in the LASIK group, 187 eyes of 101 patients in the PRK group, and 46 eyes of 25 patients in the SMILE group. Within the LASIK group, there were 29 high myopic, 60 moderate myopic, and 83 low myopic eyes. In the PRK group, there were 21 high myopic, 98 moderate myopic, and 68 low myopic eyes. In the SMILE group, there were 15 high myopic, 28 moderate myopic, and 2 low myopic eyes.
All samples were normally distributed except for the LASIK overall and PRK overall groups (Shapiro–Wilk p < 0.05). Table 1 shows demographics for patients in each surgery group. Table 2 shows the best mean difference between SIRC and corneal power ∆map for each group overall as well as differences for high myopia, moderate myopia, and low myopia. Mean differences closest to zero are bolded and significant differences are marked with an asterisk. Figure 1 illustrates the best mean difference between SIRC and each corneal power ∆map: a difference that is close to zero indicates better accuracy of a corneal power ∆map, a difference greater than zero indicates an overestimation compared to SIRC, and a difference less than zero indicates an underestimation compared to SIRC.
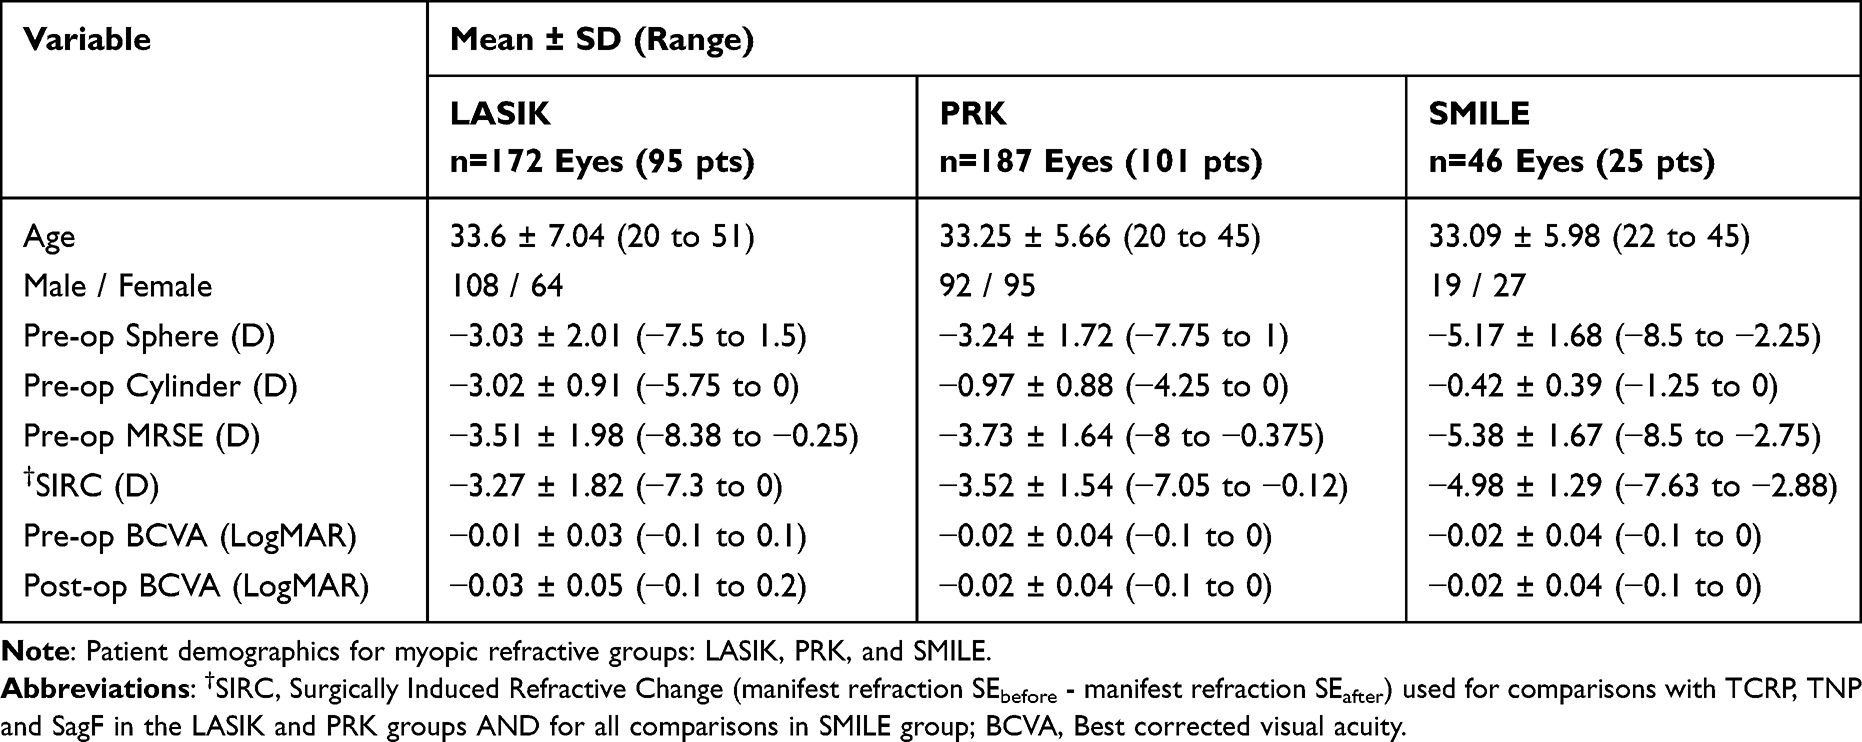 |
Table 1 Patient Demographics |
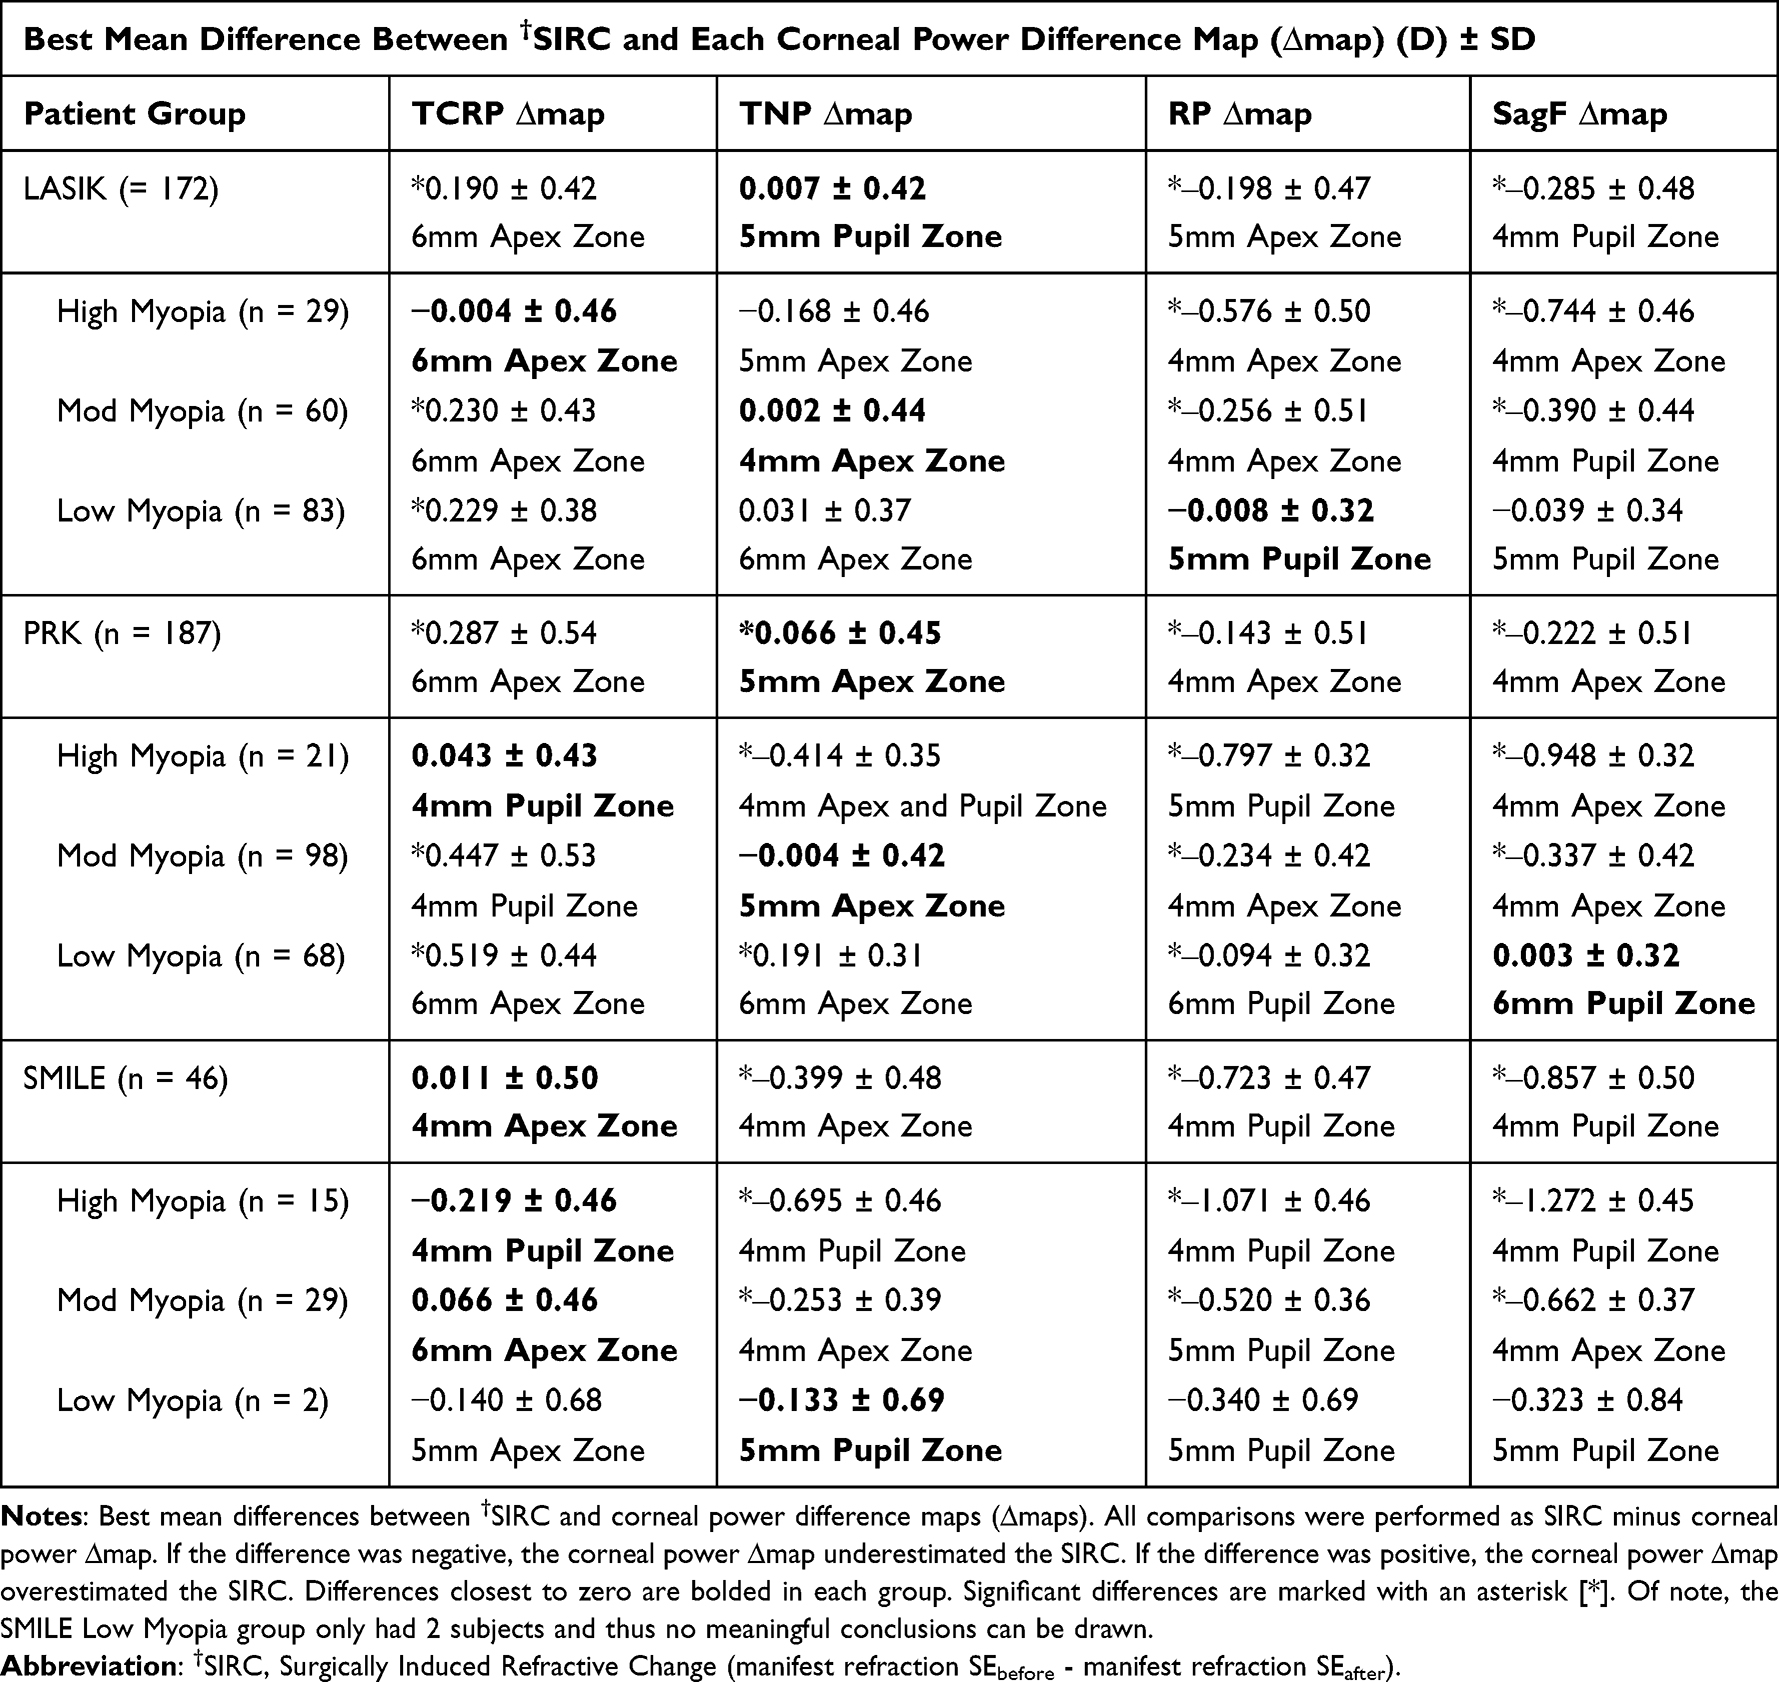 |
Table 2 Mean Differences Between SIRC and Corneal Power Difference Maps |
 |
Table 3 Corneal Power Difference Map Comparisons by Study |
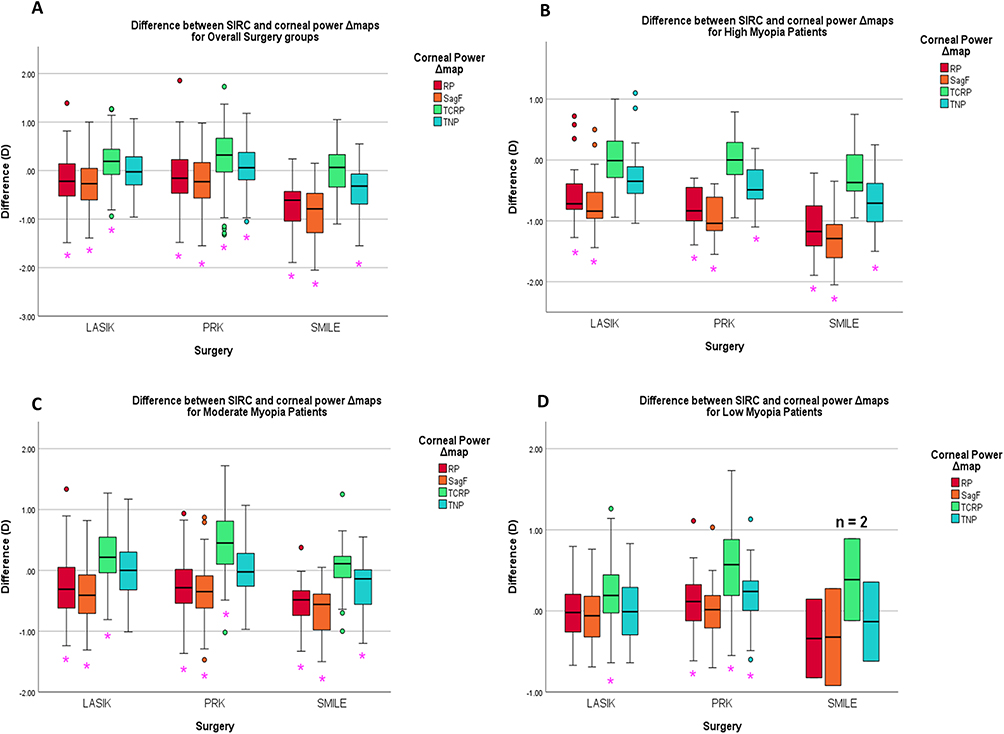 |
Figure 1 Box plot representations of the difference between †SIRC and corneal power difference maps (∆maps) obtained by the Pentacam for LASIK, PRK, and SMILE (A) overall surgical groups (B) high myopia (C) moderate myopia (D) low myopia. Corneal power ∆maps that were significantly different from SIRC are marked with an*. There were only 2 low myopia patients in the SMILE group, thus no meaningful conclusions can be drawn regarding low myopia and SMILE. Abbreviations: †SIRC, Surgically Induced Refractive Change (manifest refraction SEbefore - manifest refraction SEafter); TNP, true net power; TCRP, total corneal refractive power; SagF, sagittal front curvature power; RP, refractive power. |
The SIRC for the overall LASIK group was −3.27 ± 1.82D. TNP ∆map at 5mm pupil zone was most accurate with a value of −3.27 ± 1.69D (p = 0.993). TCRP ∆map significantly overestimated the SIRC while SagF ∆map and RP ∆map significantly underestimated the SIRC (see Figure 1A).
The SIRC for the overall PRK group was −3.52 ± 1.54D. TNP ∆map at the 5mm apex zone was most accurate with a value of −3.59 ± 1.33D, nevertheless this difference was statistically significant (p = 0.034). TCRP ∆map significantly overestimated SIRC while SagF ∆map and RP ∆map significantly underestimated SIRC (see Figure 1A).
The SIRC for the overall SMILE group was −4.98 ± 1.29D. TCRP ∆map 4mm apex zone was most accurate with a mean value of −4.99 ± 1.19D and was not significantly different from the SIRC (p = 0.886). TNP ∆map, RP ∆map, and SagF ∆map all significantly underestimated the SIRC (see Figure 1A).
For the high myopia patients, TCRP ∆maps most accurately estimated SIRC for LASIK, PRK and SMILE (p = 0.962, 0.653, 0.089 respectively) (see Figure 1B). For moderate myopia patients, TNP ∆maps were most accurate in the LASIK and PRK groups (p = 0.979 and 0.918). For the moderate myopia patients in the SMILE group, TCRP ∆map was most accurate (p = 0.445) (see Figure 1C). For low myopia patients in the LASIK group, RP ∆map was most accurate (p = 0.829). For low myopia patients in the PRK group SagF ∆map was most accurate to SIRC (p = 0.933). There were only 2 low myopia patients in the SMILE group, thus no meaningful conclusions can be drawn regarding the difference map measurements (see Figure 1D).
All corneal power ∆maps significantly correlated with SIRC, except for the RP ∆map in the high myopia LASIK group. Correlations for each overall group were TNP ∆map 5mm pupil zone (r = 0.974), TNP ∆map 5mm apex zone (r = 0.96), and TCRP ∆map 4mm apex zone (r = 0.922) for LASIK, PRK, and SMILE groups respectively. Figure 2 shows scatter diagrams that demonstrate the correlations between SIRC and the most accurate corneal power ∆map for each of the overall surgery groups. No Pearson analysis was performed for low myopia patients in the SMILE group given the small sample size.
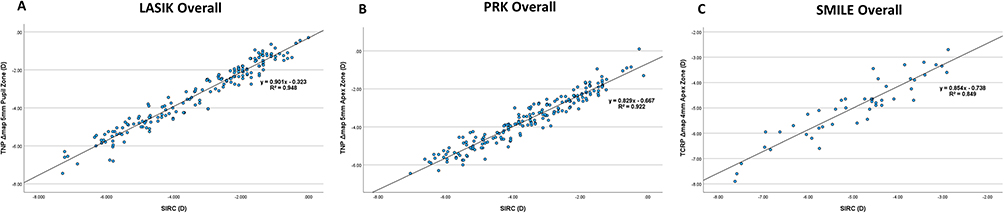 |
Figure 2 Linear regression analysis between SIRC and corneal power difference maps (∆maps) of overall groups for (A) LASIK TNP ∆map 5mm pupil, (B) PRK TNP ∆map 5mm apex, and (C) SMILE TCRP ∆map 4mm apex vs †SIRC. Abbreviations: †SIRC, Surgically Induced Refractive Change (manifest refraction SEbefore - manifest refraction SEafter); TNP, True net power; TCRP, total corneal refractive power. |
To assess agreement, Bland-Altman plots were created for the most accurate corneal power ∆map in each group (see Figures 3–5). TNP ∆map at the 5mm pupil zone was the most accurate for the LASIK group overall and had 95% limit of agreement (LoA) range between −0.83D and +0.83D. TNP ∆map at the 5mm apex zone was most accurate for the PRK group overall and had 95% LoA range between −0.83D and +0.95D. TCRP ∆map at the 4mm apex zone was most accurate for SMILE group overall and had 95% LoA range from −0.97D to +0.99D No analysis was performed for the low myopia SMILE group due to sample size of only 2 eyes.
 |
Figure 3 Bland-Altman Agreement plots of most accurate corneal power difference maps (∆maps) for (A) LASIK overall, (B) PRK overall and (C) SMILE overall compared with †SIRC. The solid line represents the mean difference between the corneal power ∆maps and the †SIRC. The dotted lines represent the 95% LoA = mean ± 1.96*SD. Abbreviations: †SIRC, Surgically Induced Refractive Change (manifest refraction SEbefore - manifest refraction SEafter); TNP, true net power; TCRP, total corneal refractive power; SagF, sagittal front curvature power; RP, refractive power; LoA, limits of agreement. |
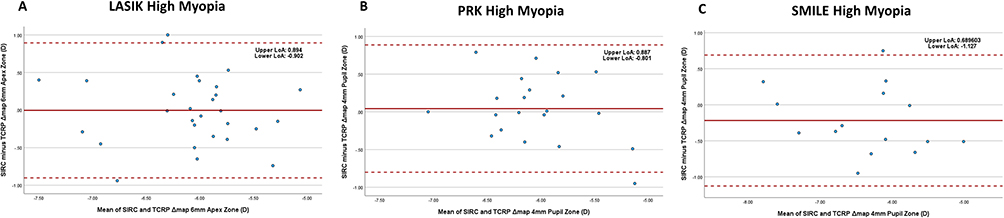 |
Figure 4 Bland-Altman Agreement plots of most accurate corneal power difference maps (∆maps) for (A) LASIK high myopia, (B) PRK high myopia and (C) SMILE high myopia compared with †SIRC. The solid line represents the mean difference between the corneal power ∆maps and the †SIRC. The dotted lines represent the 95% LoA = mean ± 1.96*SD. Abbreviations: †SIRC, Surgically Induced Refractive Change (manifest refraction SEbefore - manifest refraction SEafter); TNP, true net power; TCRP, total corneal refractive power; SagF, sagittal front curvature power; RP, refractive power; LoA, limits of agreement. |
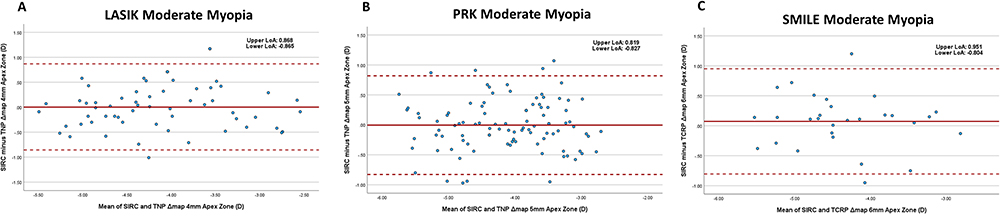 |
Figure 5 Bland-Altman Agreement plots of most accurate corneal power difference maps (∆maps) for (A) LASIK moderate myopia, (B) PRK moderate myopia and (C) SMILE moderate myopia compared with †SIRC. The solid line represents the mean difference between the corneal power ∆maps and the †SIRC. The dotted lines represent the 95% LoA = mean ± 1.96*SD. Abbreviations: †SIRC, Surgically Induced Refractive Change (manifest refraction SEbefore - manifest refraction SEafter); TNP, true net power; TCRP, total corneal refractive power; SagF, sagittal front curvature power; RP, refractive power; LoA, limits of agreement. |
Discussion
In this study, we evaluated the accuracy of various corneal power difference maps (∆maps) by comparing such changes to the surgically induced refractive change (SIRC) among three surgery groups: LASIK, PRK, and SMILE. We found that for the LASIK group overall, TNP ∆map 5mm pupil zone was most accurate. For the PRK group, TNP ∆map 5mm apex most closely matched SIRC. For SMILE, TCRP ∆map at the 4mm apex zone was most accurate. Interestingly, we noted that stratifying patients by degree of myopia may change which ∆map was most accurate. For high myopia, TCRP ∆map was the most accurate in all groups. For moderate myopia, TNP ∆map was superior for LASIK and PRK groups, but TCRP ∆map was most accurate for SMILE. In case of low myopia, RP ∆map was most accurate for LASIK group and SagF ∆map was most accurate for PRK group. The low myopia SMILE group had a sample size of 2 thus no meaningful conclusions can be drawn.
Several other studies have looked at the accuracy of different tomographic ∆maps. The results of these studies and the present study are summarized in Table 3. It is important to note that not all of these studies compared the same corneal power ∆maps or ∆map settings (centration, diameters, ring/zone, etc.), and did not all stratify their patients based on degree of myopia. Numerous studies reported that TCRP ∆map was most accurate after LASIK,18–20 PRK6,18 and SMILE8,20,21 given the point that TCRP ∆map takes into account more factors when calculating the corneal power than other ∆maps. In addition, several of these studies found that the accuracy of TCRP ∆map was better at smaller zones (see Table 3). For the overall LASIK and PRK groups, we found that TCRP ∆map 6mm apex zone was close to SIRC (difference of 0.19D and 0.29D respectively), but ultimately overestimated it, while TNP ∆map 5mm pupil and apex zones more accurately matched SIRC (see Table 2). One reason why our results differ may be due to the fact we did not compare measurements at smaller zones such as 2mm or 3mm which may have revealed more accurate TCRP ∆map calculations. Furthermore, our results showed that TCRP ∆maps (4, 5 and 6mm apex and pupil zones) more accurately measured the corneal power in high myopia patients, and thus it may be possible that our sample size contained less patients with high myopia compared to other studies that found TCRP ∆maps to be most accurate in LASIK and PRK. For SMILE, our results are consistent with other studies in that TCRP ∆maps (4mm, 6mm apex zones) were most accurate overall and for high and moderate myopia.
One important clinical application of corneal power measurement is IOL calculation after refractive surgery. Potvin et al studied the accuracy of different Pentacam corneal power maps in several formulas used to calculate IOL in post-myopic LASIK eyes. They found that TNP power measurement 4mm apex zone was most accurate for use in post-LASIK IOL calculations. Their results showed TCRP power measurement 4mm apex ring to also be close, though not as accurate.26 While it is important to compare the accuracy of different corneal power maps, the latter study showed TNP power measurement to be superior to TCRP power measurement with the current IOL calculation formulas used in clinical practice. As technologies continue to advance and new formulas are developed, TCRP power measurement may become more useful in this clinical application.
In the current study, we also investigated the accuracy of different corneal power ∆maps by degree of myopia. In regard to TCRP ∆maps (4, 5, and 6 mm apex and pupil zones), we saw a trend that as the degree of myopia decreased, the degree of overestimation by TCRP ∆maps increased. Mello et al found a similar trend in their study comparing conventional keratometry with total corneal power (TCP) ∆map (4mm apex zone), a ray-tracing measurement similar to TCRP ∆map. They observed that with higher levels of myopia, TCP ∆map would underestimate the corneal power.24 Our results showed that, except for high myopia, TNP ∆map was relatively close to SIRC in other degrees of myopia. Accuracy with SagF ∆map and RP ∆map was best at low degrees of myopia and decreased with higher degrees of myopia.
There was good correlation and agreement in each of the overall surgery groups (See Figures 2 and 3). The agreement between SIRC and the best corneal power ∆map in the overall groups was adequate with a 95% LoA range less than ± 1D for all three. Figures 4–6 demonstrate that there was less agreement in the high myopia groups when compared to lower myopia groups.
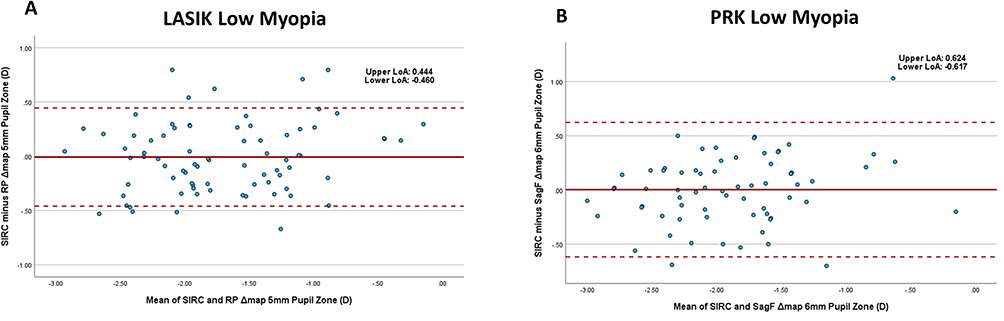 |
Figure 6 Bland-Altman Agreement plots of most accurate corneal power difference maps (∆maps) for (A) LASIK low myopia, and (B) PRK low myopia compared with †SIRC. No plot for SMILE low myopia group is shown given the small sample size of 2. The solid line represents the mean difference between the corneal power ∆maps and the †SIRC. The dotted lines represent the 95% LoA = mean ± 1.96*SD. Abbreviations: †SIRC, Surgically Induced Refractive Change (manifest refraction SEbefore - manifest refraction SEafter); TNP, true net power; TCRP, total corneal refractive power; SagF, sagittal front curvature power; RP, refractive power; LoA, limits of agreement. |
There have been several studies interested in determining the accuracy of centration over the pupil vs the apex with varying results.2,27,28 Whang et al preferred centration over the apex, given that the center of the pupil may change as the pupil changes shape.19 Qian et al8 and Savini et al10 opted for centration over the pupil. Naeser et al found there to be no significant difference in centration over pupil or apex.29 Our results were similar to the latter in that there appeared to be no clinically significant difference between ∆maps centered over the pupil or apex (see Table 2).
It has been shown that another method of measuring corneal power is by using optical coherence tomography (OCT).30 OCT has shown to be comparable to conventional keratometry31 and used for IOL calculations.32 Wang et al compared the measurements obtained by OCT to measurements obtained with the Pentacam in healthy, unoperated eyes. They found that OCT overestimated TNP power measurement.1 In 2022, Lischke et al compared corneal power measurements from OCT and TCRP in patients who received SMILE. They found that total keratometry (TK) measured with swept source OCT by the IOL Master 700 (Carl Zeiss Meditec AG, Jena, Germany) was superior in estimating the SIRC when compared with TCRP ∆map 4mm apex zone.33 OCT may have the potential for more accurate measurements of corneal power, however further studies should be conducted to better understand the comparisons between OCT accuracy and other corneal power measurements.
Our study has a few limitations. First, the surgery samples include eyes from the same patient. This may introduce bias into results given the correlation that exists between bilateral eyes. However, to address this issue, we randomly selected two sub groups of unilateral eyes and only reported the bilateral results that were congruent between both randomized, unilateral sub groups. This allowed for the power of our study to be increased, given the minimum sample size needed was 43 eyes, which was exceeded in all three surgery groups. Second, we focused on MRSE because the majority of our patients did not have high astigmatism and the steep and flat meridians are averaged in the corneal power measurements. However, it is important to acknowledge that our results may not apply to patients with high levels of astigmatism. It has furthermore been shown that refractive astigmatism, which is a subjective measurement, may not accurately reflect corneal astigmatism, an objective measurement.34 Further studies should be performed to evaluate how the degree of astigmatism influences the accuracy of corneal power measurements. Finally, our study did not include data from the Pentacam corneal power Equivalent-K Readings (EKR) ∆map. Further investigation should be performed to understand the comparisons of EKR with other Pentacam power ∆maps after various types of corneal refractive surgery, however we do provide a robust analysis with detailed stratification based on the level of MRSE among the other Pentacam corneal power ∆maps in a large sample with 1 year follow-up, including only patients who, indeed, achieved their attempted correction.
Conclusion
In conclusion, we found that the most accurate corneal power ∆maps after LASIK, PRK, and SMILE were TNP ∆map at the 4mm pupil zone, TNP ∆map at the 5mm Apex zone, and TCRP ∆map at the 4mm Apex zone, respectively. However, the accuracy may depend on the level of myopia with TRCP ∆maps (4, 5, 6mm apex and pupil zones) consistently being more accurate for patients with high myopia.
Disclosure
The authors report no conflicts of interest in this work.
References
1. Wang Q, Hua Y, Savini G, et al. Corneal power measurement obtained by Fourier-domain optical coherence tomography. Cornea. 2015;34(10):1266–1271. doi:10.1097/ICO.0000000000000564
2. Dong J, Zhang Y, Zhou J, et al. Comparison of corneal power and corneal astigmatism of different diameter zones centered on the pupil and corneal apex using scheimpflug tomography. Cornea. 2020;39(1):77–83. doi:10.1097/ICO.0000000000002052
3. Wang Q, Savini G, Hoffer KJ, et al. A comprehensive assessment of the precision and agreement of anterior corneal power measurements obtained using 8 different devices. PLoS One. 2012;7(9):e45607. doi:10.1371/JOURNAL.PONE.0045607
4. Queirós A, Villa-Collar C, Gutiérrezá ÁR, et al. Anterior and posterior corneal elevation after orthokeratology and standard and customized LASIK surgery. Eye Contact Lens. 2011;37(6):354–358. doi:10.1097/ICL.0B013E318232E32D
5. Rabsilber TM, Auffarth GU. IOL-Kalkulation nach refraktiver Chirurgie [IOL power calculation after refractive surgery]. Klin Monbl Augenheilkd. 2010;227(8):624–629. German. doi:10.1055/s-0029-1245594
6. Oh JH, Kim SH, Chuck RS, Park CY. Evaluation of the pentacam ray tracing method for the measurement of central corneal power after myopic photorefractive keratectomy. Cornea. 2014;33(3):261–265. doi:10.1097/ICO.0000000000000034
7. Ho JD, Tsai CY, Tsai RJF, Kuo LL, Tsai -lun I, Liou SW. Validity of the keratometric index: evaluation by the Pentacam rotating Scheimpflug camera. J Cataract Refract Surg. 2008;34(1):137–145. doi:10.1016/j.jcrs.2007.09.033
8. Qian Y, Liu Y, Zhou X, Naidu RK. Comparison of corneal power and astigmatism between simulated keratometry, true net power, and total corneal refractive power before and after SMILE surgery. J Ophthalmol. 2017;2017:1–8. doi:10.1155/2017/9659481
9. Savini G, Barboni P, Carbonelli M, Hoffer KJ. Accuracy of corneal power measurements by a new Scheimpflug camera combined with Placido-disk corneal topography for intraocular lens power calculation in unoperated eyes. J Cataract Refract Surg. 2012;38(5):787–792. doi:10.1016/j.jcrs.2011.11.037
10. Savini G, Calossi A, Camellin M, Carones F, Fantozzi M, Hoffer KJ. Corneal ray tracing versus simulated keratometry for estimating corneal power changes after excimer laser surgery. J Cataract Refract Surg. 2014;40(7):1109–1115. doi:10.1016/J.JCRS.2013.11.032
11. Barkana Y, Gerber Y, Elbaz U, et al. Central corneal thickness measurement with the Pentacam Scheimpflug system, optical low-coherence reflectometry pachymeter, and ultrasound pachymetry. J Cataract Refract Surg. 2005;31(9):1729–1735. doi:10.1016/j.jcrs.2005.03.058
12. Lackner B, Schmidinger G, Skorpik C. Validity and repeatability of anterior chamber depth measurements with pentacam and orbscan. Optometry Vision Sci. 2005;82(9):858–861. doi:10.1097/01.opx.0000177804.53192.15
13. OCULUS Inc. Topography maps. Pentacam.com. Available from: https://www.pentacam.com/us/technology/topography-maps.html.
14. Moshirfar M, Brown TW, Heiland MB, Rosen DB, Ronquillo YC, Hoopes PC. Comparative analysis of LASIK flap diameter and its centration using two different femtosecond lasers. Med Hypothesis Discov Innov Ophthalmol. 2019;8(3):241–249.
15. Mifflin MD, Betts BS, Frederick PA, et al. Efficacy and safety of a 3-month loteprednol etabonate 0.5% gel taper for routine prophylaxis after photorefractive keratectomy compared to a 3-month prednisolone acetate 1% and fluorometholone 0.1% taper. Clin Ophthalmol. 2017;11:1113–1118. doi:10.2147/OPTH.S138272
16. Payne CJ, Webster CR, Moshirfar M, Handlon JJ, Ronquillo YC, Hoopes PC. One-year visual outcomes and corneal higher-order aberration assessment of small-incision lenticule extraction for the treatment of myopia and myopic astigmatism. J Clin Med. 2022;11(21):6294. doi:10.3390/jcm11216294
17. Pan C, Tan W, Savini G, et al. A comparative study of total corneal power using a ray tracing method obtained from 3 different scheimpflug camera devices. Am J Ophthalmol. 2020;216:90–98. doi:10.1016/j.ajo.2020.03.037
18. Savini G, Hoffer KJ, Carbonelli M, Barboni P. Scheimpflug analysis of corneal power changes after myopic excimer laser surgery. J Cataract Refract Surg. 2013;39(4):605–610. doi:10.1016/j.jcrs.2012.12.031
19. Whang WJ, Yoo YS, Joo CK. Corneal power changes with Scheimpflug rotating camera after hyperopic LASIK. Medicine. 2018;97(50):e13306. doi:10.1097/MD.0000000000013306
20. Gyldenkerne A, Ivarsen A, Hjortdal JO. Assessing the corneal power change after refractive surgery using Scheimpflug imaging. Ophthalmic Physiological Optics. 2015;35(3):299–307. doi:10.1111/OPO.12202
21. Pan C, Tan W, Hua Y, Lei X, Grulkowski I. Comprehensive evaluation of total corneal refractive power by ray tracing in predicting corneal power in eyes after small incision lenticule extraction. PLoS One. 2019;14(6):e0217478. doi:10.1371/journal.pone.0217478
22. Lischke R, Mayer WJ, Feucht N, et al. Total keratometry for determination of true corneal power after myopic small-incision lenticule extraction. J Cataract Refract Surg. 2021;47(10):1285–1289. doi:10.1097/J.JCRS.0000000000000630
23. Ng ALK, Chan TCY, Cheng ACK. Comparison of different corneal power readings from pentacam in post-laser in situ keratomileusis eyes. Eye Contact Lens. 2018;44(Suppl 2):S370–S375. doi:10.1097/ICL.0000000000000503
24. Mello GR, Roberts CJ, Smadja D, Serpe CC, Krueger RR, Santhiago MR. Comparison of keratometric changes after myopic ablation: ray tracing versus simulated keratometry. J Refract Surg. 2013;29(9):604–610. doi:10.3928/1081597X-20130723-03
25. Savini G, Barboni P, Profazio V, Zanini M, Hoffer KJ. Corneal power measurements with the Pentacam Scheimpflug camera after myopic excimer laser surgery. J Cataract Refract Surg. 2008;34(5):809–813. doi:10.1016/j.jcrs.2008.01.012
26. Potvin R, Hill W. New algorithm for intraocular lens power calculations after myopic laser in situ keratomileusis based on rotating Scheimpflug camera data. J Cataract Refract Surg. 2015;41(2):339–347. doi:10.1016/j.jcrs.2014.05.040
27. Wachler BSB, Korn TS, Chandra NS, Michel FK. Decentration of the optical zone: centering on the pupil versus the coaxially sighted corneal light reflex in LASIK for hyperopia. J Refract Surg. 2003;19(4):464–465. doi:10.3928/1081-597X-20030701-17
28. Arbelaez MC, Vidal C, Arba-Mosquera S. Clinical outcomes of corneal vertex versus central pupil references with aberration-free ablation strategies and LASIK. Invest Ophthalmol Vis Sci. 2008;49(12):5287–5294. doi:10.1167/iovs.08-2176
29. Næser K, Savini G, Bregnhøj JF. Corneal powers measured with a rotating Scheimpflug camera. Br J Ophthalmol. 2016;100(9):1196–1200. doi:10.1136/bjophthalmol-2015-307474
30. Dong J, Yao J, Chang S, Kanclerz P, Khoramnia R, Wang X. Comparison of mean corneal power of annular rings and zones using swept-source optical coherence tomography. Diagnostics. 2022;12(3):754. doi:10.3390/diagnostics12030754
31. Tang M, Chen A, Li Y, Huang D. Corneal power measurement with Fourier-domain optical coherence tomography. J Cataract Refract Surg. 2010;36(12):2115–2122. doi:10.1016/j.jcrs.2010.07.018
32. Minami K, Kataoka Y, Matsunaga J, Ohtani S, Honbou M, Miyata K. Ray-tracing intraocular lens power calculation using anterior segment optical coherence tomography measurements. J Cataract Refract Surg. 2012;38(10):1758. doi:10.1016/j.jcrs.2012.05.035
33. Lischke R, Shajari M, Feucht N, et al. OCT- versus scheimpflug-based total corneal power measurements changes in myopic astigmatic SMILE procedures. Curr Eye Res. 2022;47(1):12–17. doi:10.1080/02713683.2021.1962362
34. Bohac M, Biscevic A, Shijakova V, Gabric I, Gabric K, Patel S. Comparison between the change in total corneal astigmatism and actual change in refractive astigmatism in transepithelial photorefractive keratectomy (tPRK), laser in situ keratomileusis (LASIK) and femtosecond laser assisted laser in situ keratomileusis (FsLASIK). Eur J Ophthalmol. 2022;32(5):2638–2645. doi:10.1177/11206721211059327
 © 2023 The Author(s). This work is published and licensed by Dove Medical Press Limited. The
full terms of this license are available at https://www.dovepress.com/terms
and incorporate the Creative Commons Attribution
- Non Commercial (unported, 3.0) License.
By accessing the work you hereby accept the Terms. Non-commercial uses of the work are permitted
without any further permission from Dove Medical Press Limited, provided the work is properly
attributed. For permission for commercial use of this work, please see paragraphs 4.2 and 5 of our Terms.
© 2023 The Author(s). This work is published and licensed by Dove Medical Press Limited. The
full terms of this license are available at https://www.dovepress.com/terms
and incorporate the Creative Commons Attribution
- Non Commercial (unported, 3.0) License.
By accessing the work you hereby accept the Terms. Non-commercial uses of the work are permitted
without any further permission from Dove Medical Press Limited, provided the work is properly
attributed. For permission for commercial use of this work, please see paragraphs 4.2 and 5 of our Terms.