Back to Journals » Research and Reports in Urology » Volume 11
Comparison of cancer detection rates by transrectal prostate biopsy for prostate cancer using two different nomograms based on patient’s age and prostate volume
Authors Hori S ![]() , Tanaka N
, Tanaka N ![]() , Nakai Y, Morizawa Y
, Nakai Y, Morizawa Y ![]() , Tatsumi Y, Miyake M
, Tatsumi Y, Miyake M ![]() , Anai S, Fujii T, Konishi N, Nakagawa Y, Hirao S, Fujimoto K
, Anai S, Fujii T, Konishi N, Nakagawa Y, Hirao S, Fujimoto K
Received 8 November 2018
Accepted for publication 29 January 2019
Published 19 March 2019 Volume 2019:11 Pages 61—68
DOI https://doi.org/10.2147/RRU.S193933
Checked for plagiarism Yes
Review by Single anonymous peer review
Peer reviewer comments 2
Editor who approved publication: Dr Jan Colli
Shunta Hori,1 Nobumichi Tanaka,1 Yasushi Nakai,1 Yosuke Morizawa,1 Yoshihiro Tatsumi,1 Makito Miyake,1 Satoshi Anai,1 Tomomi Fujii,2 Noboru Konishi,2 Yoshinori Nakagawa,3 Syuya Hirao,4 Kiyohide Fujimoto1
1Department of Urology, Nara Medical University, Kashihara, Nara 634-8522, Japan; 2Department of Pathology, Nara Medical University, Kashihara, Nara 634-8522, Japan; 3Department of Urology, Yamatotakada Municipal Hospital, Yamatotakada, Nara 635-8501, Japan; 4Department of Urology, Medical Corporation Katsurakai HIRAO Hospital, Kashihara, Nara 634-0076, Japan
Background: The aim of this study is to evaluate the efficacy of two different Nara Urological Research and Treatment Group (NURTG) nomograms allocating 6–12 biopsy cores based on age and prostate volume.
Materials and methods: From April 2006 to July 2014, a total of 1,605 patients who underwent initial prostate biopsy were enrolled. Based on a nomogram taking the patient’s age and prostate volume into consideration, 6–12 biopsy cores were allocated. Two types of nomogram were used, for the former group (before March 2009) and latter group (March 2009 onward). Cancer detection rates in all patients and those with prostate-specific antigen values in the gray zone (4.0–10 ng/mL) were compared. Predictive parameters for detection of prostate cancer in gray-zone patients were also investigated.
Results: The cancer detection rates in all patients and those in the gray zone were 48% and 38% in the former group and 54% and 41% in the latter group, respectively. The cancer detection rate in all patients was significantly higher in the latter group compared with the former group, but detection in gray-zone patients did not show a significant difference between the two groups (P=0.011 and P=0.37, respectively). Multivariate analysis indicated that age, digital rectal examination, prostate volume, transrectal ultrasonography findings, and volume/biopsy ratio were significant predictive parameters in gray-zone patients. The clinically insignificant cancer detection rate was significantly lower in the latter group compared with the former group (P=0.0008).
Conclusion: The latter nomogram provided more acceptable detection rates of clinically significant and insignificant cancer than the former one, and we consider that an initial maximum 12-core transrectal ultrasound-guided needle biopsy may be sufficient for prostate cancer diagnosis.
Keywords: age, cancer detection rate, nomogram, prostate cancer, prostate volume, transrectal prostate biopsy
Introduction
Prostate cancer is the second most common cancer in men all over the world. In Japan, prostate cancer is the fourth most common cancer in men and the ninth most common cause of death.1–3 Since Hodge et al reported the sextant systematic biopsy in 1989,3 the number of cores has gradually increased to improve the detection rate for prostate cancer. Remzi et al introduced the Vienna nomogram, allocating a number of 6–18 (mean 10) cores based on patients’ age and the total prostate volume (PV). They concluded that the cancer detection rate was 36.7% in patients with prostate-specific antigen (PSA) levels of 2–10 ng/mL. Cancer detection was significantly improved (66.4%) compared to the control group, which underwent octant biopsies.4 PV is one of the risk factors leading to prostate cancer being missed with prostate biopsy owing to sampling errors in the case of a large prostate. Tanaka et al showed that a small prostate is an important factor in prostate cancer detection and therefore focused on PV to decide the number of cores.5 On the other hand, a systematic review showed that sampling of more than 12 cores was not associated with improved cancer detection rates.6 Age is also a very important factor in the development of prostate cancer, and PSA values of patients in their 50s could predict significant prostate cancer 20–30 years later.7 Thus, we introduced the Nara Urological Research and Treatment Group (NURTG) nomogram and revealed that this nomogram, allocating a number of 6–12 cores based on patients’ age and total prostate volume, is an acceptable way to detect prostate cancer at initial biopsy.5
In March 2009, we modified the NURTG nomogram to confirm that increasing the number of cores in patients in their 60s led to an improved cancer detection rate. In the former period (ie, before March 2009) we divided patients into four age groups (≤59, 60–64, 65–69, and ≥70 years), and in the latter period (ie, March 2009 onward) we divided patients into four different age groups (≤69, 70–74, 75–79, and ≥80 years). To evaluate the efficacy of the updated NURTG nomogram allocating 6–12 biopsy cores based on age and PV, we investigated the cancer detection rate comparing the two groups (former group and latter group) and analyzed the predictive factors for prostate cancer.
Material and methods
Patient selection
This prospective study was conducted at Nara Medical University and its two affiliate hospitals (Yamato Takada Municipal Hospital and Hirao Hospital). From April 2006 to July 2014, a total of 1,605 patients who underwent initial prostate biopsy were enrolled. The indication criteria for biopsy were abnormal PSA value, abnormal findings on digital rectal examination (DRE), and abnormal findings by transrectal ultrasound (TRUS).
Ethics approval and consent to participate
This study was approved by the institutional review board (IRB) of the Nara Medical University (Medical Ethics Committee ID: NMU-686) and complied with the 1964 Helsinki Declaration and its later amendments. As the data for the study were obtained through retrospective chart review, a waiver of informed consent was approved by the IRB. Personal information linked to research subjects and donors was anonymized (when necessary, the information was labeled with an identifying code to make it possible to distinguish between the individuals). Then, deidentified patient data were analyzed.
Nomograms
We adopted the age-specific reference range of PSA as the cut-off value of PSA.8 The number of allocated biopsy cores was from 6 to 12 depending on the patient’s age and PV (NURTG nomogram). We have updated the NURTG nomogram since March 2009. In the former period (from January 2006 to February 2009), we had divided patients into four age groups (≤59, 60–64, 65–69, and ≥70 years), and in the latter period (from March 2009 to July 2014) into four different age groups (≤69, 70–74, 75–79, and ≥80 years). In the former period, 936 patients underwent prostate biopsy; and in the latter period, 669 patients underwent the procedure. Comparison between the two nomograms is shown in Figure 1. The principal biopsy regime was sextant systematic biopsy under TRUS guidance. Additional cores were located in the far-lateral region (Figure 2). Two pathologists (KN and TF), who are both experts in prostate cancer diagnosis, centrally reviewed the Gleason score of all biopsy specimens.
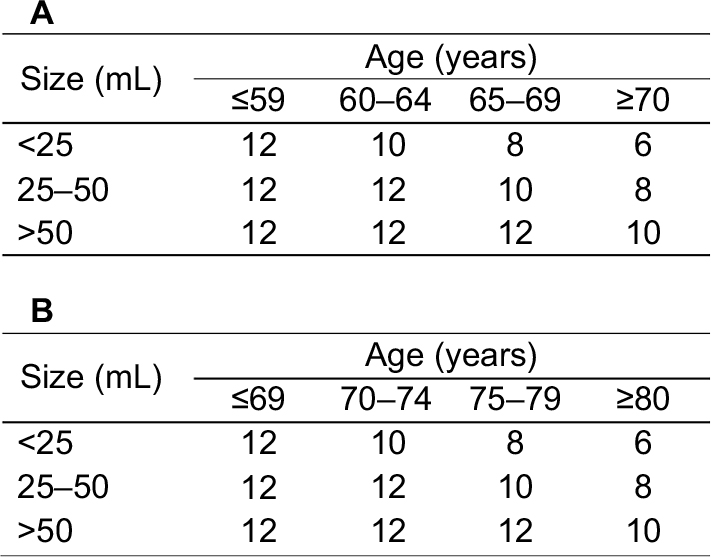 | Figure 1 Nara Urological Research and Treatment Group nomogram. Notes: (A) In the former group (January 2006 to February 2009), patients were divided into four groups according to age (≤59, 60–64, 65–69, and ≥70 years) and prostate volume. (B) In the latter group (March 2009 to July 2014), we changed the age ranges (≤69, 70–74, 75–79, and ≥80 years). |
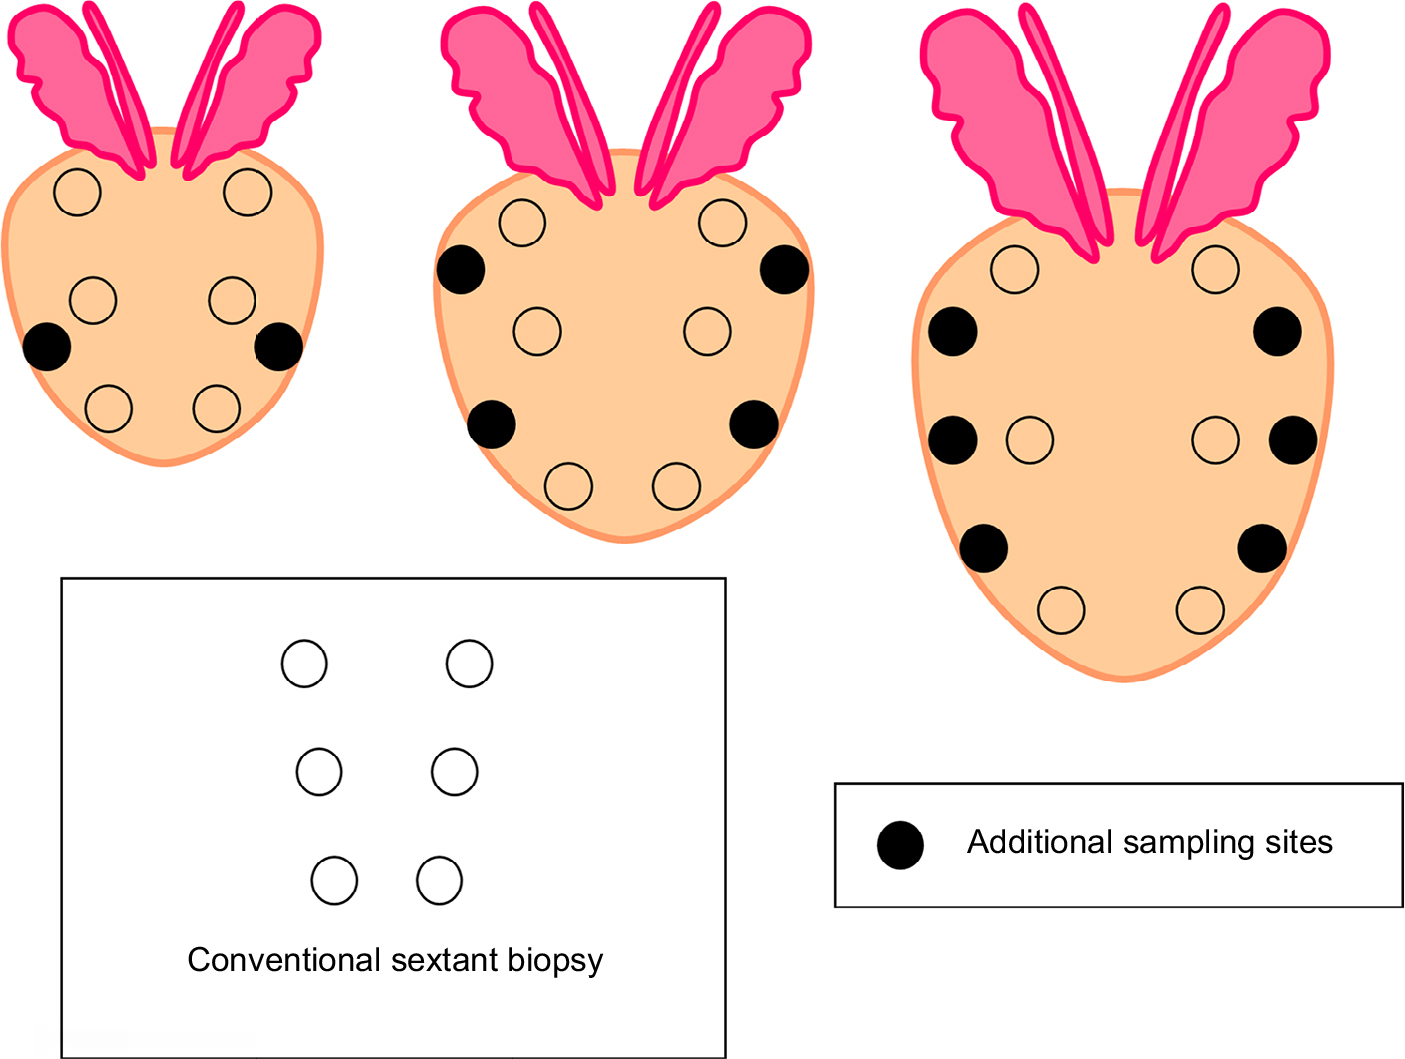 | Figure 2 The conventional and additional sites of biopsy cores using transrectal ultrasonography. |
Statistical analysis
We evaluated the cancer detection rate of the NURTG nomogram in all patients and patients with a PSA value in the gray zone (4.0–10 ng/mL). We also compared the cancer detection rates between the two groups and investigated the predictive parameters to detect prostate cancer. The statistical difference between the cancer group and the noncancer group for categorical variables was tested by the chi-squared test, while that for continuous variables was tested by the nonparametric Mann–Whitney test. To elucidate the predictive parameters of cancer detection in the gray zone, logistic regression analysis was carried out. PSA, period of prostate biopsy, DRE, PV, TRUS, prostate-specific antigen density (PSAD), and volume/biopsy ratio (VBR)9 were analyzed for the predictive parameters. We also evaluated the clinically insignificant cancer detection rate. We defined clinically insignificant prostate cancer as a PSA of ≤10 ng/mL, Gleason score of 3+3, clinical T1c or T2, and positive core number of two or fewer.10,11 All statistical analyses were performed using PASW Statistics 17.0 (SPSS Inc., Chicago, IL, USA). All P-values of <0.05 were considered statistically significant.
Results
Patient characteristics
The patient characteristics are shown in Table 1. The median age and PSA value for all 1,605 patients were 71 years and 7.5 ng/mL, respectively. Of the 1,605 patients, 813 had prostate cancer (51%). In the former group, the median age, PSA value, and cancer detection rate were 71 years, 7.1 ng/mL, and 48% (449/936), respectively; and in the latter group, these were 71 years, 8.1 ng/mL, and 54% (364/669), respectively.
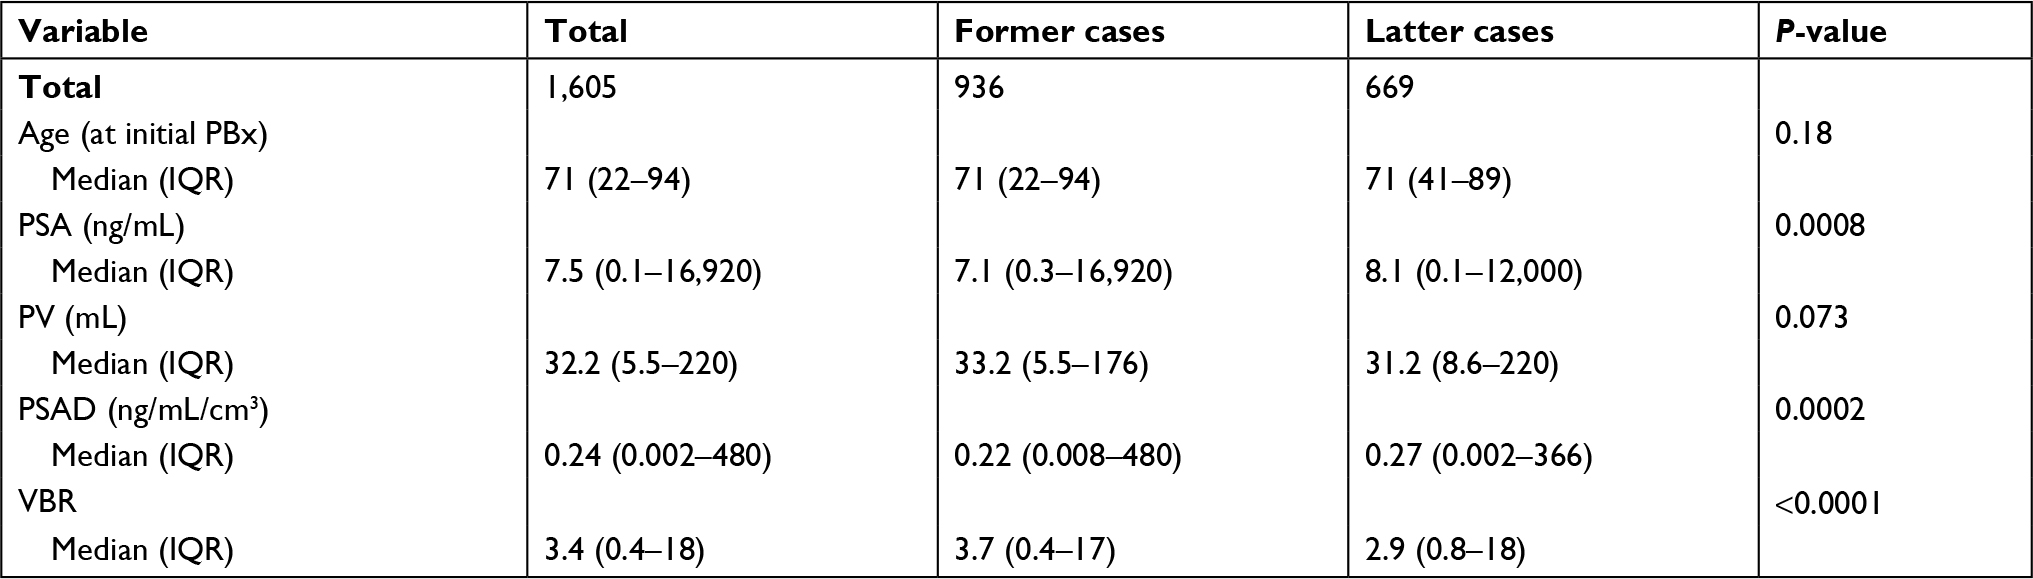 | Table 1 Patients’ background at the initiation of prostate biopsy Note: Former cases are from January 2006 to February 2009; latter cases from March 2009 to July 2014. Abbreviations: PBx, prostate biopsy; PSA, prostate-specific antigen; PSAD, prostate-specific antigen density; PV, prostate volume; VBR, volume/biopsy ratio. |
Cancer detection rate in total patients
The cancer detection rates in the former group, stratified by PSA value from 0 to <4, 4−<10, 10−<20, 20−<30, 30−<40, 40−<50, 50−<100 and ≥100 ng/mL, were 21%, 38%, 58%, 80%, 88%, 100%, 93%, and 100%, respectively. The cancer detection rate gradually increased with increasing PSA value. Similarly, the cancer detection rate in the latter group stratified by the same PSA values was 35%, 41%, 63%, 82%, 87%, 100%, 95%, and 100%, respectively, and the cancer detection rate also gradually increased with increasing PSA value.
Table 2 shows the cancer detection rates in patients with each PV stratified by patient age of ≤59, 60–64, 65–69, 70–74, 75–79, and ≥80 years in the former group. With small PV (<25 mL), the cancer detection rate of older patients (≥75 years) was significantly higher compared with that of younger patients (P<0.0001). The cancer detection rates in patients with medium PV (25–50 mL) gradually increased with increase in age and the cancer detection rate in older patients (≥75 years) was significantly higher compared with that in younger patients (P=0.0009). The cancer detection rate in older patients with large PV (>50 mL) was also significantly higher compared with that in younger patients (P<0.0001). Table 3 shows the cancer detection rates in patients with each PV stratified by patient age of ≤59, 60–64, 65–69, 70–74, 75–79, and ≥80 years in the latter group. The cancer detection rates of patients with small PV (<25 mL) were similar at all ages except in the youngest group (≤59 years), and the cancer detection rate of patients with medium PV (25–50 mL) was significantly higher compared with that in younger patients (P<0.0001). The cancer detection rate of older patients with large PV (>50 mL) was significantly higher compared with that of younger patients (P=0.0003).
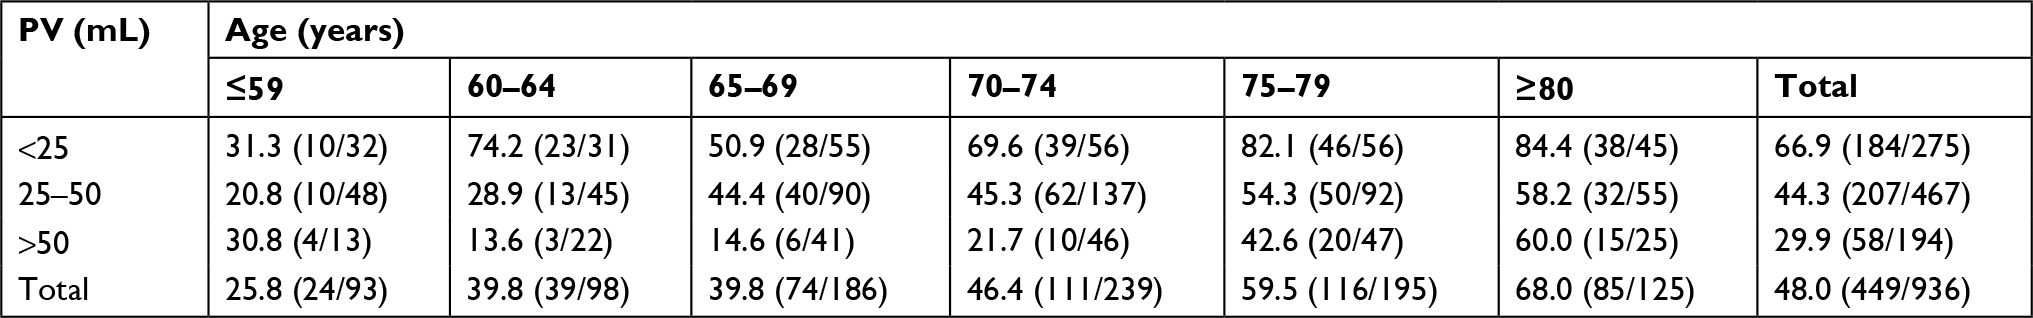 | Table 2 Cancer detection rate of all patients in the former group (January 2006 to February 2009) Note: Data presented as % (n). Abbreviation: PV, prostate volume. |
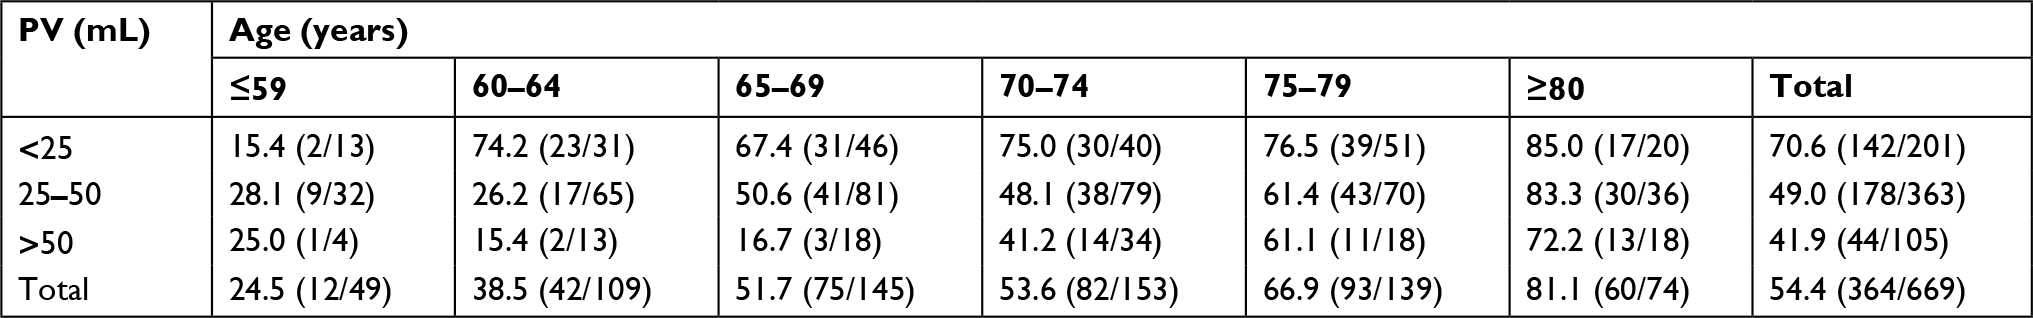 | Table 3 Cancer detection rate of all patients in the latter group (March 2009 to July 2014) Note: Data presented as % (n). Abbreviation: PV, prostate volume. |
The cancer detection rate in all patients was significantly higher in the latter group compared with the former group (P=0.011) (Table 4). When comparing the NURTG nomograms, the cancer detection rates in patients of 65–69 years and those of ≥80 years in the latter group were significantly higher than those in the former group, respectively (P=0.034, P=0.049). The cancer detection rate in patients with PV of >50 mL in the latter group was also significantly higher than that in the former group (P=0.041). In contrast, in multivariate analysis for predictive factors for cancer detection in all patients, difference between the nomograms was not an independent factor (data not shown).
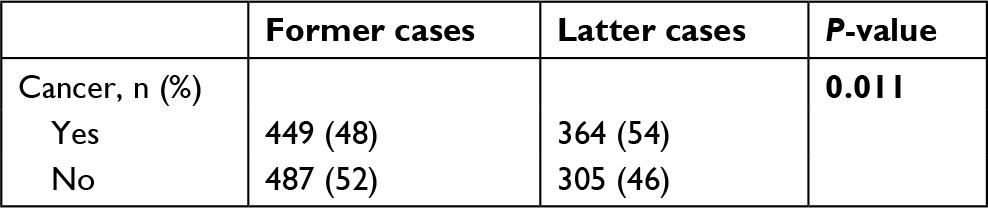 | Table 4 Comparison of cancer detection rates between nomograms of the former group (January 2006 to February 2009) and latter group (March 2009 to July 2014) |
Cancer detection rate in patients with a PSA value in the gray zone
We also evaluated the cancer detection rate in patients with a serum PSA level ranging from 4.0 to 10.0 ng/mL (gray zone). In the former group, the median age and PSA value were 71 years and 5.5 ng/mL, respectively, and the cancer detection rate was 38% (206/548). On the other hand, in the latter group, the median age and PSA value were 69 years and 6.3 ng/mL, respectively, and the cancer detection rate was 41% (149/366).
Table 5 shows the cancer detection rates in the PSA gray zone with each PV stratified by patient age of ≤59, 60–64, 65–69, 70–74, 75–79, and ≥80 years for the former group. The cancer detection rate in patients with small (<25 mL) and medium (25–50 mL) PV increased with increasing age, but there were no significant differences between these two groups. The cancer detection rate in older patients (≥75 years) with a large PV (>50 mL) was significantly higher compared with that in younger patients (P=0.017). Table 6 shows the cancer detection rates in the PSA gray zone with each PV in the latter group. The cancer detection rate in patients with medium (25–50 mL) and large (>50 mL) PV increased with increasing age, but there were no significant differences between the two groups.
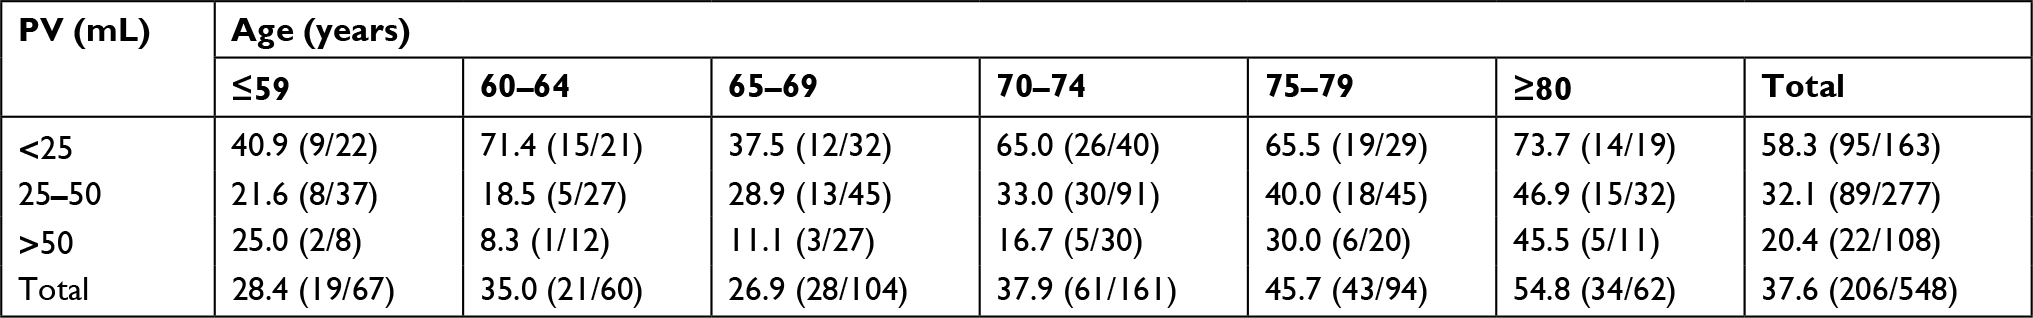 | Table 5 Cancer detection rate of patients with PSA gray zone in the former group (January 2006 to February 2009) Note: Data presented as % (n). Abbreviations: PSA, prostate-specific antigen; PV, prostate volume. |
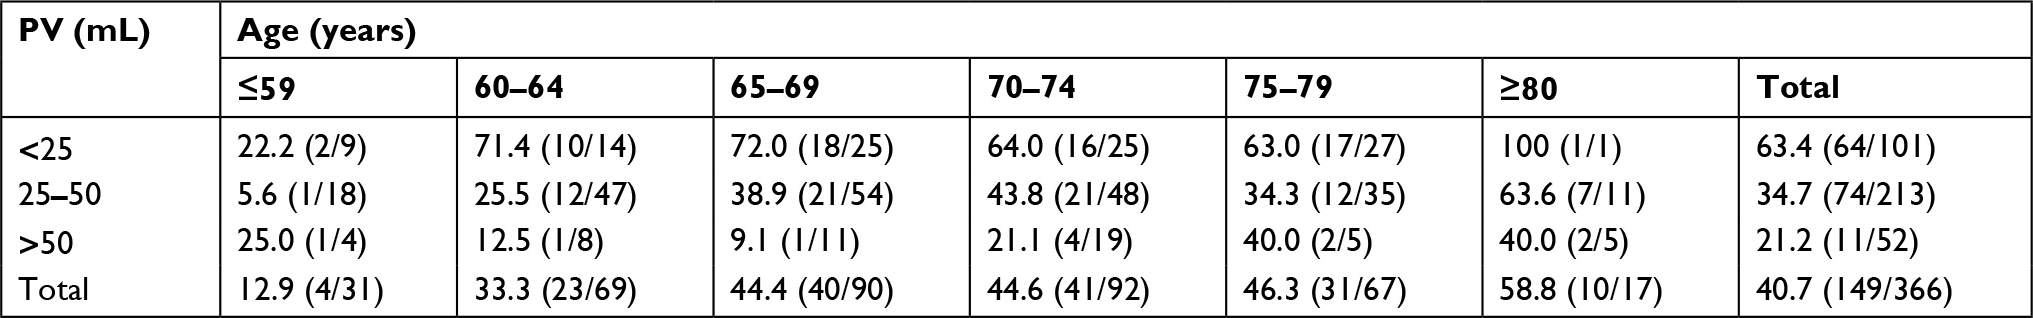 | Table 6 Cancer detection rate of patients with PSA gray zone in the latter group (March 2009 to July 2014) Note: Data presented as % (n). Abbreviations: PSA, prostate-specific antigen; PV, prostate volume. |
The cancer detection rate in the PSA gray zone was 38% (206/548) in the former group and 41% (149/366) in the latter group, and there were no significant differences between the two groups (P=0.37). In subgroup analysis, the cancer detection rate in patients of 65–69 years in the latter group was significantly higher than that in the former group. Regarding the predictive parameter of cancer detection in the gray zone, age, DRE, PV, TRUS, and VBR were significant predictors of cancer detection in multivariate analysis (Table 7).
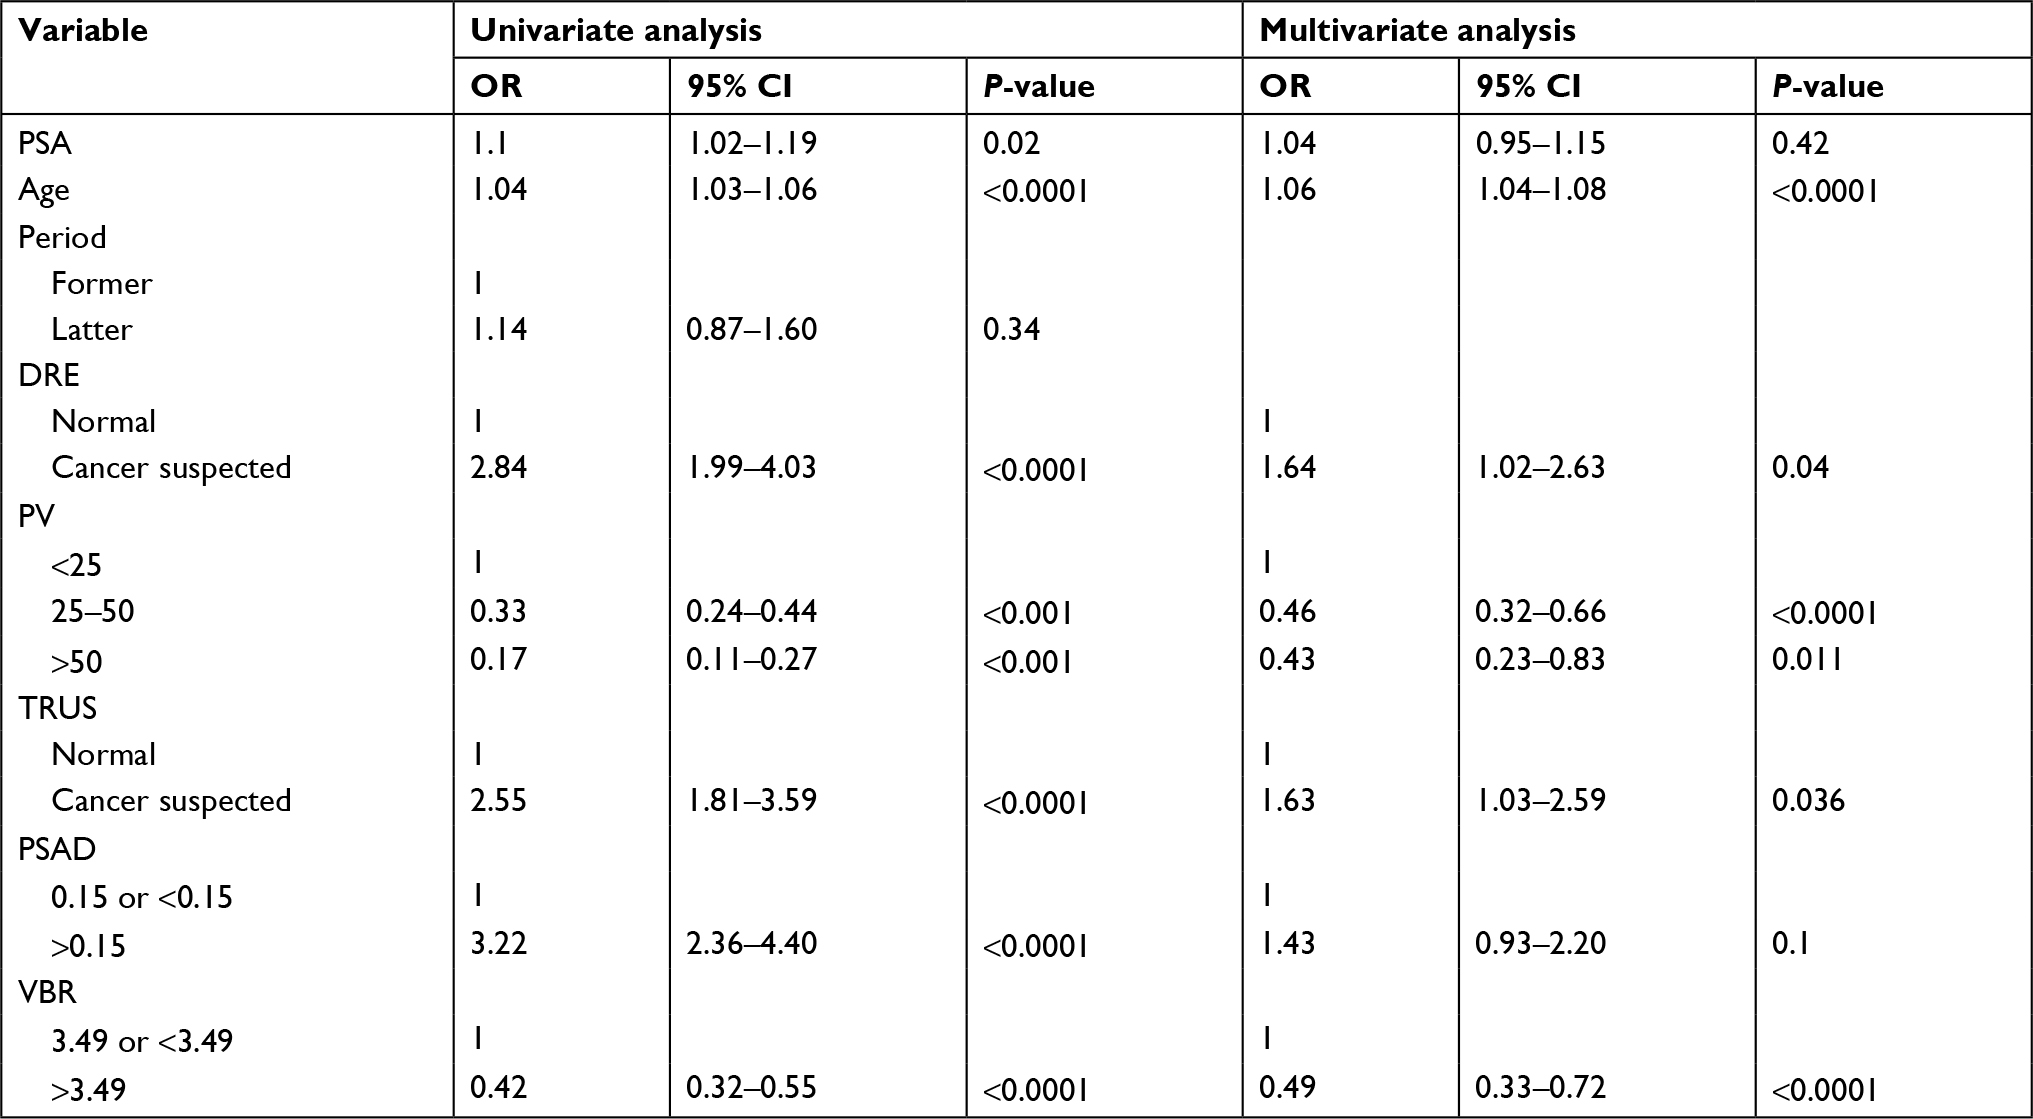 | Table 7 Logistic regression analysis of predictive factors for cancer detection in patients with PSA gray zone Note: Former period, January 2006 to February 2009; latter period, March 2009 to July 2014. Abbreviations: DRE, digital rectal examination; PSA, prostate-specific antigen; PSAD, prostate-specific antigen density; PV, prostate volume; TRUS, transrectal ultrasonography; VBR, volume/biopsy ratio. |
Insignificant cancer detection rate
With regard to the clinically insignificant cancer detection rate, 66 out of 449 patients (14.7%) in the former group and 26 out of 364 patients (7.1%) in the latter group were diagnosed with clinically insignificant cancer. There was a significant difference between the two groups (P=0.0008) (Table 8).
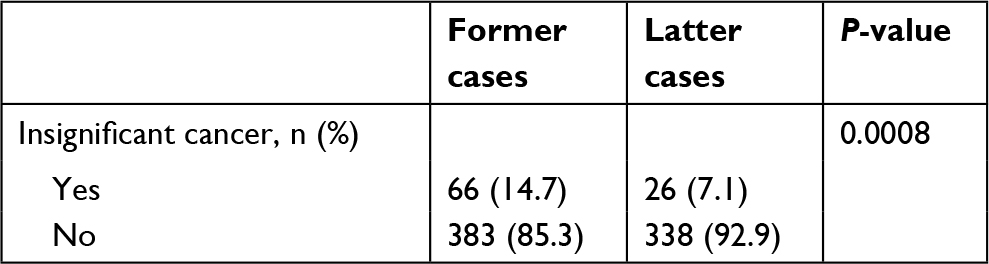 | Table 8 Insignificant cancer detection rates Note: Former cases are from January 2006 to February 2009; latter cases from March 2009 to July 2014. |
Discussion
In our previous reports on prostate biopsy,11,12 we had adopted six to eight biopsy cores, and the cancer detection rate in all patients and patients in the gray zone provided good results. Tanaka et al indicated a total cancer detection rate and cancer detection rate in the gray zone of 48% and 38%, respectively.5 In this study, the cancer detection rate in all patients in the two groups was 48% and 54%, respectively. The cancer detection rate of patients in the gray zone in the two groups was 38% and 41%, respectively. Using our nomogram, the cancer detection rate increased to an acceptable percentage.
Hodge et al first reported the usefulness of the systematic sextant biopsy in 1989.3 Eichler et al reported that an increase in the number of cores was significantly associated with an increased cancer detection rate, but sampling of more than 12 cores did not improve the cancer detection rate.13 The present study showed that the cancer detection rate was similar to that in previous reports and the cancer detection rate in all patients was significantly higher in the latter group than the former group, especially in patients aged 65–69 years.4,14–16 This may be because the latter nomogram indicated sampling from 12 sites regardless of PV. To detect prostate cancer accurately, we should add some additional sampling to the conventional sextant biopsy method. In patients aged 70–79 years, there were no significant differences in the cancer detection rate between the two groups. This suggests the possibility of decreasing the number of cores in older patients (≥70 years) for the initial biopsy. In patients aged ≥80 years, the cancer detection rate was significantly higher in the latter group compared with the former group. Therefore, a maximum of 10 cores is considered sufficient to diagnose prostate cancer, and it is also possible to reduce the number of cores to fewer than 10.
Ung et al reported the relationship between PV and cancer detection rate. They showed a total cancer detection rate of 33%, and patients with a smaller PV had a significantly higher cancer detection rate.15 Remzi et al reported the Vienna nomogram in 2005, according to which 6–18 cores are sampled based on patient’s age and PV, and showed a cancer detection rate of 36% in patients with a PSA value of 2–10 ng/mL.4 Kawakami et al reported a three-dimensional combination of transrectal and transperineal prostate biopsy. They sampled 26 cores and showed a cancer detection rate of 36%.14 Our present study showed a cancer detection rate in all patients and in patients in the gray zone of 54% and 41%, respectively, in the latter group. This result is similar to or higher than those of previous reports. In the present study, the cancer detection rate in both groups gradually decreased with an increase in PV. We believe that 12 cores at a maximum may be sufficient as the initial biopsy and recommend a repeated saturation biopsy as a second biopsy if prostate cancer is strongly suspected.17
We also investigated the predictive factors of prostate cancer detection in the gray zone. We have previously reported predictive factors in the gray zone as age, PV, DRE, and PSA transition zone density.12 In our present study, VBR was also one of the predictive factors. Jiang et al first reported VBR to estimate the optimum number of biopsy cores in 2010. VBR was determined by dividing the PV by the number of cores. They showed that a VBR of 2–4 provided a higher cancer detection rate and prevented excessive biopsies in patients with a PSA value of <20 ng/mL.8 VBR is a useful predictive factor and it is easy to calculate VBR in a busy clinical practice.
The usefulness of magnetic resonance imaging-targeted biopsy (MRI-TBx) has also been reported. Schoots et al reported that there was not a significant difference in the total cancer detection rate between MRI-TBx and transrectal ultrasound-guided biopsy (TRUS-Bx). However, the detection rate of clinically significant prostate cancer was higher with MRI-TBx than with TRUS-Bx, and the detection rate of clinically insignificant prostate cancer was lower with MRI-TBx than with TRUS-Bx.18 MRI/TRUS fusion prostate biopsy is also performed at some institutions. Okoro et al reported that fusion biopsy was superior to systematic 12-core biopsy for the detection of prostate cancer volume in patients under active surveillance.19 Baco et al reported that the cancer detection rate using computer-assisted fusion biopsy was 59% and the cancer detection rate using the traditional 12-core biopsy was 54%. There was not a significant difference between the two groups. The clinically significant cancer detection rate by computer-assisted fusion biopsy and traditional 12-core biopsy was 44% and 49%, respectively.20 In the present study, the detection rate of clinically insignificant cancer using the NURTG nomogram in the former and latter groups was 14.7% and 7.1%, respectively. The reason for this difference is not certain. Although the definition of clinically insignificant cancer was different between the previous studies and our study, our detection rate of clinically significant cancer was acceptable. Vashi et al suggested that in younger men with a higher life expectancy, smaller cancers have to be detected, and hence more cores are needed, while older men may require fewer biopsy cores to avoid oversampling and overtreatment.21 We designed the number of prostate biopsy cores to avoid the detection of clinically insignificant cancer in elderly men and to definitely detect clinically significant cancer in younger men. We believe that the NURTG nomogram, especially in the latter period, is one way to increase the detection rate of prostate cancer, since it is easily available, even in a busy clinical practice, and decreases the costs for patients. Further improvement is needed to avoid unnecessary sampling and to achieve higher levels of safety and more convenient examinations.
This study has some limitations. First, this was a nonrandomized comparative study. Therefore, various kinds of bias may affect the differences in cancer detection and clinically significant cancer detection rates between the two groups. There were significant differences between the two groups at baseline. Second, we compared the two nomograms in two different eras. To reduce era bias, we should compare the two nomograms simultaneously in the same era. However, in multivariate analysis, the modified NURTG nomogram significantly correlated with a better detection rate. Third, in this study, no patient had more than 12 cores taken. Therefore, we do not know whether biopsy sampling of more than 12 cores accurately improves the cancer detection rate. However, previous reports showed that sampling of more than 12 cores did not improve the cancer detection rate, as described earlier in the Discussion section. Fourth, PV should be treated as a continuous variable with nonlinear dependencies, but our nomograms divide PV into three groups and thus we treated it as a categorical variable to make the text consistent and easy to understand. Finally, in the MRI era, conventional systemic biopsy using NURTG nomograms is limited. The number of patients worldwide with suspected prostate cancer is high and thus we imagine that conventional systemic biopsy using our nomogram could be a suitable method in some cases. Decreasing the number of cores may lead to decreases in the development of complications, pain experienced by the patient, and burden on the pathologist. Although the cancer detection rate in our study was acceptable and similar to that in other reports, careful interpretation of the results may be needed.
Conclusion
The NURTG nomogram was applied to obtain a number of 6–12 core prostate specimens according to age and PV, and provided a sufficiently good cancer detection rate, especially with the latter nomogram. Twelve cores as a maximum under TRUS-Bx may be sufficient as an initial biopsy for a prostate cancer diagnosis.
Acknowledgment
We kindly thank Miss Mariko Yoshimura (Department of Urology, Nara Medical University, Nara, Japan) for her contribution to the drafting of this manuscript.
Disclosure
The authors report no conflicts of interest in this work.
References
National Cancer Center, Japan. Database. Available from: http://ganjoho.jp/data/professional/statistics/odjrh3000000hwsa-att/cancer_incidence (1975-2006). Accessed February 25, 2019. Japanese. | ||
National Cancer Center, Japan. Database. Available from: http://ganjoho.jp/data/professional/statistics/odjrh3000000hwsa-att/cancer_mortality (1958-2009). Accessed February 25, 2019. Japanese. | ||
Hodge KK, Mcneal JE, Terris MK, Stamey TA. Random systematic versus directed ultrasound guided transrectal core biopsies of the prostate. J Urol. 1989;142(1):71–74. | ||
Remzi M, Fong YK, Dobrovits M, et al. The Vienna nomogram: validation of a novel biopsy strategy defining the optimal number of cores based on patient age and total prostate volume. J Urol. 2005;174(4 Pt 1):1256–1261. | ||
Tanaka N, Shimada K, Nakagawa Y, et al. The optimal number of initial prostate biopsy cores in daily practice: a prospective study using the Nara Urological Research and Treatment Group nomogram. BMC Res Notes. 2015;8:689–694. | ||
Oesterling JE, Kumamoto Y, Tsukamoto T, et al. Serum prostate-specific antigen in a community-based population of healthy Japanese men: lower values than for similarly aged white men. Br J Urol. 1995;75(3):347–353. | ||
Lilja H, Cronin AM, Dahlin A, et al. Prediction of significant prostate cancer diagnosed 20 to 30 years later with a single measure of prostate-specific antigen at or before age 50. Cancer. 2011;117(6):1210–1219. | ||
Jiang J, Colli J, El-Galley R. A simple method for estimating the optimum number of prostate biopsy cores needed to maintain high cancer detection rates while minimizing unnecessary biopsy sampling. J Endourol. 2010;24(1):143–147. | ||
van den Bergh RC, Roemeling S, Roobol MJ, Roobol W, Schröder FH, Bangma CH. Prospective validation of active surveillance in prostate cancer: the PRIAS study. Eur Urol. 2007;52(6):1560–1563. | ||
Soloway MS, Soloway CT, Eldefrawy A, et al. Careful selection and close monitoring of low-risk prostate cancer patients on active surveillance minimizes the need for treatment. Eur Urol. 2010;58(6):831–835. | ||
Tanaka N, Fujimoto K, Chihara Y, et al. Prostatic volume and volume-adjusted prostate-specific antigen as predictive parameters for prostate cancer patients with intermediate PSA levels. Prostate Cancer Prostatic Dis. 2007;10(3):274–278. | ||
Tanaka N, Fujimoto K, Yoshikawa M, et al. Prostatic volume and volume-adjusted prostate-specific antigen as predictive parameters for T1c prostate cancer. Hinyokika Kiyo. 2007;53(7):459–465. | ||
Eichler K, Hempel S, Wilby J, et al. Diagnostic value of systematic biopsy methods in the investigation of prostate cancer: a systematic review. J Urol. 2006;175(5):1605–1612. | ||
Kawakami S, Numao N, Okubo Y, et al. Development, validation, and head-to-head comparison of logistic regression-based nomograms and artificial neural network models predicting prostate cancer on initial extended biopsy. Eur Urol. 2008;54(3):601–611. | ||
Ung JO, San Francisco IF, Regan MM, Dewolf WC, Olumi AF. The relationship of prostate gland volume to extended needle biopsy on prostate cancer detection. J Urol. 2003;169(1):130–135. | ||
Takenaka A, Hara R, Hyodo Y, et al. Transperineal extended biopsy improves the clinically significant prostate cancer detection rate: a comparative study of 6 and 12 biopsy cores. Int J Urol. 2006;13(1):10–14. | ||
Nakai Y, Tanaka N, Miyake M, et al. Atypical small acinar proliferation and two or more cores of high-grade intraepithelial neoplasia on a previous prostate biopsy are significant predictors of cancer during a transperineal template-guided saturation biopsy aimed at sampling one core for each 1 mL of prostate volume. Res Rep Urol. 2017;9:187–193. | ||
Schoots IG, Roobol MJ, Nieboer D, Bangma CH, Steyerberg EW, Hunink MG. Magnetic resonance imaging-targeted biopsy may enhance the diagnostic accuracy of significant prostate cancer detection compared to standard transrectal ultrasound-guided biopsy: a systematic review and meta-analysis. Eur Urol. 2015;68(3):438–450. | ||
Okoro C, George AK, Siddiqui MM, et al. Magnetic resonance imaging/transrectal ultrasonography fusion prostate biopsy significantly outperforms systematic 12-core biopsy for prediction of total magnetic resonance imaging tumor volume in active surveillance patients. J Endourol. 2015;29(10):1115–1121. | ||
Baco E, Rud E, Eri LM, et al. A randomized controlled trial to assess and compare the outcomes of two-core prostate biopsy guided by fused magnetic resonance and transrectal ultrasound images and traditional 12-core systematic biopsy. Eur Urol. 2016;69(1):149–156. | ||
Vashi AR, Wojno KJ, Gillespie B, Oesterling JE. A model for the number of cores per prostate biopsy based on patient age and prostate gland volume. J Urol. 1998;159(3):920–924. |
 © 2019 The Author(s). This work is published and licensed by Dove Medical Press Limited. The
full terms of this license are available at https://www.dovepress.com/terms
and incorporate the Creative Commons Attribution
- Non Commercial (unported, 3.0) License.
By accessing the work you hereby accept the Terms. Non-commercial uses of the work are permitted
without any further permission from Dove Medical Press Limited, provided the work is properly
attributed. For permission for commercial use of this work, please see paragraphs 4.2 and 5 of our Terms.
© 2019 The Author(s). This work is published and licensed by Dove Medical Press Limited. The
full terms of this license are available at https://www.dovepress.com/terms
and incorporate the Creative Commons Attribution
- Non Commercial (unported, 3.0) License.
By accessing the work you hereby accept the Terms. Non-commercial uses of the work are permitted
without any further permission from Dove Medical Press Limited, provided the work is properly
attributed. For permission for commercial use of this work, please see paragraphs 4.2 and 5 of our Terms.