Back to Journals » Clinical Ophthalmology » Volume 15
Comparing Healthcare Resource Utilization and Costs for Patients with Normal Tension Glaucoma Across Levels of Severity: A Retrospective Cohort Study
Authors Beal B ![]() , Shih V, Campbell J, Veenstra D, Devine B
, Shih V, Campbell J, Veenstra D, Devine B ![]()
Received 20 November 2020
Accepted for publication 26 January 2021
Published 9 February 2021 Volume 2021:15 Pages 453—460
DOI https://doi.org/10.2147/OPTH.S284474
Checked for plagiarism Yes
Review by Single anonymous peer review
Peer reviewer comments 2
Editor who approved publication: Dr Scott Fraser
Brennan Beal,1 Vanessa Shih,2 Joanna Campbell,2 David Veenstra,1 Beth Devine1
1The Comparative Health Outcomes, Policy and Economics (CHOICE) Institute, University of Washington, Seattle, WA, USA; 2Healthcare Economics and Outcomes Research, AbbVie, Chicago, IL, USA
Correspondence: Brennan Beal
The Comparative Health Outcomes, Policy and Economics (CHOICE) Institute, University of Washington, Suite H-375, Box 35760, 1959 NE Pacific Street, Seattle, WA, 98195-7630, USA
Tel +1 704 742 0288
Fax +1 206-543-3835
Email [email protected]
Purpose: To estimate the healthcare resource utilization (HCRU) and costs for patients with normal tension glaucoma (NTG) as well as their payers across various levels of disease severity.
Patients and Methods: Our study was a retrospective cohort study of 6330 US NTG patients. Patients were enrolled if they were 40 years or older and had two or more qualifying NTG diagnoses within the enrollment period, October 1st, 2015 to December 31st, 2017. Our analysis was carried out for two cohorts – those with unilateral disease and those with bilateral disease. Baseline demographic and clinical characteristics were assessed for a 12-month pre-index period. The follow up period was 12-months post-index. We employed generalized linear models to model HCRU and costs.
Results: Patients with severe, bilateral disease, filled more than two additional prescriptions annually (2.5, p< 0.001, 95% CI [2.0, 3.1]) when compared to their mild counterparts and accounted for 111 (p< 0.001, 95% CI [83.5, 139.1]) extra days of supply of glaucoma medications. These patients face an adjusted $187 (p< 0.001, 95% CI [145, 229]) more out-of-pocket (OOP), and payers an additional $598 (p< 0.001, 95% CI [$370, $826]), than their counterparts with a mild diagnosis on an annual basis. Total annual payer costs, on average (SD) for those with severe bilateral NTG were $1175 ($2222).
Conclusion: Our results suggest that patient and payer burden is significantly greater for those with severe disease compared to those with mild NTG. The excess burden is attributed to additional HCRU and the associated financial burden. Payers experienced a much larger financial burden from patients with severe disease compared to those with mild NTG. Approximately half of the cost differences can be attributed to additional prescription use.
Keywords: healthcare resource utilization, normal tension glaucoma, low tension glaucoma, healthcare costs
Introduction
Normal tension glaucoma (NTG), sometimes referred to as low tension glaucoma, is an optic neuropathy characterized by structural damage to the optic nerve associated with visual field dysfunction.1 NTG often presents with glaucomatous optic nerve head damage, progressive retinal nerve fiber layer thinning, characteristic visual field defects, open anterior chamber angles, and a maximum intra-ocular pressure (IOP) below 21 mmHg.2 NTG is a type of open angle glaucoma (OAG). Despite having “normal” ranges of IOP (<21 mmHg), the Collaborative Normal Tension Glaucoma Study Group demonstrated that a 30% reduction in IOP slowed disease progression for patients with NTG. Therefore, the treatment regimens are generally the same for NTG as OAG and are targeted toward reducing IOP, regardless of the patient’s baseline.3
In 2013, the global prevalence of glaucoma was estimated to be 64.3 million, with projections into 2040 expecting a 74% increase to 111.8 million people affected worldwide.4 Less is understood about the prevalence of NTG, though the Beaver Dam Eye study estimated that approximately one-third of OAG diagnoses could be classified as NTG while a Japanese study estimated that NTG accounts for 92% of that country’s glaucoma cases.5,6
Annual costs of glaucoma reported in one 2006 European study ranged from €455 to €969 from the early to late-stage glaucoma, respectively.7 The total attributable economic burden in the US has been estimated at $7.6 billion, which was estimated to be $2841 per-patient in 2013 dollars.8 Though much is known about the general costs of glaucoma, less has been done to characterize healthcare resource use (HCRU) and the associated costs for patients with NTG. This study will be the first to address this gap by characterizing HCRU and costs of patients with NTG by severity and laterality.
Patients and Methods
We used administrative claims data from the IBM® MarketScan® Commercial and Medicare Supplemental databases which, in 2018 contained healthcare data for more than 41.2 million covered individuals. From this database, we examined a retrospective cohort of 6330 US prevalent patients, 40 years or older on the index date with a diagnosis of NTG (low-tension glaucoma, International Classification of Diseases, Version 10, [ICD-10] H40.1211–4). A patient’s index date was the first of their two outpatient diagnoses in any position, with the second being within 365 days after the first, or one inpatient diagnosis, each for NTG. Included patients were required to be at least 40 years of age at the end of their index year and have at least 12 months of continuous enrollment pre- and post-index date. Excluded patients were those who had a glaucoma diagnosis other than OAG (ICD H40.0, H40.2, H40.3–6, or H40.8–9) within 12 months prior to the patient’s index date or those not meeting the inclusion criteria.
The cohort was stratified into eight subgroups by laterality of (unilateral versus bilateral) disease, and within those categories, stratified by levels of severity – mild, moderate, severe, or indeterminate based on their diagnosis. Levels of severity were established using the 7-digit ICD-10 codes. Patients with unspecified NTG (ICD H40.1210) were excluded from the analysis. The time period for possible index dates spanned from October 1st, 2015, to December 31st, 2017, with the full data set containing dates from October 2014 to December 2018. HCRU and costs were estimated for a 12-month period following the index date.
Definition of Outcomes
Outcomes were classified as either an office visit or prescription metric. Utilization and costs were assessed for each. Office visits were further stratified into three categories: eye-related, NTG-related, or procedure-related office visits. Eye-related visits were intended to be the broadest category our data could represent. Resources defined as eye-related were any visit associated with an eye-care provider (ie, ophthalmologist or optometrist), associated with an NTG diagnosis code, or associated with an OAG surgical/laser procedure or complication (Supplementary Table S1). NTG-related outcomes were defined as a subset of eye-related outcomes and represented only visits with an NTG diagnosis or procedures, rather than the larger set, which included any visit associated with an eye-care provider, as well. Procedure-related office visits were also a subset of eye-related visits, which were at least associated with a glaucoma procedure and represented the narrowest category of our data. Prescription metrics were days’ supply and unique prescription fills, which indicated glaucoma-related prescription counts within the 12-month follow-up.
Healthcare Resource Utilization
HCRU was defined as counts for all office visits and as days’ supply and number of fills for glaucoma-related prescriptions.
Costs
Costs were assessed for all our outcomes as well as total costs, which were defined as the sum of NTG-related office visits and glaucoma-related prescriptions. Costs were further categorized as being patient or payer-related. Patient-related costs were those incurred by the patient and were defined as the sum of the patient’s co-pay, co-insurance, and deductible costs. Payer-related costs were total payments made by the health plan to healthcare providers.
Finally, payer and patient costs are reported “per user”, indicating that only patients with non-zero costs for a given cost component were included in the denominator (ie, those that did not fill a prescription were not included in prescription costs). Costs were estimated as 2019 US dollars using the Bureau of Labor Statistics’ Consumer Price Index for medical care commodities to inflate costs accordingly.9
Statistical Analysis
Descriptive statistics were calculated to assess differences in baseline characteristics among all study cohorts. Categorical variables were summarized using frequencies and percentages, continuous variables were summarized using means and standard deviations.
Office visits were analyzed using generalized linear models with a Poisson distribution. To address the overdispersion found in prescription counts, we relaxed the Poisson assumption and modeled those counts with negative binomial models. For cost outcomes, we fit generalized linear models using a gamma distribution for each. To describe incremental office visits by severity, we extracted predicted probabilities while holding all other variables at their mean using the margins command with all models using mild severity as the referent category.
All outcomes were evaluated using unadjusted and adjusted models with the adjustment variables being age, sex, insurance type, region, and CCI, as defined by Quan et al (Supplementary Tables S2 and S3).10 The outcomes reported are adjusted outcomes. To assess whether laterality modified the association between severity and costs, we included an interaction term between the two variables as a final and separate analysis.
For all statistical comparisons, we used a two-sided alpha at a 5% significance level. SAS version 9.4 (SAS Institute Inc., Cary, NC) was used for constructing the analytic dataset and R version 3.5.2 (R Foundation for Statistical Computing, Vienna, Austria) was used to conduct the statistical analyses.
The Truven MarketScan database is Health Insurance Portability and Accountability Act of 1966 (HIPAA) compliant and all data are de-identified. The study did not require Institutional Review Board (IRB) review and approval, as the study protocol did not meet the federal definition of “human subjects research,” as determined by the University of Washington Human Subjects Division IRB.
Results
Patient Characteristics
Our cohort included 1707 patients and 4623 patients with unilateral and bilateral disease, respectively. Most patients were >60 years of age (71%) with a plurality of them in Preferred Provider Organizations (PPO) (49%) and living in the North Central or Southern Regions of the US (61%). Approximately 60% were female and the average (SD) CCI score ranged from 0.82 (1.4) to 0.94 (1.6) across cohorts (Table 1) (Supplementary Table S4).
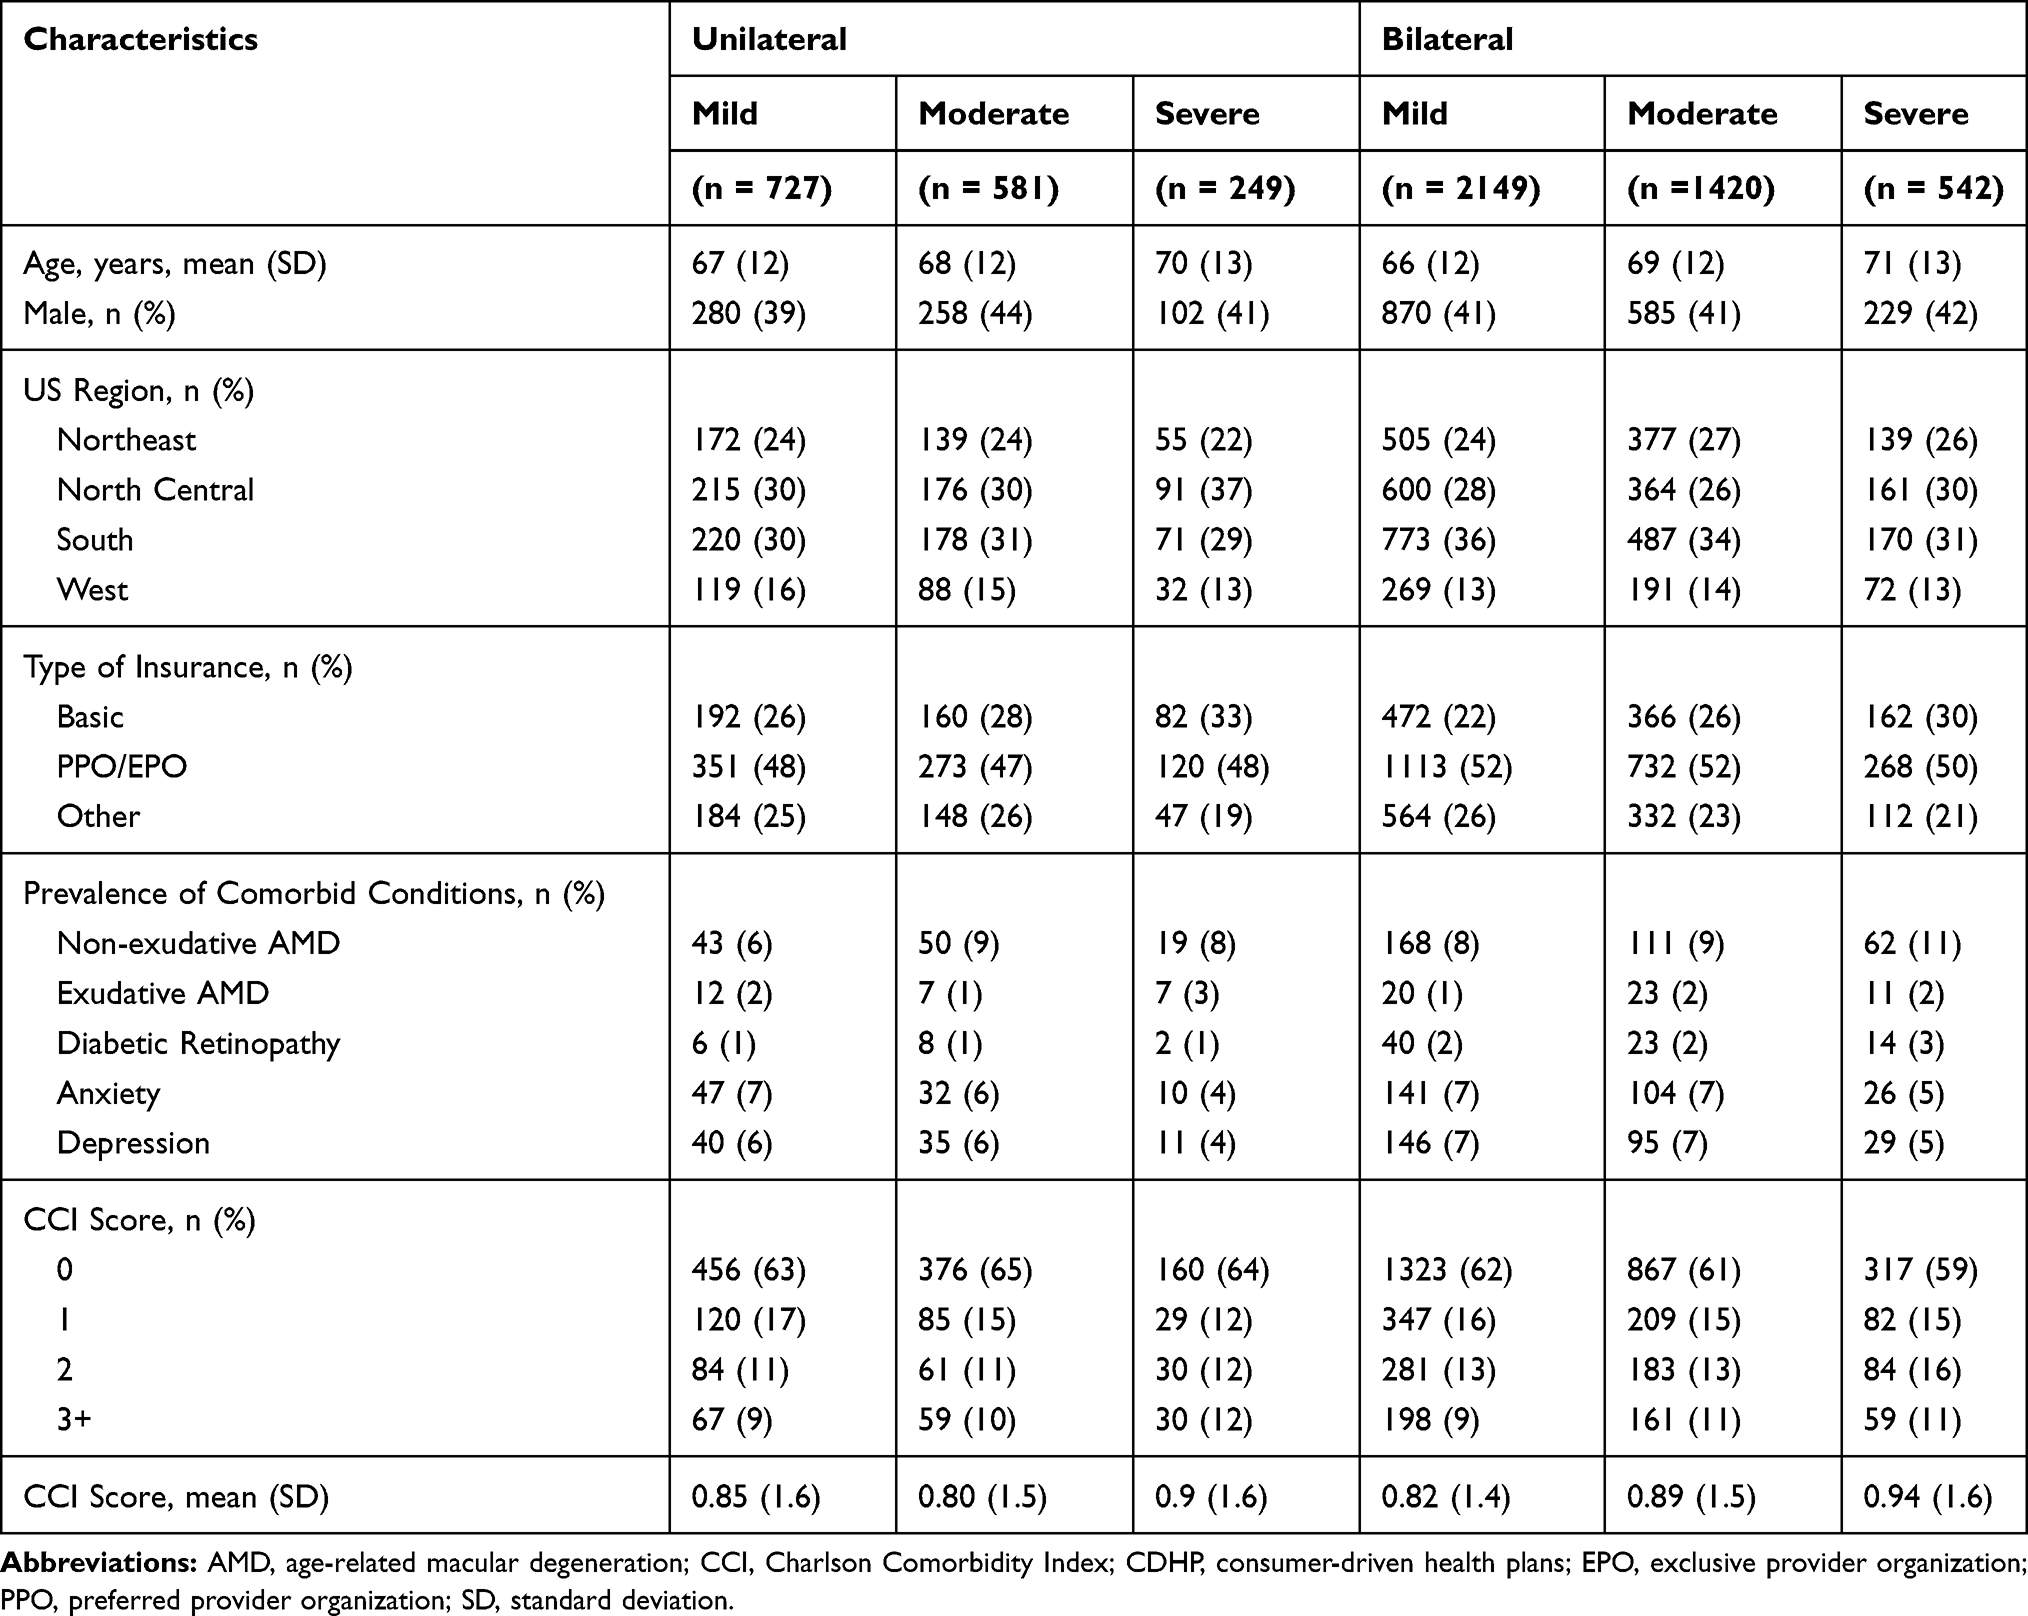 |
Table 1 Sociodemographic and Clinical Characteristics of Patients with Normal Tension Glaucoma by Laterality and Severity |
Healthcare Resource Utilization
Patients with mild disease generally had fewer office visits than their moderate or severe counterparts across all categories within laterality cohorts (Figure 1) (Supplementary Table S5), although, the effect size tended to be greater for bilateral patients than their unilateral counterparts. On average (SD), patients with mild disease in the bilateral cohort experienced 4.1 (2.1) eye-related office visits and 5.9 (4.0) unique prescription fills in their year of follow-up. Those with severe bilateral disease experienced 0.9 (p < 0.001, 95% CI [0.7, 1.1]) more office visits annually and an additional 2.5 (p<0.001, 95% CI [2.0, 3.0]) unique prescription fills. Patients in the unilateral cohort experienced similar trends.
 |
Figure 1 Estimating annual healthcare resource utilization by disease severity and laterality. Abbreviations: NTG, normal-tension glaucoma; Rx, prescription. Notes: “Mild” severity represents our referent category, “moderate” and “severe” severity grades are adjusted estimates, “Unique Rx Fills” represent fills for those with at least 1 prescription. |
The relationship between severity and prescription fills was modified by laterality. For patients with unilateral disease, the effect of severity of disease on prescription fills was approximately 82% (95% CI [73, 93]) compared to those with bilateral disease. The same was true for days of prescription supply.
Direct Healthcare Costs
Patient-related and payer-related costs were significantly greater for patients with severe disease compared to those with a mild form of NTG for most cost components (Figure 2) (Supplementary Table S6). Similar to resource utilization, the trends were generally the same between both the unilateral and bilateral cohort, with the unilateral cohort having a lesser effect size.
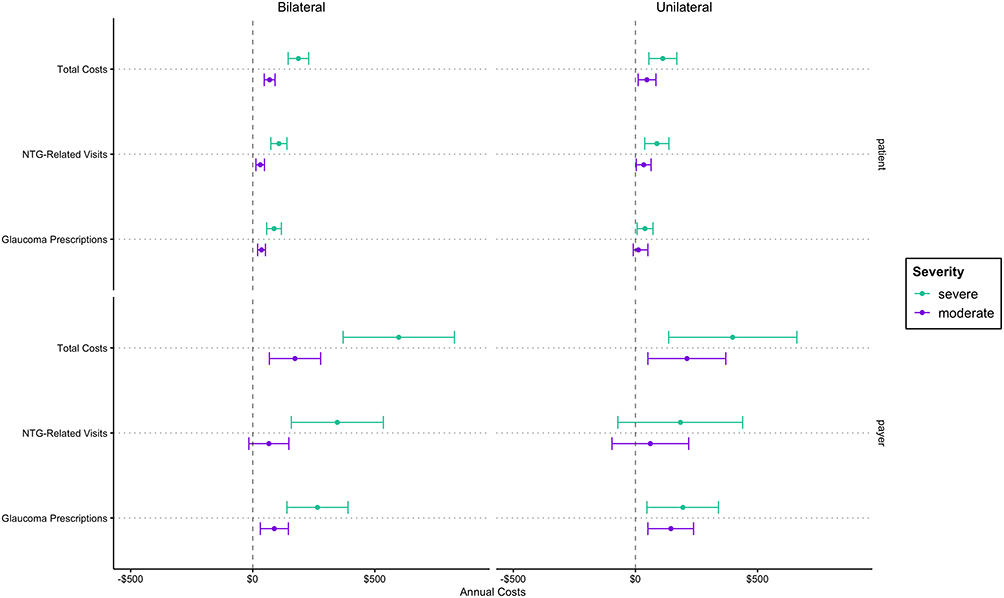 |
Figure 2 Estimating annual payer and patient costs by disease severity and laterality. Abbreviation: NTG, normal-tension glaucoma. Notes: “Mild” severity represents our referent category, “moderate” and “severe” severity grades are adjusted estimates, “Total Costs” represents the combination of NTG-Related Office Visits and Glaucoma Prescriptions, “Glaucoma Prescriptions” represent fills for those with at least 1 prescription. |
Office Visits
Both payers and patients in the severe, bilateral, cohort had significantly higher annual costs for visits compared to the mild referent. Patients with mild disease in the bilateral cohort accounted for an average (SD) of $514 ($1941) in payer costs for eye-related visits in the year of follow-up. For severe patients, payers harbored an additional $313 (p<0.01, 95% CI [80, 546]) in costs for eye-related visits annually.
Likewise, patients with severe disease experienced additional out-of-pocket (OOP) expenses compared to those with mild disease. Patients with bilateral mild disease on average incurred $235 ($319) associated with eye-related office visits annually. Those with severe disease incurred $125 (p<0.001, 95% CI [78, 172]) in additional adjusted costs when compared to those classified as having a mild form of NTG.
Glaucoma Prescriptions
Payers of patients associated with both laterality cohorts had significantly higher annual costs for prescriptions. Approximately 98% of patients in the unilateral and 97% in the bilateral cohort had at least one prescription filled. In the bilateral category, for those that had at least one prescription, payers incurred an additional $265 (p<0.001, 95% CI [140, 390]) in prescription costs for severe patients above their mild patients’ average (SD) of $349 (606). Similarly, patient OOP costs were greater for patients with severe disease compared to those with mild NTG across both laterality groups. In the bilateral group, patient OOP costs were $87 (p<001, 95% CI [57, 117]) greater than their mild referent group, who spent $131 ($185) on average (SD) per year.
Total Costs
Total costs reflected results found in other cost components. Payers and patients both experienced greater costs for those with severe NTG compared to their referent, in both laterality cohorts. Payers in the bilateral cohort spent an average (SD) of $659 ($1745) per patient on total direct costs incurred by mild patients. Costs were $598 (p<0.001, 95% CI [370, 826]) greater for severe NTG patients in the same cohort. Patient OOP costs were $304 ($319) on average for those with mild NTG in the bilateral group. These costs were $187 (p<0.001, 95% CI [145, 229]) greater for the severe counterpart.
We did not find laterality to have a relevant, or statistically significant, impact on any cost component as it relates to the effect of disease severity on payer-related costs (Supplementary Table S7).
Discussion
We evaluated the HCRU and costs of patients with NTG over levels of disease severity, stratified into two cohorts, bilateral and unilateral disease. Patients with more severe diagnoses in both cohorts consistently experienced a greater burden of HCRU and costs. Payer costs followed a similar trend with a greater effect size in most cases.
Patients with severe disease were only estimated to experience an increase in any office visit by approximately 0.9 visits annually, at most. This may not be considered clinically significant; however, for patients with visual impairments, any increase in office visits could create an additional burden, both economically and psychologically, for both patients and their caregivers - a cost that was not captured in our analysis. The most notable increases in HCRU were tied to glaucoma-related prescription use. This burden is exacerbated by the fact that those with glaucoma often have other comorbidities, potentially making eye-drop use challenging.
Patient-related healthcare costs were significantly higher for all components when comparing those with severe disease to patients with mild NTG. The largest estimate demonstrated that total OOP costs were $187 greater annually for patients with severe, bilateral disease, compared to those with mild disease in the same cohort. Payers of these patients face an additional $598 annually. Alone, annual additional costs of $187 for patients and $598 for payers are meaningful. These costs are magnified by the fact that the US is expected to have 3 million people with OAG by 2020.12
Though no cost or utilization studies have been published for patients with NTG, results from other studies examining broader classifications of glaucoma, including glaucoma suspect, ocular hypertension, and all open angle glaucoma, largely coincide with our findings. One such study by Traverso et al agreed with our findings – describing patients with more severe disease as having greater total costs, with medication expenditure accounting for approximately half of that cost.7 Another study by Lee et al described a similar trend in resource utilization for patients with glaucoma.11 Patients in this study with more severe glaucoma had higher counts for office visits and medication use compared to patients with a less severe diagnosis. Both studies mentioned use of chart reviews to acquire their data as well as broad classifications of glaucoma.
Much work has been done to understand the HCRU and costs attributed to patients with glaucoma; however, less is known about patients with NTG, specifically. Our research is the first to estimate annual HCRU and costs for those patients.
Strengths and Limitations
The primary limitation of our claims analysis was the lack of supporting clinical information regarding treatment patterns beyond laterality and severity – items such as IOP measurements or visual field data. Additionally, for those over 65 years, our data represents those with Medicare supplemental insurance and those otherwise commercially insured. Thus, the included population is not representative of a true Medicare population nor does it reflect patients enrolled in Medicaid. We anticipate this to bias our estimates to the null given that we are likely selecting a healthier population at baseline. Further, the estimates within our paper are likely understating the true burden of disease, and do not account for indirect costs incurred by patients, or direct and indirect costs realized by caregivers. The total costs reflect NTG-related costs and glaucoma-related prescription costs; however, eye-related costs, the broader category of eye-care costs, were approximately $200 greater on average for payers across all severity levels and thus our calculation of total costs is conservative. Another limitation may be the miscoding of ophthalmic prescription medications. Glaucoma medications are frequently packaged within bottles or droppers. Often our data represented a fill of a particular drop as a one-day supply. Therefore, reporting the days’ supply for glaucoma medications potentially biases our estimate towards the null as well. For this reason, we reported both days’ supply and drug fills in our resource utilization estimates.
A final strength, and limitation, of this study relies on a more exacting 7-digit medical code introduced in the ICD-10 updates, which allowed us to stratify our patients not only by severity but also by disease laterality. Disease laterality became an important factor in understanding potential interactions in our data and provide a more comprehensive characterization and comparison of our patient population; however, more specific medical coding introduces more opportunity for input error.
Conclusion
Our results suggest that patient burden is higher for those with severe and moderate disease compared to those with mild NTG. The excess burden is not only attributed to additional HCRU, but also by a higher financial burden, which accompanies the higher resource use. Patients were not alone as payers experienced a much larger financial burden from patients with severe and moderate disease compared to those with mild NTG. Approximately half of the cost differences can be attributed to additional prescription burden.
As noted above, these estimates are likely understating the true burden of disease, and do not account for indirect costs incurred by patients, or direct and indirect costs realized by caregivers. As such, our estimates should serve as a minimum estimate for HCRU and costs of US patients 40 years and older diagnosed with normal tension glaucoma.
Abbreviations
CPI, consumer price index; HCRU, healthcare resource utilization; HIPAA, Health Insurance Portability and Accountability Act; ICD-10, international classification of diseases, tenth revision; IRB, institutional review board; NTG, normal-tension glaucoma; OAG, open-angle glaucoma; OOP, out-of-pocket; PPO, preferred provider organization; SD, standard deviation.
Acknowledgments
All authors made a significant contribution to the work reported, whether that is in the conception, study design, execution, acquisition of data, analysis and interpretation, or in all these areas; took part in drafting, revising or critically reviewing the article; gave final approval of the version to be published; have agreed on the journal to which the article has been submitted; and agree to be accountable for all aspects of the work.
Disclosure
Beal was supported by a training grant from Legacy Allergan (AbbVie) at the time of this study and this work draws on work completed for his thesis project.13 Shih and Campbell were Legacy Allergan (AbbVie) employees at the time this study was conducted. The other authors have no conflicts of interest to disclose.
References
1. Foster PJ, Buhrmann R, Quigley HA, Johnson GJ. The definition and classification of glaucoma in prevalence surveys. Br J Ophthalmol. 2002;86(2):238–242. doi:10.1136/bjo.86.2.238
2. Mallick J, Devi L, Malik PK, Malik J. Update on normal tension glaucoma. J Ophthalmic Vis Res. 2016;11(2):204–208. doi:10.4103/2008-322X.183914
3. [No authors listed]. Comparison of glaucomatous progression between untreated patients with normal-tension glaucoma and patients with therapeutically reduced intraocular pressures. Collaborative Normal-Tension Glaucoma Study Group. Am J Ophthalmol. 1998;126:487–497.
4. Tham YC, Li X, Wong TY, Quigley HA, Aung T, Cheng CY. Global prevalence of glaucoma and projections of glaucoma burden through 2040: a systematic review and meta-analysis. Ophthalmology. 2014;121(11):2081–2090. doi:10.1016/j.ophtha.2014.05.013
5. Klein BE, Klein R, Sponsel WE, et al. Prevalence of glaucoma. The Beaver Dam Eye Study. Ophthalmology. 1992;99(10):1499–1504. doi:10.1016/S0161-6420(92)31774-9
6. Iwase A, Suzuki Y, Araie M, et al. The prevalence of primary open-angle glaucoma in Japanese: the Tajimi study. Ophthalmology. 2004;111:1641–1648. doi:10.1016/j.ophtha.2004.03.029
7. Traverso CE, Walt JG, Kelly SP, et al. Direct costs of glaucoma and severity of the disease: a multinational long term study of resource utilisation in Europe. Br J Ophthalmol. 2005;89(10):1245–1249. doi:10.1136/bjo.2005.067355
8. Wittenborn J, Rein D Cost of vision problems: the economic burden of vision loss and eye disorders in the United States.
9. United States Bureau of Labor Statistics. Consumer price index - all urban consumers medical care in U.S. city average, all urban consumers, not seasonally adjusted. Available from: https://data.bls.gov/timeseries/CUUR0000SAM.
10. Quan H, Sundararajan V, Halfon P, et al. Coding algorithms for defining comorbidities in ICD-9-CM and ICD-10 administrative data. Med Care. 2005;43(11):1130–1139. doi:10.1097/01.mlr.0000182534.19832.83
11. Lee PP, Walt JG, Doyle JJ, et al. A multicenter, retrospective pilot study of resource use and costs associated with severity of disease in glaucoma. Arch Ophthalmol. 2006;124(1):12–19. doi:10.1001/archopht.124.1.12
12. The Eye Diseases Prevalence Research Group*. Prevalence of open-angle glaucoma among adults in the United States. Arch Ophthalmol. 2004;122(4):532–538. doi:10.1001/archopht.122.4.532
13. Beal B Comparing healthcare resource use and costs for patients with normal tension glaucoma across levels of severity: a nationally representative sample of commercially insured US adults age 40 and older. Master of Science Thesis. University of Washington; 2020. Available from: http://hdl.handle.net/1773/45756.
 © 2021 The Author(s). This work is published and licensed by Dove Medical Press Limited. The
full terms of this license are available at https://www.dovepress.com/terms
and incorporate the Creative Commons Attribution
- Non Commercial (unported, 3.0) License.
By accessing the work you hereby accept the Terms. Non-commercial uses of the work are permitted
without any further permission from Dove Medical Press Limited, provided the work is properly
attributed. For permission for commercial use of this work, please see paragraphs 4.2 and 5 of our Terms.
© 2021 The Author(s). This work is published and licensed by Dove Medical Press Limited. The
full terms of this license are available at https://www.dovepress.com/terms
and incorporate the Creative Commons Attribution
- Non Commercial (unported, 3.0) License.
By accessing the work you hereby accept the Terms. Non-commercial uses of the work are permitted
without any further permission from Dove Medical Press Limited, provided the work is properly
attributed. For permission for commercial use of this work, please see paragraphs 4.2 and 5 of our Terms.