Back to Journals » Clinical Ophthalmology » Volume 15
Comparing a Home Vision Self-Assessment Test to Office-Based Snellen Visual Acuity
Authors Chen TA, Li J, Schallhorn JM, Sun CQ
Received 5 March 2021
Accepted for publication 18 May 2021
Published 28 July 2021 Volume 2021:15 Pages 3205—3211
DOI https://doi.org/10.2147/OPTH.S309727
Checked for plagiarism Yes
Review by Single anonymous peer review
Peer reviewer comments 6
Editor who approved publication: Dr Scott Fraser
Tiffany A Chen,1 Jonathan Li,1 Julie M Schallhorn,1,2 Catherine Q Sun1,2
1Department of Ophthalmology, University of California San Francisco, San Francisco, CA, USA; 2F.I Proctor Foundation, University of California San Francisco, San Francisco, CA, USA
Correspondence: Catherine Q Sun
F.I. Proctor Foundation, University of California San Francisco, Box 0944, 490 Illinois Street, San Francisco, CA, 94143, USA
Email [email protected]
Purpose: To evaluate the agreement of a home vision screening test compared to standard in-office technician-measured Snellen visual acuity to allow for remote screening and triaging of patients.
Patients and Methods: In this prospective study, English-speaking patients with in-office ophthalmology appointments from May to August 2020 and visual acuity better than 20/125 were asked to complete a home vision test one week before their scheduled in-office appointment. The home vision test was a modified ETDRS chart displayed in a PDF document that could be printed or viewed on a monitor. The primary outcome was the mean difference between office-based and home visual acuity.
Results: Eighty-two eyes of 45 patients were included in the study with 45 study eyes analyzed. The mean difference between office-based and home visual acuity was − 0.02 logMAR (SD 0.15, P=0.28) among study eyes. Of these eyes, 91% demonstrated agreement between the two methods within 0.2 logMAR of the mean difference, and 60% had agreement within 0.1 logMAR of the mean difference. There were no significant demographic or ocular risk factors leading to a greater difference between the tests.
Conclusion: There was good agreement between the home and in-office Snellen tests for patients with vision better than 20/125. The home vision test can be used to remotely determine if there is a significant vision change of > 0.2 logMAR or approximately 2 lines of visual acuity.
Keywords: telemedicine, tele-ophthalmology, home vision test, vision screening
Introduction
Home vision screening tests have become an important way to obtain a measure of an individual’s visual acuity (VA) without an office-based clinic visit, especially in light of the SARS-CoV-2 pandemic.1 Knowing a patient’s VA can help ophthalmologists remotely triage acute calls, monitor visual recovery after medical or surgical interventions, and ensure visual stability in follow-up telemedicine visits.
Numerous electronic home vision assessment tools exist, but many of these are used through applications on mobile or tablet devices.2 As such, they may require access to a specific type of mobile or tablet device, and may be challenging to navigate for all patients.3,4 Furthermore, validation of these self-assessment tools is often lacking, and agreement between the self-assessment tools and office-based VA is variable, reducing their clinical utility as a screening or triaging method.2,5,6
Recently, Crossland et al demonstrated that a home-printable vision screening test, the Home Acuity Test, could be used to measure vision remotely in ophthalmology outpatients with a diverse range of eye conditions in the United Kingdom.7 They demonstrated a mean difference in vision of 1 line on a vision chart (0.1 logarithm of the Minimal Angle of Resolution [logMAR], SD 0.17) between the Home Acuity Test and the last in-office vision assessment (mean of 1 year) for ophthalmology outpatients in their strabismus and low vision clinics.7 One of the limitations was a long lag time between the last in-office visit and home VA assessment of 12 months (range 1–69 months).7
In this study, we assessed a similar home VA assessment that could be self-administered by almost all patients seen in our ophthalmology department, many of whom are elderly and may not be as familiar with mobile or tablet applications, and compared these results to an in-office VA measured within one week of using the home test. The home vision assessment test was displayed in a Portable Document File (PDF), which could be printed or viewed on a home computer, tablet or mobile device.8 The test is a modified Early Treatment Diabetic Retinopathy Study (ETDRS) chart developed for use at 5 or 10 feet. Using this test, we determined how self-measured home vision testing compared to office-based Snellen VA testing by a trained technician, the standard method in clinical practice in the United States (US).9 While there are limitations to the Snellen chart, it still remains the most common method for VA testing in clinical practice since it is quick and easy to perform.9
In this study, patients performed the home vision test one week prior to their in-office visit to reduce the potential bias of vision change between home and in-office testing. We hypothesized that the home vision test performed in a real-world setting is comparable to office-based testing. We determine a priori that clinically significant agreement was ≤0.2 logMAR lines of difference between the two methods based on prior studies.11,12
Materials and Methods
This study was a prospective, cross-sectional study. Patients with scheduled in-office appointments with any glaucoma provider at the University of California San Francisco (UCSF) Department of Ophthalmology were screened for inclusion in the study from May to August 2020. Exclusion criteria were last in-office VA of 20/125 or worse in both eyes (to allow for a buffer of at least 2 lines of vision from the upper limit of 20/200 on the home vision assessment), inability to speak English, or lack of access to MyChart, the secure patient messaging portal embedded into the electronic medical record system at UCSF. All other patients were included and sent a MyChart message one week prior to their scheduled clinic appointment with information about the research study and instructions for completing the home vision assessment. Patients were asked to respond to the message with their home VA if they decided to participate, or to bring their results on the day of their scheduled office visit. Patients who completed the home visual acuity test and had a subsequent office-based VA test were then included in the study. Patients were excluded if they reported acute deterioration of their vision at their office appointment.
Visual Acuity Testing
Home vision assessment was conducted using the “Letter Distance Chart” PDF document, a modified ETDRS chart designed by the University of Arizona for testing at 5 or 10 feet and released for public use in a previous manuscript.8 The charts have a calibration circle the size of a United States quarter to ensure the test is viewed with correct scaling.8 Patients were asked to use the 5 feet distance for standardization, which allows for visual acuity assessment from 20/16 to 20/200. Patients were asked to wear their current corrective lens for distance, to take the test at home in a place with good lighting and to test each eye separately (Supplemental File).
Office-based vision testing was performed by a trained ophthalmic technician in a dimmed room with the Snellen chart illuminated on a screen. Patients were asked to wear their current corrective lens for distance and an eye occluder was used to test each eye separately.
Data Collection
Chart review of all patients who completed the home vision assessment was conducted through the electronic medical record after their clinic visit. Demographics, major ocular conditions, office-based Snellen VA, and home VA were collected and recorded using REDCap electronic data capture tools hosted at UCSF. The Institutional Review Board at UCSF approved this study (IRB 20–32449). A waiver of consent for chart review was approved since the study presented no more than minimal risk of harm to subjects and involved no procedures for which written consent is normally required outside of the research context. This study followed the tenets of the Declaration of Helsinki.
Statistical Analysis
A sample size calculation indicated that 33 patients were needed to detect a logMAR difference of 0.1 between the office and home vision tests, assuming a paired t-test, standard deviation of 0.2, 2-sided alpha of 0.05 and 80% power. All home and office VA were converted to logMAR for statistical analysis. Patients only reported their best line of vision using the home vision test and not the number of letters per line, so we did not score by letter as is typical for ETDRS. Given correlation between eyes, data was analyzed from the right eye unless the right eye VA was not recorded (ie, in-office VA 20/125 or worse), in which case the left eye was used; this was referred to as the “study eye.” If the patient’s fellow eye was included in the study, it was referred to as the “fellow eye.”
The primary outcome was best-corrected VA in the study eye using the home vision test compared to office-based Snellen visual acuity using paired t-test. Bland-Altman plots were used to compare the agreement between home and office VA.10 In Bland-Altman plots, the Y axis shows the difference between 2 paired measurements and the X axis shows the mean of these measurements. The limits of agreement are reported for the 95% confidence interval, computed as ± 1.96 standard deviations (SD) of the mean, and for ± 0.2 logMAR from the mean, which we determined a priori as the clinically significant definition for agreement based on the literature.11,12 Paired t-test and univariable regression analysis were performed to determine if there were predictors for the difference between home and office VA. Values of P <0.05 were considered statistically significant. Data cleaning and statistical analyses were performed using R version 4.0.2 (R Foundation for Statistical Computing).
Results
From May to August 2020, 45 patients completed the home vision assessment and were included in the study. Of these 45 patients, 37 patients had both eyes included and 8 patients had only one eye included due to VA of 20/125 or worse in the other eye. In total, there were 45 study eyes and 42 fellow eyes included. Patient and eye characteristics are listed in Table 1. Patients were on average 66 years old (SD 16 years) and 19 were female (42%). The most common ocular condition was glaucoma (79%), since patients were recruited from glaucoma clinics. The majority of the patients were phakic (67%). Other common ocular conditions present are listed in Table 1.
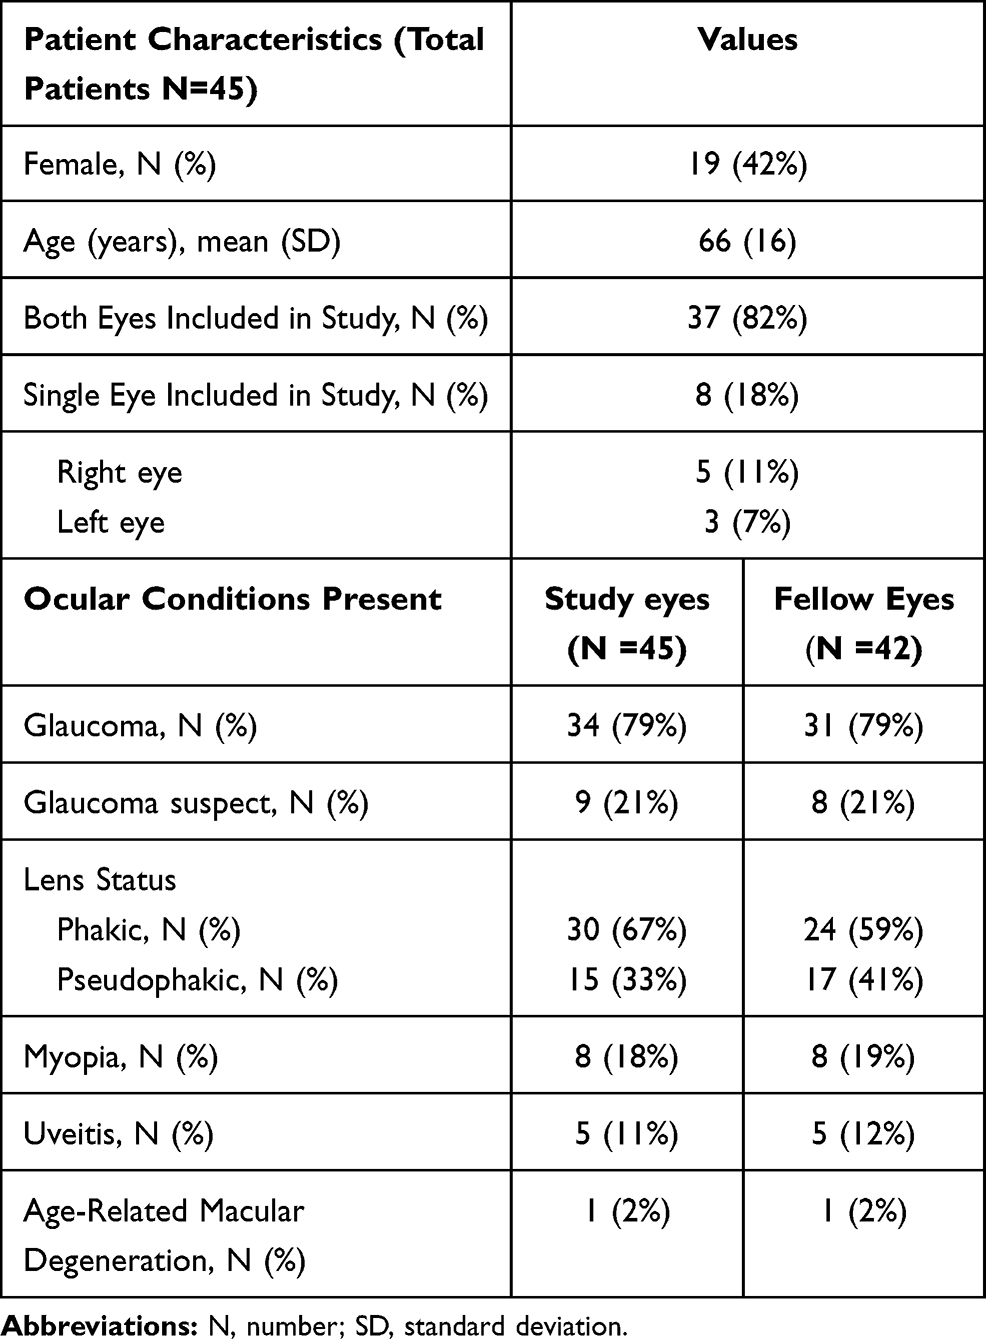 |
Table 1 Patient and Ocular Characteristics |
The majority of patients had vision 20/40 (0.3 logMAR) or better with both vision assessments (Figure 1). The distributions of study and fellow eyes appeared similar with both vision assessments. The mean office-based VA was 0.15 logMAR (SD 0.16, range 0 to 0.6, mean 20/28 Snellen equivalent) and the mean home VA was 0.17 logMAR (SD 0.15, range 0 to 0.5, mean 20/30 Snellen equivalent) (Table 2). The office-based VA was slightly better than the home vision though this was not statistically significant (mean difference −0.02 logMAR, SD 0.15, P=0.28). The fellow eyes performed similarly (Table 2).
 |
Table 2 Comparison of logMAR Visual Acuity Scores |
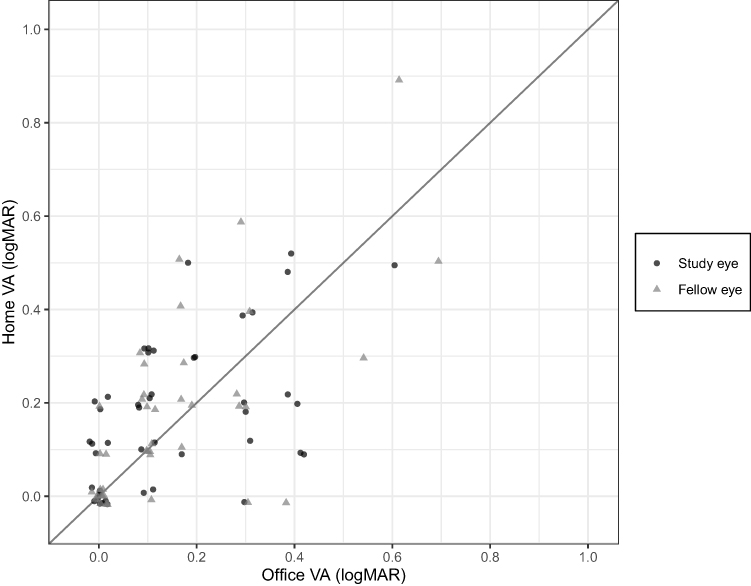 |
Figure 1 Scatterplot of Office versus Home Visual Acuity. Abbreviations: VA, visual acuity; logMAR, logarithm of the Minimal Angle of Resolution. Notes: Visual acuity measured in the office and at home, with the line of equality; Points have been jittered to help with visualization. |
The Bland-Altman plot of study eyes (Figure 2A) showed that 91% of eyes had clinically significant agreement defined as ≤0.2 logMAR of difference from the mean difference. 91% of eyes also demonstrated agreement within the 95% limits of agreement (−0.31 to 0.26 logMAR). 60% of eyes had ≤0.1 logMAR of difference between the two methods. Examination of the Bland-Altman plots showed likely increasing variability of differences with worse vision, though there were few patients with VA worse than 20/40. The Bland-Altman plot of the fellow eyes showed similar findings (Figure 2B): 83% of eyes demonstrated clinically significant agreement (≤2 lines of difference from the mean difference), 89% of eyes demonstrated agreement with the 95% limits of agreement (−0.31 to 0.27 logMAR), and 69% of eyes had ≤1 line of difference from the mean difference.
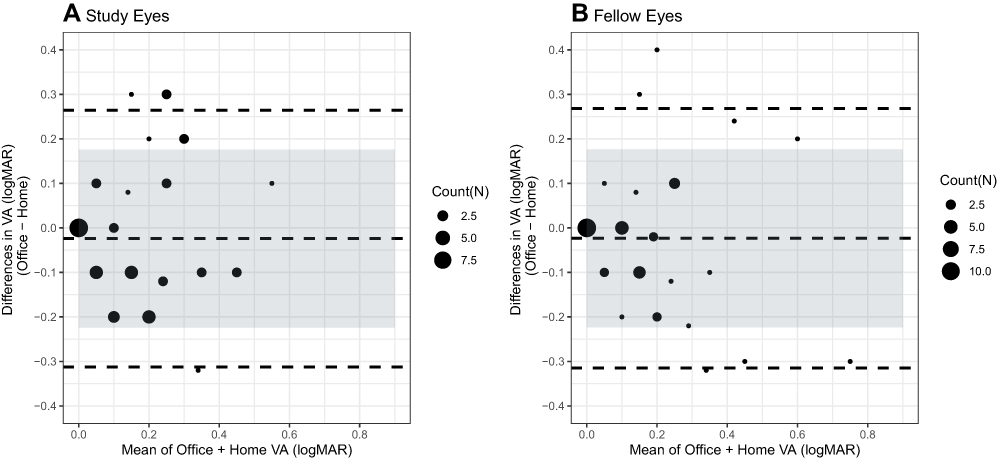 |
Figure 2 Bland-Altman Plot of Office versus Home Visual Acuity. Abbreviations: N, number; logMAR, logarithm of the Minimal Angle of Resolution. Notes: Bland-Altman plots of the difference between office and home visual acuity (VA) assessments versus the mean of office and home VA assessments for (A) Study eyes (N=45) and (B) Fellow eyes (N=42). The dashed center line indicates the mean difference and the dashed upper and lower lines indicate the 95% limits of agreement. Shaded regions represent the clinically acceptable limits of agreement, ± 0.2 logMAR from the mean difference. Counts demonstrate number of eyes at each point. |
We divided the cohort into those with “good vision” defined as vision better than or equal to 20/40 (the requirement for an unrestricted driver’s license in most states)13 and those with vision worse than 20/40 by their office VA scores. Thirty-eight (84%) of the study eyes had “good” vision. Interestingly, there was a significant mean difference between the office and home measurements for the “good” vision group (−0.05 logMAR, SD 0.13, P=0.01), though this was not clinically significant. For those with vision worse than 20/40, the mean difference was not significant at 0.13 logMAR (SD 0.17, P=0.09) (Table 2).
In a univariate regression analysis, age was not correlated with the amount of difference noted between the home and office vision assessments (P=0.67). There were also no significant effects on mean difference between the methods when we examined gender (P=0.28), glaucoma status (P=0.80), lens status (P=0.37), myopia (P=0.55) or uveitis (P=0.57).
Discussion
In this prospective, cross-sectional study, we assessed how patients performed when VA was self-measured at home using a modified ETDRS chart displayed in a PDF file compared to office-based Snellen testing. Patients completed the home test within one week of their office-based test. Patients enrolled had VA better than 20/125 by Snellen VA. This allowed for a buffer of >2 lines of vision from the upper limit on the home chart (20/200). In our study, the majority of patients had “good” vision, defined as better than or equal to 20/40. There was no statistically significant difference between the mean office-based VA compared to home VA. 91% of study eyes had clinically significant agreement (defined a priori as ≤0.2 logMAR lines of difference from the mean difference) and 60% of eyes had ≤0.1 logMAR line of difference from the mean difference.
In our subgroup analysis, there was a significant mean difference between the office and home measurements for those with “good” vision (better than or equal to 20/40), but not those with vision worse than 20/40. For the patients with “good” vision, the mean difference was −0.05 logMAR (SD 0.13, P=0.01), which was not clinically significant and likely within the range of normal variability for an individual.11,12 Furthermore, our study was not powered to detect a difference of <0.1 logMAR. For those with vision worse than 20/40, the mean difference was more than 1 line of vision (0.13 logMAR, SD 0.17, P=0.09), with eyes performing better with the home vision test compared to the office test. There were fewer study eyes in this “intermediate” vision group (N=7) and additional evaluation is needed with larger sample sizes powered for subgroup analysis.
In our study, there was no significant difference in test performance based on age, glaucoma or lens status (phakic versus pseudophakic). Given that the majority of our patients had good VA, if they had a cataract, it was likely not visually significant. Further assessment is needed to determine how home testing compares to office testing for those with visually significant cataracts and other ocular comorbidities that affect VA.
Our study found similar results compared to Crossland et al’s paper, which also evaluated office-based versus home self-assessment using a printable home vision test.7 They evaluated patients from adult strabismus and low vision clinics. The mean difference in VA for their patients was −0.10 logMAR (SD 0.17, range −0.5 to 0.3) with the office test indicating better vision than home assessment.7 In contrast, our study found similar results between the tests (mean difference −0.02 logMAR, SD 0.15). A limitation of their study was the long duration between office and home assessment (mean of 12 months, range 1–69 months), during which vision may have deteriorated. This may explain why their initial office vision was better than the subsequent home vision assessment. In our study, the time duration between home to office assessment was at most 1 week.
A similar study was recently published that evaluated the same home vision test used in this study for in-office ETDRS testing.14 They found that the home vision test was equivalent to in-office technician-administered ETDRS VA with a mean adjusted VA letter score difference of approximately 4 letters. One major difference is that our study compared the home vision test to in-office Snellen VA. While there are limitations to Snellen charts including variation in letters per line, spacing around letters, letter size, and progression between lines, it is still the dominant method for VA testing in clinical practice.3,9 As such, it is important to know how a home vision test utilized for screening, triaging and telemedicine compares to the standard of care for VA testing in the majority of ophthalmology practices.
One limitation to this study centers on the comparison of Snellen to ETDRS VA tests. ETDRS tests have theoretical advantages over the Snellen chart, primarily around standardization of letters and progression. Kaiser et al demonstrated that Snellen and ETDRS charts actually have good agreement of less than 1 line in patients with “good” VA (better than 20/50).9 In those with poor visual acuity (≤20/200), there was greater variation in VA and the difference between the charts was greater at 2 lines. We did not include patients with VA of 20/200 or worse and the majority of eyes in our study had “good” VA. Since the agreement between Snellen and ETDRS charts is 0.1 logMAR for those with “good” VA and our definition of clinically significant agreement exceeded that at ≤0.2 logMAR, our study should theoretically be able to detect any differences between the home and in-office tests that are due to other reasons aside from the comparison of Snellen to ETDRS charts.
One limitation of all home self-assessment tests is that they are inherently subject to more variabilities than in-office vision assessment. In our study, few patients reported how they used the PDF document: as a printed version, on the computer or on a mobile/tablet device. Environmental factors such as the resolution and brightness of the computer screen or mobile device, or the lighting in the room may affect home vision results. While we provided detailed instructions, such as testing one eye at a time, setting the printed vision chart 5 feet away and wearing distance spectacles, patients may not have followed these instructions. This is one inherent limitation of all real-world studies in imperfect conditions compared to studies in optimized clinical or research conditions. However, the main objective of this study was to assess if the home vision test could be used as a screening method with an agreement of ≤0.2 logMAR from in-office Snellen testing to detect clinically significant change in vision that would prompt further in office VA testing.
Other limitations of this study include generalizability. We limited our enrollment to literate English-speaking patients with secure messaging access and vision better than 20/125 from glaucoma clinics. We did not assess many patients with moderate or more advanced visual impairment, and there may have been increased variability between the testing methods for patients with poorer vision. However, the home vision test does max out at a visual acuity of 20/200 for a standardized distance of 5 feet, limiting assessment to patients with moderate visual impairment or better. Furthermore, our study design and timing during the SARS-CoV-2 pandemic did not allow us to assess for repeatability. Future directions include enrollment of a larger, more diverse cohort with more patients with vision worse than 20/40 and standardization of how patients use the home vision test (ie, printed, on a computer or on a mobile/tablet device). Lastly, test-retest reliability should be assessed by having patients perform both the office and home vision tests more than once on different days.
In conclusion, our study demonstrated a high level of agreement between self-measured home vision using a modified ETDRS chart displayed in a PDF document and technician-measured office-based Snellen VA. There was more agreement in those with “good” vision of 20/40 or better compared to those with vision worse than 20/40. This home vision test is a helpful triaging and screening tool with potential use in telemedicine in those with VA better than 20/125 to determine if there is a significant change in vision of greater than 2 lines.
Acknowledgment
We thank Joseph Miller, MD, MPH and his team at the University of Arizona for developing and providing access to the home vision PDF. We thank Benjamin Arnold, PhD (UCSF) for guidance on statistical analysis.
Funding
This work was supported in part by the following grants: National Institutes of Health [NEI K12EY031372]; Research to Prevent Blindness unrestricted grant and National Institutes of Health [NIH-NEI P30 EY002162 – Core Grant for Vision Research]. The sponsors or funding organizations had no role in the design or conduct of this research.
Disclosure
Dr Julie M Schallhorn reports personal fees from Zeiss, Allergan, Vanda, and Long Bridge Medical, outside the submitted work. The authors report no other conflicts of interest in this work.
References
1. Saleem SM, Pasquale LR, Sidoti PA, et al. Virtual ophthalmology: telemedicine in a COVID-19 era. Am J Ophthalmol. 2020;216:237–242. doi:10.1016/j.ajo.2020.04.029
2. Yeung WK, Dawes P, Pye A, et al. eHealth tools for the self-testing of visual acuity: a scoping review. NPJ Digit Med. 2019;2:82. doi:10.1038/s41746-019-0154-5
3. Bastawrous A, Rono HK, Livingstone IAT, et al. Development and validation of a smartphone-based visual acuity test (peek acuity) for clinical practice and community-based fieldwork. JAMA Ophthalmol. 2015;133:930–937. doi:10.1001/jamaophthalmol.2015.1468
4. Black JM, Jacobs RJ, Phillips G, et al. An assessment of the iPad as a testing platform for distance visual acuity in adults. BMJ Open. 2013;3:e002730. doi:10.1136/bmjopen-2013-002730
5. Perera C, Chakrabarti R, Islam FM, et al. The eye phone study: reliability and accuracy of assessing Snellen visual acuity using smartphone technology. Eye. 2015;29:888–894. doi:10.1038/eye.2015.60
6. Phung L, Gregori NZ, Ortiz A, et al. Reproducibility and comparison of visual acuity obtained with sightbook mobile application to near card and Snellen chart. Retina. 2016;36:1009–1020. doi:10.1097/iae.0000000000000818
7. Crossland MD, Dekker TM, Hancox J, et al. Evaluation of a home-printable vision screening test for telemedicine. JAMA Ophthalmol. 2021;139:271. doi:10.1001/jamaophthalmol.2020.5972
8. Miller JM, Jang HS, Ramesh D, et al. Telemedicine distance and near visual acuity tests for adults and children. J Am Assoc Pediatr Ophthalmol Strabismus. 2020;24(4):235–236. doi:10.1016/j.jaapos.2020.06.003
9. Kaiser PK. Prospective evaluation of visual acuity assessment: a comparison of Snellen versus ETDRS charts in clinical practice (An AOS Thesis). Trans Am Ophthalmol Soc. 2009;107:311–324.
10. Bland JM, Altman DG. Statistical methods for assessing agreement between two methods of clinical measurement. Lancet. 1986;327:307–310. doi:10.1016/S0140-6736(86)90837-8
11. Rosser DA, Cousens SN, Murdoch IE, et al. How sensitive to clinical change are ETDRS logMAR visual acuity measurements? Invest Ophthalmol Vis Sci. 2003;44:3278–3281. doi:10.1167/iovs.02-1100
12. Siderov J, Tiu AL. Variability of measurements of visual acuity in a large eye clinic. Acta Ophthalmol Scand. 1999;77:673–676. doi:10.1034/j.1600-0420.1999.770613.x
13. Beketova T, Igbinoba R. Driving restrictions per state. Am Acad Ophthalmol. 2020.
14. Siktberg J, Hamdan S, Liu Y, et al. Validation of a standardized home visual acuity test for teleophthalmology. Ophthalmol Sci. 2021;1:100007. doi:10.1016/j.xops.2021.100007
 © 2021 The Author(s). This work is published and licensed by Dove Medical Press Limited. The
full terms of this license are available at https://www.dovepress.com/terms
and incorporate the Creative Commons Attribution
- Non Commercial (unported, 3.0) License.
By accessing the work you hereby accept the Terms. Non-commercial uses of the work are permitted
without any further permission from Dove Medical Press Limited, provided the work is properly
attributed. For permission for commercial use of this work, please see paragraphs 4.2 and 5 of our Terms.
© 2021 The Author(s). This work is published and licensed by Dove Medical Press Limited. The
full terms of this license are available at https://www.dovepress.com/terms
and incorporate the Creative Commons Attribution
- Non Commercial (unported, 3.0) License.
By accessing the work you hereby accept the Terms. Non-commercial uses of the work are permitted
without any further permission from Dove Medical Press Limited, provided the work is properly
attributed. For permission for commercial use of this work, please see paragraphs 4.2 and 5 of our Terms.